

Key Insights
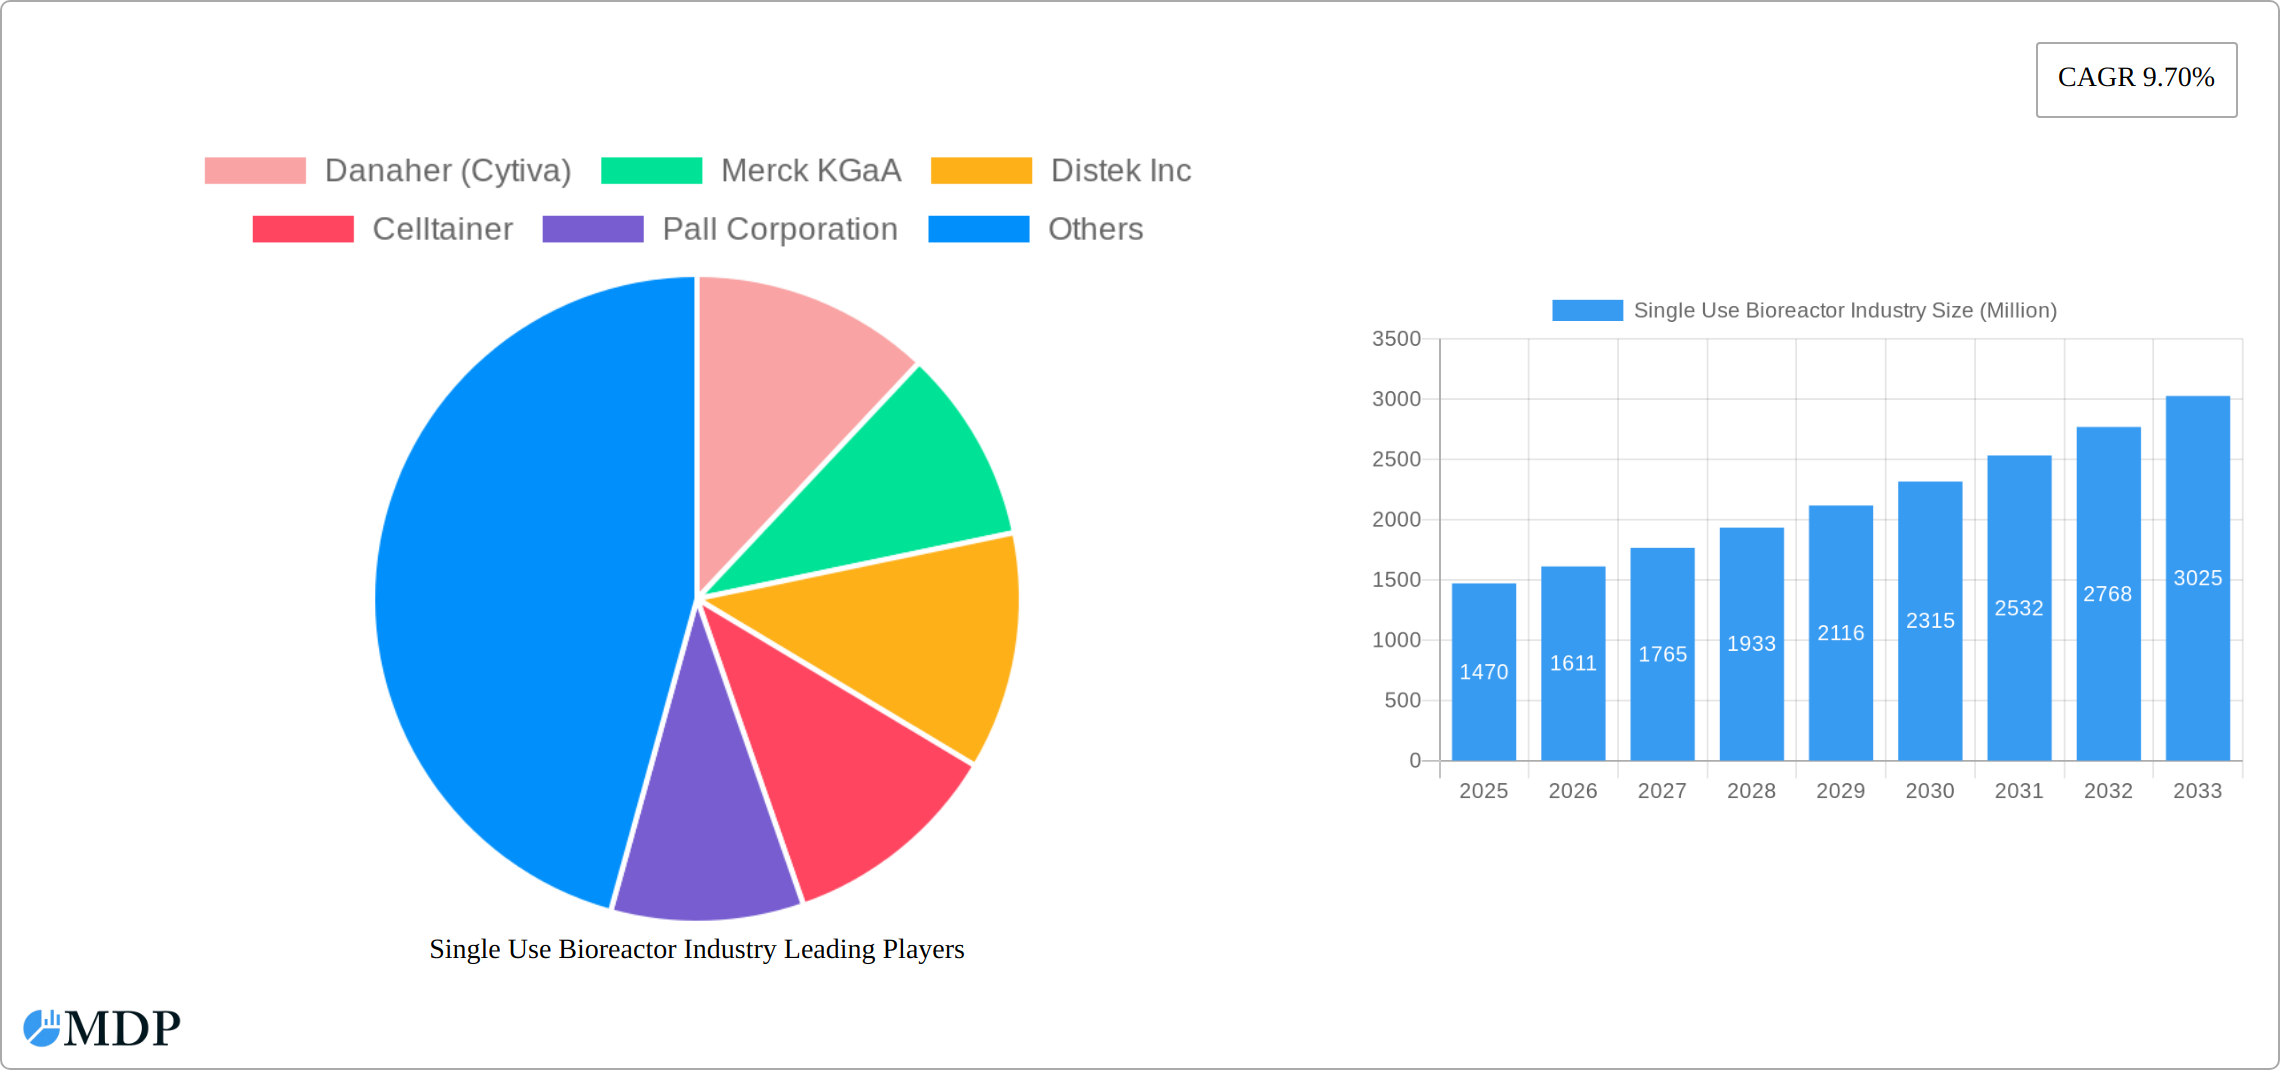
The single-use bioreactor market, valued at $1.47 billion in 2025, is experiencing robust growth, projected to expand at a Compound Annual Growth Rate (CAGR) of 9.70% from 2025 to 2033. This surge is driven primarily by the increasing demand for biopharmaceuticals, particularly vaccines and monoclonal antibodies, coupled with the inherent advantages of single-use systems over traditional stainless steel bioreactors. These advantages include reduced cleaning and sterilization costs, faster turnaround times, and minimized risk of cross-contamination, leading to enhanced efficiency and reduced manufacturing costs for biopharmaceutical companies. The market segmentation reveals significant opportunities across various product types, including single-use bioreactor systems, media bags, and filtration assemblies, with mammalian cell-based production currently dominating. The pharmaceutical and biopharmaceutical industries represent the largest end-user segment, fueled by the continuous pipeline of novel therapeutic agents and the expanding global demand for biologics. Technological advancements, such as the development of advanced sensors and automated control systems, further contribute to market growth. The rising adoption of continuous manufacturing processes, and the growing preference for personalized medicine also add significant momentum.
Continued innovation is expected to drive further market expansion. The increasing prevalence of chronic diseases globally, coupled with ongoing research and development activities in advanced therapies such as cell and gene therapies, are key factors underpinning the long-term growth trajectory. While regulatory hurdles and the initial capital investment associated with adopting single-use technologies might pose some challenges, the overall market outlook remains exceptionally positive. Geographic expansion is also expected, with Asia-Pacific showing substantial growth potential due to increased investment in biopharmaceutical manufacturing facilities and a rising middle class driving the demand for healthcare services. Major players like Danaher (Cytiva), Merck KGaA, and Thermo Fisher Scientific are strategically positioning themselves to capitalize on these market opportunities through product innovation and strategic acquisitions.
Single-Use Bioreactor Industry: A Comprehensive Market Report (2019-2033)
This comprehensive report provides an in-depth analysis of the Single-Use Bioreactor industry, offering invaluable insights for stakeholders across the pharmaceutical, biopharmaceutical, and contract research organizations (CRO) sectors. The report covers the period 2019-2033, with a focus on the 2025-2033 forecast period, utilizing 2025 as the base year. The study delves into market dynamics, technological advancements, leading players, and future growth opportunities within this rapidly evolving sector. The global market size is projected to reach xx Million by 2033.
Single Use Bioreactor Industry Market Dynamics & Concentration
The single-use bioreactor market is characterized by a moderately concentrated landscape, with key players like Danaher (Cytiva), Merck KGaA, Sartorius AG, and Thermo Fisher Scientific holding significant market share. However, the market also features several smaller, specialized companies contributing to innovation and competition. The industry is driven by increasing demand for biologics, advancements in single-use technologies, and a growing preference for flexible and cost-effective manufacturing solutions. Stringent regulatory frameworks, particularly regarding GMP (Good Manufacturing Practices), significantly influence market dynamics. Product substitutes, primarily reusable bioreactors, continue to exist but face increasing competition from single-use alternatives due to their inherent advantages in terms of sterility, reduced cleaning validation requirements, and flexibility. End-user trends show a shift towards outsourcing manufacturing to CROs, driving demand for single-use bioreactors within these organizations. M&A activities in the sector are frequent, reflecting the industry's consolidation and growth trajectory. Over the past five years (2019-2024), an estimated xx M&A deals occurred, with an average annual deal value of xx Million. Market share data for the top 5 players is projected to be:
- Danaher (Cytiva): xx%
- Merck KGaA: xx%
- Sartorius AG: xx%
- Thermo Fisher Scientific: xx%
- Others: xx%
Single Use Bioreactor Industry Industry Trends & Analysis
The single-use bioreactor market exhibits robust growth, driven primarily by the increasing demand for biologics, such as monoclonal antibodies, vaccines, and recombinant proteins. The market is witnessing significant technological disruptions, including the development of advanced sensor technologies for real-time process monitoring, improved material compatibility, and miniaturization of bioreactors for personalized medicine applications. Consumer preferences are shifting towards single-use systems owing to their inherent advantages in terms of reduced contamination risks, simplified cleaning validation, and enhanced process flexibility. Competitive dynamics are intense, with major players investing heavily in R&D to enhance their product portfolios and expand their market share. The market's Compound Annual Growth Rate (CAGR) during the historical period (2019-2024) was approximately xx%, and is projected to reach xx% during the forecast period (2025-2033). Market penetration for single-use bioreactors in the overall bioreactor market is estimated at xx% in 2025, with a projected increase to xx% by 2033.

Leading Markets & Segments in Single Use Bioreactor Industry
North America currently holds the dominant position in the single-use bioreactor market, followed by Europe and Asia-Pacific. This dominance is driven by factors including:
- High concentration of pharmaceutical and biotechnology companies: North America possesses a significant number of established pharmaceutical and biotechnology companies, leading to high demand for single-use bioreactors.
- Robust research and development infrastructure: The region benefits from extensive research and development activities in life sciences, translating into a favorable environment for innovation and adoption of advanced bioreactor technologies.
- Favorable regulatory environment: Supportive regulatory frameworks facilitate the swift adoption and approval of new bioreactor technologies.
Key Segment Analysis:
- Product Type: Single-use bioreactor systems comprise the largest segment, followed by media bags and filtration assemblies. Other products, such as sensors and tubing, are also experiencing growth.
- Cell Type: Mammalian cells remain the dominant cell type, reflecting the predominance of monoclonal antibody production. However, bacterial and yeast cell-based applications are also significant.
- Molecule Type: Monoclonal antibodies currently constitute the largest application segment, followed by vaccines and recombinant proteins. The demand for stem cell-based therapies is also driving growth in this segment.
- End User: The pharmaceutical and biopharmaceutical industries are the primary end users, with CROs also contributing significantly to market growth.
Single Use Bioreactor Industry Product Developments
Recent product innovations focus on enhancing process control, scalability, and reducing costs. Advances in sensor technology enable real-time monitoring of critical process parameters, optimizing production efficiency and product quality. The development of novel bioreactor designs, such as those incorporating advanced mixing systems and improved oxygen transfer capabilities, enhances production yields. These innovations cater to the industry's demand for increased efficiency, reduced risk of contamination, and improved overall process economics. The market is witnessing a trend toward modular and scalable systems that can adapt to different production scales and diverse applications.
Key Drivers of Single Use Bioreactor Industry Growth
Several factors contribute to the industry's growth:
- Technological advancements: Innovations in single-use materials, sensor technology, and bioreactor design enhance efficiency and reduce contamination risks.
- Increased demand for biologics: The rising prevalence of chronic diseases and increased focus on biologics-based therapies fuel market demand.
- Favorable regulatory environment: Supportive regulatory frameworks and guidelines accelerate the adoption of single-use technologies. The increasing demand for faster time-to-market for new therapies pushes the adoption of single use bioreactors.
Challenges in the Single Use Bioreactor Industry Market
Despite the positive outlook, the industry faces certain challenges:
- Regulatory hurdles: Obtaining regulatory approvals for new single-use bioreactor technologies can be time-consuming and costly. Compliance with stringent GMP requirements adds to the complexity.
- Supply chain disruptions: The industry’s reliance on specialized materials and components can lead to supply chain vulnerabilities. Geopolitical factors and material shortages can impact production.
- Pricing pressures: Competition from established players and emerging entrants can put downward pressure on prices, impacting profitability.
Emerging Opportunities in Single Use Bioreactor Industry
Emerging opportunities stem from several developments:
- Technological breakthroughs: Advances in automation, artificial intelligence, and process analytical technology are poised to further optimize bioreactor performance.
- Strategic partnerships: Collaboration between bioreactor manufacturers and pharmaceutical companies accelerate product development and market penetration.
- Market expansion: The growing demand for single-use technologies in emerging markets offers significant opportunities for expansion and growth.
Leading Players in the Single Use Bioreactor Industry Sector
- Danaher (Cytiva)
- Merck KGaA
- Distek Inc
- Celltainer
- Pall Corporation
- Eppendorf SE
- Sartorius AG
- Thermo Fisher Scientific
- OmniBRx Biotechnologies
- ABEC
Key Milestones in Single Use Bioreactor Industry Industry
- June 2022: mAbxience installs an additional ABEC 4,000L CSR bioreactor, expanding its CDMO capabilities.
- May 2022: RD-Biotech partners with Pall Corporation for single-use solutions in pDNA manufacturing.
Strategic Outlook for Single Use Bioreactor Industry Market
The single-use bioreactor market is poised for continued growth, driven by technological advancements, increasing demand for biologics, and supportive regulatory environments. Strategic partnerships and investments in R&D will further shape the industry landscape. The market's long-term potential is significant, particularly in emerging markets and niche applications such as personalized medicine and cell therapy. Companies focusing on innovation, scalability, and cost-effectiveness will be well-positioned to capture market share and drive future growth.
Single Use Bioreactor Industry Segmentation
-
1. Type of Product
- 1.1. Single-use Bioreactor Systems
- 1.2. Media Bags
- 1.3. Filtration Assemblies
- 1.4. Other Products
-
2. Cell Type
- 2.1. Mammalian Cell
- 2.2. Bacteria
- 2.3. Yeast
- 2.4. Other Cell Types
-
3. Molecule Type
- 3.1. Vaccines
- 3.2. Monoclonal Antibodies
- 3.3. Stem Cells
- 3.4. Recombinant Proteins
- 3.5. Other Molecule Types
-
4. End User
- 4.1. Pharmaceutical and Biopharmaceutical Industries
- 4.2. Contract Research Organizations (CRO)
- 4.3. Other End Users
Single Use Bioreactor Industry Segmentation By Geography
-
1. North America
- 1.1. United States
- 1.2. Canada
- 1.3. Mexico
-
2. Europe
- 2.1. Germany
- 2.2. United Kingdom
- 2.3. France
- 2.4. Italy
- 2.5. Spain
- 2.6. Rest of Europe
-
3. Asia Pacific
- 3.1. China
- 3.2. Japan
- 3.3. India
- 3.4. Australia
- 3.5. South Korea
- 3.6. Rest of Asia Pacific
-
4. Middle East and Africa
- 4.1. GCC
- 4.2. South Africa
- 4.3. Rest of Middle East and Africa
-
5. South America
- 5.1. Brazil
- 5.2. Argentina
- 5.3. Rest of South America

Single Use Bioreactor Industry REPORT HIGHLIGHTS
| Aspects | Details |
|---|---|
| Study Period | 2019-2033 |
| Base Year | 2024 |
| Estimated Year | 2025 |
| Forecast Period | 2025-2033 |
| Historical Period | 2019-2024 |
| Growth Rate | CAGR of 9.70% from 2019-2033 |
| Segmentation |
|
Table of Contents
- 1. Introduction
- 1.1. Research Scope
- 1.2. Market Segmentation
- 1.3. Research Methodology
- 1.4. Definitions and Assumptions
- 2. Executive Summary
- 2.1. Introduction
- 3. Market Dynamics
- 3.1. Introduction
- 3.2. Market Drivers
- 3.2.1. Rapid Adoption of Single-use Technologies (SUTs) by the Industry; Cost Effectiveness and Lower Downtime; New Product Launches
- 3.3. Market Restrains
- 3.3.1. High Regular Recurring Expenses; Issues with Meeting the Standards of Good Manufacturing Practices
- 3.4. Market Trends
- 3.4.1. Monoclonal Antibodies Segment is Anticipated to Witness Growth
- 4. Market Factor Analysis
- 4.1. Porters Five Forces
- 4.2. Supply/Value Chain
- 4.3. PESTEL analysis
- 4.4. Market Entropy
- 4.5. Patent/Trademark Analysis
- 5. Global Single Use Bioreactor Industry Analysis, Insights and Forecast, 2019-2031
- 5.1. Market Analysis, Insights and Forecast - by Type of Product
- 5.1.1. Single-use Bioreactor Systems
- 5.1.2. Media Bags
- 5.1.3. Filtration Assemblies
- 5.1.4. Other Products
- 5.2. Market Analysis, Insights and Forecast - by Cell Type
- 5.2.1. Mammalian Cell
- 5.2.2. Bacteria
- 5.2.3. Yeast
- 5.2.4. Other Cell Types
- 5.3. Market Analysis, Insights and Forecast - by Molecule Type
- 5.3.1. Vaccines
- 5.3.2. Monoclonal Antibodies
- 5.3.3. Stem Cells
- 5.3.4. Recombinant Proteins
- 5.3.5. Other Molecule Types
- 5.4. Market Analysis, Insights and Forecast - by End User
- 5.4.1. Pharmaceutical and Biopharmaceutical Industries
- 5.4.2. Contract Research Organizations (CRO)
- 5.4.3. Other End Users
- 5.5. Market Analysis, Insights and Forecast - by Region
- 5.5.1. North America
- 5.5.2. Europe
- 5.5.3. Asia Pacific
- 5.5.4. Middle East and Africa
- 5.5.5. South America
- 5.1. Market Analysis, Insights and Forecast - by Type of Product
- 6. North America Single Use Bioreactor Industry Analysis, Insights and Forecast, 2019-2031
- 6.1. Market Analysis, Insights and Forecast - by Type of Product
- 6.1.1. Single-use Bioreactor Systems
- 6.1.2. Media Bags
- 6.1.3. Filtration Assemblies
- 6.1.4. Other Products
- 6.2. Market Analysis, Insights and Forecast - by Cell Type
- 6.2.1. Mammalian Cell
- 6.2.2. Bacteria
- 6.2.3. Yeast
- 6.2.4. Other Cell Types
- 6.3. Market Analysis, Insights and Forecast - by Molecule Type
- 6.3.1. Vaccines
- 6.3.2. Monoclonal Antibodies
- 6.3.3. Stem Cells
- 6.3.4. Recombinant Proteins
- 6.3.5. Other Molecule Types
- 6.4. Market Analysis, Insights and Forecast - by End User
- 6.4.1. Pharmaceutical and Biopharmaceutical Industries
- 6.4.2. Contract Research Organizations (CRO)
- 6.4.3. Other End Users
- 6.1. Market Analysis, Insights and Forecast - by Type of Product
- 7. Europe Single Use Bioreactor Industry Analysis, Insights and Forecast, 2019-2031
- 7.1. Market Analysis, Insights and Forecast - by Type of Product
- 7.1.1. Single-use Bioreactor Systems
- 7.1.2. Media Bags
- 7.1.3. Filtration Assemblies
- 7.1.4. Other Products
- 7.2. Market Analysis, Insights and Forecast - by Cell Type
- 7.2.1. Mammalian Cell
- 7.2.2. Bacteria
- 7.2.3. Yeast
- 7.2.4. Other Cell Types
- 7.3. Market Analysis, Insights and Forecast - by Molecule Type
- 7.3.1. Vaccines
- 7.3.2. Monoclonal Antibodies
- 7.3.3. Stem Cells
- 7.3.4. Recombinant Proteins
- 7.3.5. Other Molecule Types
- 7.4. Market Analysis, Insights and Forecast - by End User
- 7.4.1. Pharmaceutical and Biopharmaceutical Industries
- 7.4.2. Contract Research Organizations (CRO)
- 7.4.3. Other End Users
- 7.1. Market Analysis, Insights and Forecast - by Type of Product
- 8. Asia Pacific Single Use Bioreactor Industry Analysis, Insights and Forecast, 2019-2031
- 8.1. Market Analysis, Insights and Forecast - by Type of Product
- 8.1.1. Single-use Bioreactor Systems
- 8.1.2. Media Bags
- 8.1.3. Filtration Assemblies
- 8.1.4. Other Products
- 8.2. Market Analysis, Insights and Forecast - by Cell Type
- 8.2.1. Mammalian Cell
- 8.2.2. Bacteria
- 8.2.3. Yeast
- 8.2.4. Other Cell Types
- 8.3. Market Analysis, Insights and Forecast - by Molecule Type
- 8.3.1. Vaccines
- 8.3.2. Monoclonal Antibodies
- 8.3.3. Stem Cells
- 8.3.4. Recombinant Proteins
- 8.3.5. Other Molecule Types
- 8.4. Market Analysis, Insights and Forecast - by End User
- 8.4.1. Pharmaceutical and Biopharmaceutical Industries
- 8.4.2. Contract Research Organizations (CRO)
- 8.4.3. Other End Users
- 8.1. Market Analysis, Insights and Forecast - by Type of Product
- 9. Middle East and Africa Single Use Bioreactor Industry Analysis, Insights and Forecast, 2019-2031
- 9.1. Market Analysis, Insights and Forecast - by Type of Product
- 9.1.1. Single-use Bioreactor Systems
- 9.1.2. Media Bags
- 9.1.3. Filtration Assemblies
- 9.1.4. Other Products
- 9.2. Market Analysis, Insights and Forecast - by Cell Type
- 9.2.1. Mammalian Cell
- 9.2.2. Bacteria
- 9.2.3. Yeast
- 9.2.4. Other Cell Types
- 9.3. Market Analysis, Insights and Forecast - by Molecule Type
- 9.3.1. Vaccines
- 9.3.2. Monoclonal Antibodies
- 9.3.3. Stem Cells
- 9.3.4. Recombinant Proteins
- 9.3.5. Other Molecule Types
- 9.4. Market Analysis, Insights and Forecast - by End User
- 9.4.1. Pharmaceutical and Biopharmaceutical Industries
- 9.4.2. Contract Research Organizations (CRO)
- 9.4.3. Other End Users
- 9.1. Market Analysis, Insights and Forecast - by Type of Product
- 10. South America Single Use Bioreactor Industry Analysis, Insights and Forecast, 2019-2031
- 10.1. Market Analysis, Insights and Forecast - by Type of Product
- 10.1.1. Single-use Bioreactor Systems
- 10.1.2. Media Bags
- 10.1.3. Filtration Assemblies
- 10.1.4. Other Products
- 10.2. Market Analysis, Insights and Forecast - by Cell Type
- 10.2.1. Mammalian Cell
- 10.2.2. Bacteria
- 10.2.3. Yeast
- 10.2.4. Other Cell Types
- 10.3. Market Analysis, Insights and Forecast - by Molecule Type
- 10.3.1. Vaccines
- 10.3.2. Monoclonal Antibodies
- 10.3.3. Stem Cells
- 10.3.4. Recombinant Proteins
- 10.3.5. Other Molecule Types
- 10.4. Market Analysis, Insights and Forecast - by End User
- 10.4.1. Pharmaceutical and Biopharmaceutical Industries
- 10.4.2. Contract Research Organizations (CRO)
- 10.4.3. Other End Users
- 10.1. Market Analysis, Insights and Forecast - by Type of Product
- 11. North America Single Use Bioreactor Industry Analysis, Insights and Forecast, 2019-2031
- 11.1. Market Analysis, Insights and Forecast - By Country/Sub-region
- 11.1.1 United States
- 11.1.2 Canada
- 11.1.3 Mexico
- 12. South America Single Use Bioreactor Industry Analysis, Insights and Forecast, 2019-2031
- 12.1. Market Analysis, Insights and Forecast - By Country/Sub-region
- 12.1.1 Brazil
- 12.1.2 Mexico
- 12.1.3 Rest of South America
- 13. Europe Single Use Bioreactor Industry Analysis, Insights and Forecast, 2019-2031
- 13.1. Market Analysis, Insights and Forecast - By Country/Sub-region
- 13.1.1 Germany
- 13.1.2 United Kingdom
- 13.1.3 France
- 13.1.4 Italy
- 13.1.5 Spain
- 13.1.6 Rest of Europe
- 14. MEA Single Use Bioreactor Industry Analysis, Insights and Forecast, 2019-2031
- 14.1. Market Analysis, Insights and Forecast - By Country/Sub-region
- 14.1.1 Middle East
- 14.1.2 Africa
- 15. Asia Pacific Single Use Bioreactor Industry Analysis, Insights and Forecast, 2019-2031
- 15.1. Market Analysis, Insights and Forecast - By Country/Sub-region
- 15.1.1 China
- 15.1.2 Japan
- 15.1.3 India
- 15.1.4 South Korea
- 15.1.5 Taiwan
- 15.1.6 Australia
- 15.1.7 Rest of Asia-Pacific
- 16. Competitive Analysis
- 16.1. Global Market Share Analysis 2024
- 16.2. Company Profiles
- 16.2.1 Danaher (Cytiva)
- 16.2.1.1. Overview
- 16.2.1.2. Products
- 16.2.1.3. SWOT Analysis
- 16.2.1.4. Recent Developments
- 16.2.1.5. Financials (Based on Availability)
- 16.2.2 Merck KGaA
- 16.2.2.1. Overview
- 16.2.2.2. Products
- 16.2.2.3. SWOT Analysis
- 16.2.2.4. Recent Developments
- 16.2.2.5. Financials (Based on Availability)
- 16.2.3 Distek Inc
- 16.2.3.1. Overview
- 16.2.3.2. Products
- 16.2.3.3. SWOT Analysis
- 16.2.3.4. Recent Developments
- 16.2.3.5. Financials (Based on Availability)
- 16.2.4 Celltainer
- 16.2.4.1. Overview
- 16.2.4.2. Products
- 16.2.4.3. SWOT Analysis
- 16.2.4.4. Recent Developments
- 16.2.4.5. Financials (Based on Availability)
- 16.2.5 Pall Corporation
- 16.2.5.1. Overview
- 16.2.5.2. Products
- 16.2.5.3. SWOT Analysis
- 16.2.5.4. Recent Developments
- 16.2.5.5. Financials (Based on Availability)
- 16.2.6 Eppendorf SE
- 16.2.6.1. Overview
- 16.2.6.2. Products
- 16.2.6.3. SWOT Analysis
- 16.2.6.4. Recent Developments
- 16.2.6.5. Financials (Based on Availability)
- 16.2.7 Sartorius AG
- 16.2.7.1. Overview
- 16.2.7.2. Products
- 16.2.7.3. SWOT Analysis
- 16.2.7.4. Recent Developments
- 16.2.7.5. Financials (Based on Availability)
- 16.2.8 Thermo Fisher Scientific
- 16.2.8.1. Overview
- 16.2.8.2. Products
- 16.2.8.3. SWOT Analysis
- 16.2.8.4. Recent Developments
- 16.2.8.5. Financials (Based on Availability)
- 16.2.9 OmniBRx Biotechnologies
- 16.2.9.1. Overview
- 16.2.9.2. Products
- 16.2.9.3. SWOT Analysis
- 16.2.9.4. Recent Developments
- 16.2.9.5. Financials (Based on Availability)
- 16.2.10 ABEC
- 16.2.10.1. Overview
- 16.2.10.2. Products
- 16.2.10.3. SWOT Analysis
- 16.2.10.4. Recent Developments
- 16.2.10.5. Financials (Based on Availability)
- 16.2.1 Danaher (Cytiva)
List of Figures
- Figure 1: Global Single Use Bioreactor Industry Revenue Breakdown (Million, %) by Region 2024 & 2032
- Figure 2: Global Single Use Bioreactor Industry Volume Breakdown (K Units, %) by Region 2024 & 2032
- Figure 3: North America Single Use Bioreactor Industry Revenue (Million), by Country 2024 & 2032
- Figure 4: North America Single Use Bioreactor Industry Volume (K Units), by Country 2024 & 2032
- Figure 5: North America Single Use Bioreactor Industry Revenue Share (%), by Country 2024 & 2032
- Figure 6: North America Single Use Bioreactor Industry Volume Share (%), by Country 2024 & 2032
- Figure 7: South America Single Use Bioreactor Industry Revenue (Million), by Country 2024 & 2032
- Figure 8: South America Single Use Bioreactor Industry Volume (K Units), by Country 2024 & 2032
- Figure 9: South America Single Use Bioreactor Industry Revenue Share (%), by Country 2024 & 2032
- Figure 10: South America Single Use Bioreactor Industry Volume Share (%), by Country 2024 & 2032
- Figure 11: Europe Single Use Bioreactor Industry Revenue (Million), by Country 2024 & 2032
- Figure 12: Europe Single Use Bioreactor Industry Volume (K Units), by Country 2024 & 2032
- Figure 13: Europe Single Use Bioreactor Industry Revenue Share (%), by Country 2024 & 2032
- Figure 14: Europe Single Use Bioreactor Industry Volume Share (%), by Country 2024 & 2032
- Figure 15: MEA Single Use Bioreactor Industry Revenue (Million), by Country 2024 & 2032
- Figure 16: MEA Single Use Bioreactor Industry Volume (K Units), by Country 2024 & 2032
- Figure 17: MEA Single Use Bioreactor Industry Revenue Share (%), by Country 2024 & 2032
- Figure 18: MEA Single Use Bioreactor Industry Volume Share (%), by Country 2024 & 2032
- Figure 19: Asia Pacific Single Use Bioreactor Industry Revenue (Million), by Country 2024 & 2032
- Figure 20: Asia Pacific Single Use Bioreactor Industry Volume (K Units), by Country 2024 & 2032
- Figure 21: Asia Pacific Single Use Bioreactor Industry Revenue Share (%), by Country 2024 & 2032
- Figure 22: Asia Pacific Single Use Bioreactor Industry Volume Share (%), by Country 2024 & 2032
- Figure 23: North America Single Use Bioreactor Industry Revenue (Million), by Type of Product 2024 & 2032
- Figure 24: North America Single Use Bioreactor Industry Volume (K Units), by Type of Product 2024 & 2032
- Figure 25: North America Single Use Bioreactor Industry Revenue Share (%), by Type of Product 2024 & 2032
- Figure 26: North America Single Use Bioreactor Industry Volume Share (%), by Type of Product 2024 & 2032
- Figure 27: North America Single Use Bioreactor Industry Revenue (Million), by Cell Type 2024 & 2032
- Figure 28: North America Single Use Bioreactor Industry Volume (K Units), by Cell Type 2024 & 2032
- Figure 29: North America Single Use Bioreactor Industry Revenue Share (%), by Cell Type 2024 & 2032
- Figure 30: North America Single Use Bioreactor Industry Volume Share (%), by Cell Type 2024 & 2032
- Figure 31: North America Single Use Bioreactor Industry Revenue (Million), by Molecule Type 2024 & 2032
- Figure 32: North America Single Use Bioreactor Industry Volume (K Units), by Molecule Type 2024 & 2032
- Figure 33: North America Single Use Bioreactor Industry Revenue Share (%), by Molecule Type 2024 & 2032
- Figure 34: North America Single Use Bioreactor Industry Volume Share (%), by Molecule Type 2024 & 2032
- Figure 35: North America Single Use Bioreactor Industry Revenue (Million), by End User 2024 & 2032
- Figure 36: North America Single Use Bioreactor Industry Volume (K Units), by End User 2024 & 2032
- Figure 37: North America Single Use Bioreactor Industry Revenue Share (%), by End User 2024 & 2032
- Figure 38: North America Single Use Bioreactor Industry Volume Share (%), by End User 2024 & 2032
- Figure 39: North America Single Use Bioreactor Industry Revenue (Million), by Country 2024 & 2032
- Figure 40: North America Single Use Bioreactor Industry Volume (K Units), by Country 2024 & 2032
- Figure 41: North America Single Use Bioreactor Industry Revenue Share (%), by Country 2024 & 2032
- Figure 42: North America Single Use Bioreactor Industry Volume Share (%), by Country 2024 & 2032
- Figure 43: Europe Single Use Bioreactor Industry Revenue (Million), by Type of Product 2024 & 2032
- Figure 44: Europe Single Use Bioreactor Industry Volume (K Units), by Type of Product 2024 & 2032
- Figure 45: Europe Single Use Bioreactor Industry Revenue Share (%), by Type of Product 2024 & 2032
- Figure 46: Europe Single Use Bioreactor Industry Volume Share (%), by Type of Product 2024 & 2032
- Figure 47: Europe Single Use Bioreactor Industry Revenue (Million), by Cell Type 2024 & 2032
- Figure 48: Europe Single Use Bioreactor Industry Volume (K Units), by Cell Type 2024 & 2032
- Figure 49: Europe Single Use Bioreactor Industry Revenue Share (%), by Cell Type 2024 & 2032
- Figure 50: Europe Single Use Bioreactor Industry Volume Share (%), by Cell Type 2024 & 2032
- Figure 51: Europe Single Use Bioreactor Industry Revenue (Million), by Molecule Type 2024 & 2032
- Figure 52: Europe Single Use Bioreactor Industry Volume (K Units), by Molecule Type 2024 & 2032
- Figure 53: Europe Single Use Bioreactor Industry Revenue Share (%), by Molecule Type 2024 & 2032
- Figure 54: Europe Single Use Bioreactor Industry Volume Share (%), by Molecule Type 2024 & 2032
- Figure 55: Europe Single Use Bioreactor Industry Revenue (Million), by End User 2024 & 2032
- Figure 56: Europe Single Use Bioreactor Industry Volume (K Units), by End User 2024 & 2032
- Figure 57: Europe Single Use Bioreactor Industry Revenue Share (%), by End User 2024 & 2032
- Figure 58: Europe Single Use Bioreactor Industry Volume Share (%), by End User 2024 & 2032
- Figure 59: Europe Single Use Bioreactor Industry Revenue (Million), by Country 2024 & 2032
- Figure 60: Europe Single Use Bioreactor Industry Volume (K Units), by Country 2024 & 2032
- Figure 61: Europe Single Use Bioreactor Industry Revenue Share (%), by Country 2024 & 2032
- Figure 62: Europe Single Use Bioreactor Industry Volume Share (%), by Country 2024 & 2032
- Figure 63: Asia Pacific Single Use Bioreactor Industry Revenue (Million), by Type of Product 2024 & 2032
- Figure 64: Asia Pacific Single Use Bioreactor Industry Volume (K Units), by Type of Product 2024 & 2032
- Figure 65: Asia Pacific Single Use Bioreactor Industry Revenue Share (%), by Type of Product 2024 & 2032
- Figure 66: Asia Pacific Single Use Bioreactor Industry Volume Share (%), by Type of Product 2024 & 2032
- Figure 67: Asia Pacific Single Use Bioreactor Industry Revenue (Million), by Cell Type 2024 & 2032
- Figure 68: Asia Pacific Single Use Bioreactor Industry Volume (K Units), by Cell Type 2024 & 2032
- Figure 69: Asia Pacific Single Use Bioreactor Industry Revenue Share (%), by Cell Type 2024 & 2032
- Figure 70: Asia Pacific Single Use Bioreactor Industry Volume Share (%), by Cell Type 2024 & 2032
- Figure 71: Asia Pacific Single Use Bioreactor Industry Revenue (Million), by Molecule Type 2024 & 2032
- Figure 72: Asia Pacific Single Use Bioreactor Industry Volume (K Units), by Molecule Type 2024 & 2032
- Figure 73: Asia Pacific Single Use Bioreactor Industry Revenue Share (%), by Molecule Type 2024 & 2032
- Figure 74: Asia Pacific Single Use Bioreactor Industry Volume Share (%), by Molecule Type 2024 & 2032
- Figure 75: Asia Pacific Single Use Bioreactor Industry Revenue (Million), by End User 2024 & 2032
- Figure 76: Asia Pacific Single Use Bioreactor Industry Volume (K Units), by End User 2024 & 2032
- Figure 77: Asia Pacific Single Use Bioreactor Industry Revenue Share (%), by End User 2024 & 2032
- Figure 78: Asia Pacific Single Use Bioreactor Industry Volume Share (%), by End User 2024 & 2032
- Figure 79: Asia Pacific Single Use Bioreactor Industry Revenue (Million), by Country 2024 & 2032
- Figure 80: Asia Pacific Single Use Bioreactor Industry Volume (K Units), by Country 2024 & 2032
- Figure 81: Asia Pacific Single Use Bioreactor Industry Revenue Share (%), by Country 2024 & 2032
- Figure 82: Asia Pacific Single Use Bioreactor Industry Volume Share (%), by Country 2024 & 2032
- Figure 83: Middle East and Africa Single Use Bioreactor Industry Revenue (Million), by Type of Product 2024 & 2032
- Figure 84: Middle East and Africa Single Use Bioreactor Industry Volume (K Units), by Type of Product 2024 & 2032
- Figure 85: Middle East and Africa Single Use Bioreactor Industry Revenue Share (%), by Type of Product 2024 & 2032
- Figure 86: Middle East and Africa Single Use Bioreactor Industry Volume Share (%), by Type of Product 2024 & 2032
- Figure 87: Middle East and Africa Single Use Bioreactor Industry Revenue (Million), by Cell Type 2024 & 2032
- Figure 88: Middle East and Africa Single Use Bioreactor Industry Volume (K Units), by Cell Type 2024 & 2032
- Figure 89: Middle East and Africa Single Use Bioreactor Industry Revenue Share (%), by Cell Type 2024 & 2032
- Figure 90: Middle East and Africa Single Use Bioreactor Industry Volume Share (%), by Cell Type 2024 & 2032
- Figure 91: Middle East and Africa Single Use Bioreactor Industry Revenue (Million), by Molecule Type 2024 & 2032
- Figure 92: Middle East and Africa Single Use Bioreactor Industry Volume (K Units), by Molecule Type 2024 & 2032
- Figure 93: Middle East and Africa Single Use Bioreactor Industry Revenue Share (%), by Molecule Type 2024 & 2032
- Figure 94: Middle East and Africa Single Use Bioreactor Industry Volume Share (%), by Molecule Type 2024 & 2032
- Figure 95: Middle East and Africa Single Use Bioreactor Industry Revenue (Million), by End User 2024 & 2032
- Figure 96: Middle East and Africa Single Use Bioreactor Industry Volume (K Units), by End User 2024 & 2032
- Figure 97: Middle East and Africa Single Use Bioreactor Industry Revenue Share (%), by End User 2024 & 2032
- Figure 98: Middle East and Africa Single Use Bioreactor Industry Volume Share (%), by End User 2024 & 2032
- Figure 99: Middle East and Africa Single Use Bioreactor Industry Revenue (Million), by Country 2024 & 2032
- Figure 100: Middle East and Africa Single Use Bioreactor Industry Volume (K Units), by Country 2024 & 2032
- Figure 101: Middle East and Africa Single Use Bioreactor Industry Revenue Share (%), by Country 2024 & 2032
- Figure 102: Middle East and Africa Single Use Bioreactor Industry Volume Share (%), by Country 2024 & 2032
- Figure 103: South America Single Use Bioreactor Industry Revenue (Million), by Type of Product 2024 & 2032
- Figure 104: South America Single Use Bioreactor Industry Volume (K Units), by Type of Product 2024 & 2032
- Figure 105: South America Single Use Bioreactor Industry Revenue Share (%), by Type of Product 2024 & 2032
- Figure 106: South America Single Use Bioreactor Industry Volume Share (%), by Type of Product 2024 & 2032
- Figure 107: South America Single Use Bioreactor Industry Revenue (Million), by Cell Type 2024 & 2032
- Figure 108: South America Single Use Bioreactor Industry Volume (K Units), by Cell Type 2024 & 2032
- Figure 109: South America Single Use Bioreactor Industry Revenue Share (%), by Cell Type 2024 & 2032
- Figure 110: South America Single Use Bioreactor Industry Volume Share (%), by Cell Type 2024 & 2032
- Figure 111: South America Single Use Bioreactor Industry Revenue (Million), by Molecule Type 2024 & 2032
- Figure 112: South America Single Use Bioreactor Industry Volume (K Units), by Molecule Type 2024 & 2032
- Figure 113: South America Single Use Bioreactor Industry Revenue Share (%), by Molecule Type 2024 & 2032
- Figure 114: South America Single Use Bioreactor Industry Volume Share (%), by Molecule Type 2024 & 2032
- Figure 115: South America Single Use Bioreactor Industry Revenue (Million), by End User 2024 & 2032
- Figure 116: South America Single Use Bioreactor Industry Volume (K Units), by End User 2024 & 2032
- Figure 117: South America Single Use Bioreactor Industry Revenue Share (%), by End User 2024 & 2032
- Figure 118: South America Single Use Bioreactor Industry Volume Share (%), by End User 2024 & 2032
- Figure 119: South America Single Use Bioreactor Industry Revenue (Million), by Country 2024 & 2032
- Figure 120: South America Single Use Bioreactor Industry Volume (K Units), by Country 2024 & 2032
- Figure 121: South America Single Use Bioreactor Industry Revenue Share (%), by Country 2024 & 2032
- Figure 122: South America Single Use Bioreactor Industry Volume Share (%), by Country 2024 & 2032
List of Tables
- Table 1: Global Single Use Bioreactor Industry Revenue Million Forecast, by Region 2019 & 2032
- Table 2: Global Single Use Bioreactor Industry Volume K Units Forecast, by Region 2019 & 2032
- Table 3: Global Single Use Bioreactor Industry Revenue Million Forecast, by Type of Product 2019 & 2032
- Table 4: Global Single Use Bioreactor Industry Volume K Units Forecast, by Type of Product 2019 & 2032
- Table 5: Global Single Use Bioreactor Industry Revenue Million Forecast, by Cell Type 2019 & 2032
- Table 6: Global Single Use Bioreactor Industry Volume K Units Forecast, by Cell Type 2019 & 2032
- Table 7: Global Single Use Bioreactor Industry Revenue Million Forecast, by Molecule Type 2019 & 2032
- Table 8: Global Single Use Bioreactor Industry Volume K Units Forecast, by Molecule Type 2019 & 2032
- Table 9: Global Single Use Bioreactor Industry Revenue Million Forecast, by End User 2019 & 2032
- Table 10: Global Single Use Bioreactor Industry Volume K Units Forecast, by End User 2019 & 2032
- Table 11: Global Single Use Bioreactor Industry Revenue Million Forecast, by Region 2019 & 2032
- Table 12: Global Single Use Bioreactor Industry Volume K Units Forecast, by Region 2019 & 2032
- Table 13: Global Single Use Bioreactor Industry Revenue Million Forecast, by Country 2019 & 2032
- Table 14: Global Single Use Bioreactor Industry Volume K Units Forecast, by Country 2019 & 2032
- Table 15: United States Single Use Bioreactor Industry Revenue (Million) Forecast, by Application 2019 & 2032
- Table 16: United States Single Use Bioreactor Industry Volume (K Units) Forecast, by Application 2019 & 2032
- Table 17: Canada Single Use Bioreactor Industry Revenue (Million) Forecast, by Application 2019 & 2032
- Table 18: Canada Single Use Bioreactor Industry Volume (K Units) Forecast, by Application 2019 & 2032
- Table 19: Mexico Single Use Bioreactor Industry Revenue (Million) Forecast, by Application 2019 & 2032
- Table 20: Mexico Single Use Bioreactor Industry Volume (K Units) Forecast, by Application 2019 & 2032
- Table 21: Global Single Use Bioreactor Industry Revenue Million Forecast, by Country 2019 & 2032
- Table 22: Global Single Use Bioreactor Industry Volume K Units Forecast, by Country 2019 & 2032
- Table 23: Brazil Single Use Bioreactor Industry Revenue (Million) Forecast, by Application 2019 & 2032
- Table 24: Brazil Single Use Bioreactor Industry Volume (K Units) Forecast, by Application 2019 & 2032
- Table 25: Mexico Single Use Bioreactor Industry Revenue (Million) Forecast, by Application 2019 & 2032
- Table 26: Mexico Single Use Bioreactor Industry Volume (K Units) Forecast, by Application 2019 & 2032
- Table 27: Rest of South America Single Use Bioreactor Industry Revenue (Million) Forecast, by Application 2019 & 2032
- Table 28: Rest of South America Single Use Bioreactor Industry Volume (K Units) Forecast, by Application 2019 & 2032
- Table 29: Global Single Use Bioreactor Industry Revenue Million Forecast, by Country 2019 & 2032
- Table 30: Global Single Use Bioreactor Industry Volume K Units Forecast, by Country 2019 & 2032
- Table 31: Germany Single Use Bioreactor Industry Revenue (Million) Forecast, by Application 2019 & 2032
- Table 32: Germany Single Use Bioreactor Industry Volume (K Units) Forecast, by Application 2019 & 2032
- Table 33: United Kingdom Single Use Bioreactor Industry Revenue (Million) Forecast, by Application 2019 & 2032
- Table 34: United Kingdom Single Use Bioreactor Industry Volume (K Units) Forecast, by Application 2019 & 2032
- Table 35: France Single Use Bioreactor Industry Revenue (Million) Forecast, by Application 2019 & 2032
- Table 36: France Single Use Bioreactor Industry Volume (K Units) Forecast, by Application 2019 & 2032
- Table 37: Italy Single Use Bioreactor Industry Revenue (Million) Forecast, by Application 2019 & 2032
- Table 38: Italy Single Use Bioreactor Industry Volume (K Units) Forecast, by Application 2019 & 2032
- Table 39: Spain Single Use Bioreactor Industry Revenue (Million) Forecast, by Application 2019 & 2032
- Table 40: Spain Single Use Bioreactor Industry Volume (K Units) Forecast, by Application 2019 & 2032
- Table 41: Rest of Europe Single Use Bioreactor Industry Revenue (Million) Forecast, by Application 2019 & 2032
- Table 42: Rest of Europe Single Use Bioreactor Industry Volume (K Units) Forecast, by Application 2019 & 2032
- Table 43: Global Single Use Bioreactor Industry Revenue Million Forecast, by Country 2019 & 2032
- Table 44: Global Single Use Bioreactor Industry Volume K Units Forecast, by Country 2019 & 2032
- Table 45: Middle East Single Use Bioreactor Industry Revenue (Million) Forecast, by Application 2019 & 2032
- Table 46: Middle East Single Use Bioreactor Industry Volume (K Units) Forecast, by Application 2019 & 2032
- Table 47: Africa Single Use Bioreactor Industry Revenue (Million) Forecast, by Application 2019 & 2032
- Table 48: Africa Single Use Bioreactor Industry Volume (K Units) Forecast, by Application 2019 & 2032
- Table 49: Global Single Use Bioreactor Industry Revenue Million Forecast, by Country 2019 & 2032
- Table 50: Global Single Use Bioreactor Industry Volume K Units Forecast, by Country 2019 & 2032
- Table 51: China Single Use Bioreactor Industry Revenue (Million) Forecast, by Application 2019 & 2032
- Table 52: China Single Use Bioreactor Industry Volume (K Units) Forecast, by Application 2019 & 2032
- Table 53: Japan Single Use Bioreactor Industry Revenue (Million) Forecast, by Application 2019 & 2032
- Table 54: Japan Single Use Bioreactor Industry Volume (K Units) Forecast, by Application 2019 & 2032
- Table 55: India Single Use Bioreactor Industry Revenue (Million) Forecast, by Application 2019 & 2032
- Table 56: India Single Use Bioreactor Industry Volume (K Units) Forecast, by Application 2019 & 2032
- Table 57: South Korea Single Use Bioreactor Industry Revenue (Million) Forecast, by Application 2019 & 2032
- Table 58: South Korea Single Use Bioreactor Industry Volume (K Units) Forecast, by Application 2019 & 2032
- Table 59: Taiwan Single Use Bioreactor Industry Revenue (Million) Forecast, by Application 2019 & 2032
- Table 60: Taiwan Single Use Bioreactor Industry Volume (K Units) Forecast, by Application 2019 & 2032
- Table 61: Australia Single Use Bioreactor Industry Revenue (Million) Forecast, by Application 2019 & 2032
- Table 62: Australia Single Use Bioreactor Industry Volume (K Units) Forecast, by Application 2019 & 2032
- Table 63: Rest of Asia-Pacific Single Use Bioreactor Industry Revenue (Million) Forecast, by Application 2019 & 2032
- Table 64: Rest of Asia-Pacific Single Use Bioreactor Industry Volume (K Units) Forecast, by Application 2019 & 2032
- Table 65: Global Single Use Bioreactor Industry Revenue Million Forecast, by Type of Product 2019 & 2032
- Table 66: Global Single Use Bioreactor Industry Volume K Units Forecast, by Type of Product 2019 & 2032
- Table 67: Global Single Use Bioreactor Industry Revenue Million Forecast, by Cell Type 2019 & 2032
- Table 68: Global Single Use Bioreactor Industry Volume K Units Forecast, by Cell Type 2019 & 2032
- Table 69: Global Single Use Bioreactor Industry Revenue Million Forecast, by Molecule Type 2019 & 2032
- Table 70: Global Single Use Bioreactor Industry Volume K Units Forecast, by Molecule Type 2019 & 2032
- Table 71: Global Single Use Bioreactor Industry Revenue Million Forecast, by End User 2019 & 2032
- Table 72: Global Single Use Bioreactor Industry Volume K Units Forecast, by End User 2019 & 2032
- Table 73: Global Single Use Bioreactor Industry Revenue Million Forecast, by Country 2019 & 2032
- Table 74: Global Single Use Bioreactor Industry Volume K Units Forecast, by Country 2019 & 2032
- Table 75: United States Single Use Bioreactor Industry Revenue (Million) Forecast, by Application 2019 & 2032
- Table 76: United States Single Use Bioreactor Industry Volume (K Units) Forecast, by Application 2019 & 2032
- Table 77: Canada Single Use Bioreactor Industry Revenue (Million) Forecast, by Application 2019 & 2032
- Table 78: Canada Single Use Bioreactor Industry Volume (K Units) Forecast, by Application 2019 & 2032
- Table 79: Mexico Single Use Bioreactor Industry Revenue (Million) Forecast, by Application 2019 & 2032
- Table 80: Mexico Single Use Bioreactor Industry Volume (K Units) Forecast, by Application 2019 & 2032
- Table 81: Global Single Use Bioreactor Industry Revenue Million Forecast, by Type of Product 2019 & 2032
- Table 82: Global Single Use Bioreactor Industry Volume K Units Forecast, by Type of Product 2019 & 2032
- Table 83: Global Single Use Bioreactor Industry Revenue Million Forecast, by Cell Type 2019 & 2032
- Table 84: Global Single Use Bioreactor Industry Volume K Units Forecast, by Cell Type 2019 & 2032
- Table 85: Global Single Use Bioreactor Industry Revenue Million Forecast, by Molecule Type 2019 & 2032
- Table 86: Global Single Use Bioreactor Industry Volume K Units Forecast, by Molecule Type 2019 & 2032
- Table 87: Global Single Use Bioreactor Industry Revenue Million Forecast, by End User 2019 & 2032
- Table 88: Global Single Use Bioreactor Industry Volume K Units Forecast, by End User 2019 & 2032
- Table 89: Global Single Use Bioreactor Industry Revenue Million Forecast, by Country 2019 & 2032
- Table 90: Global Single Use Bioreactor Industry Volume K Units Forecast, by Country 2019 & 2032
- Table 91: Germany Single Use Bioreactor Industry Revenue (Million) Forecast, by Application 2019 & 2032
- Table 92: Germany Single Use Bioreactor Industry Volume (K Units) Forecast, by Application 2019 & 2032
- Table 93: United Kingdom Single Use Bioreactor Industry Revenue (Million) Forecast, by Application 2019 & 2032
- Table 94: United Kingdom Single Use Bioreactor Industry Volume (K Units) Forecast, by Application 2019 & 2032
- Table 95: France Single Use Bioreactor Industry Revenue (Million) Forecast, by Application 2019 & 2032
- Table 96: France Single Use Bioreactor Industry Volume (K Units) Forecast, by Application 2019 & 2032
- Table 97: Italy Single Use Bioreactor Industry Revenue (Million) Forecast, by Application 2019 & 2032
- Table 98: Italy Single Use Bioreactor Industry Volume (K Units) Forecast, by Application 2019 & 2032
- Table 99: Spain Single Use Bioreactor Industry Revenue (Million) Forecast, by Application 2019 & 2032
- Table 100: Spain Single Use Bioreactor Industry Volume (K Units) Forecast, by Application 2019 & 2032
- Table 101: Rest of Europe Single Use Bioreactor Industry Revenue (Million) Forecast, by Application 2019 & 2032
- Table 102: Rest of Europe Single Use Bioreactor Industry Volume (K Units) Forecast, by Application 2019 & 2032
- Table 103: Global Single Use Bioreactor Industry Revenue Million Forecast, by Type of Product 2019 & 2032
- Table 104: Global Single Use Bioreactor Industry Volume K Units Forecast, by Type of Product 2019 & 2032
- Table 105: Global Single Use Bioreactor Industry Revenue Million Forecast, by Cell Type 2019 & 2032
- Table 106: Global Single Use Bioreactor Industry Volume K Units Forecast, by Cell Type 2019 & 2032
- Table 107: Global Single Use Bioreactor Industry Revenue Million Forecast, by Molecule Type 2019 & 2032
- Table 108: Global Single Use Bioreactor Industry Volume K Units Forecast, by Molecule Type 2019 & 2032
- Table 109: Global Single Use Bioreactor Industry Revenue Million Forecast, by End User 2019 & 2032
- Table 110: Global Single Use Bioreactor Industry Volume K Units Forecast, by End User 2019 & 2032
- Table 111: Global Single Use Bioreactor Industry Revenue Million Forecast, by Country 2019 & 2032
- Table 112: Global Single Use Bioreactor Industry Volume K Units Forecast, by Country 2019 & 2032
- Table 113: China Single Use Bioreactor Industry Revenue (Million) Forecast, by Application 2019 & 2032
- Table 114: China Single Use Bioreactor Industry Volume (K Units) Forecast, by Application 2019 & 2032
- Table 115: Japan Single Use Bioreactor Industry Revenue (Million) Forecast, by Application 2019 & 2032
- Table 116: Japan Single Use Bioreactor Industry Volume (K Units) Forecast, by Application 2019 & 2032
- Table 117: India Single Use Bioreactor Industry Revenue (Million) Forecast, by Application 2019 & 2032
- Table 118: India Single Use Bioreactor Industry Volume (K Units) Forecast, by Application 2019 & 2032
- Table 119: Australia Single Use Bioreactor Industry Revenue (Million) Forecast, by Application 2019 & 2032
- Table 120: Australia Single Use Bioreactor Industry Volume (K Units) Forecast, by Application 2019 & 2032
- Table 121: South Korea Single Use Bioreactor Industry Revenue (Million) Forecast, by Application 2019 & 2032
- Table 122: South Korea Single Use Bioreactor Industry Volume (K Units) Forecast, by Application 2019 & 2032
- Table 123: Rest of Asia Pacific Single Use Bioreactor Industry Revenue (Million) Forecast, by Application 2019 & 2032
- Table 124: Rest of Asia Pacific Single Use Bioreactor Industry Volume (K Units) Forecast, by Application 2019 & 2032
- Table 125: Global Single Use Bioreactor Industry Revenue Million Forecast, by Type of Product 2019 & 2032
- Table 126: Global Single Use Bioreactor Industry Volume K Units Forecast, by Type of Product 2019 & 2032
- Table 127: Global Single Use Bioreactor Industry Revenue Million Forecast, by Cell Type 2019 & 2032
- Table 128: Global Single Use Bioreactor Industry Volume K Units Forecast, by Cell Type 2019 & 2032
- Table 129: Global Single Use Bioreactor Industry Revenue Million Forecast, by Molecule Type 2019 & 2032
- Table 130: Global Single Use Bioreactor Industry Volume K Units Forecast, by Molecule Type 2019 & 2032
- Table 131: Global Single Use Bioreactor Industry Revenue Million Forecast, by End User 2019 & 2032
- Table 132: Global Single Use Bioreactor Industry Volume K Units Forecast, by End User 2019 & 2032
- Table 133: Global Single Use Bioreactor Industry Revenue Million Forecast, by Country 2019 & 2032
- Table 134: Global Single Use Bioreactor Industry Volume K Units Forecast, by Country 2019 & 2032
- Table 135: GCC Single Use Bioreactor Industry Revenue (Million) Forecast, by Application 2019 & 2032
- Table 136: GCC Single Use Bioreactor Industry Volume (K Units) Forecast, by Application 2019 & 2032
- Table 137: South Africa Single Use Bioreactor Industry Revenue (Million) Forecast, by Application 2019 & 2032
- Table 138: South Africa Single Use Bioreactor Industry Volume (K Units) Forecast, by Application 2019 & 2032
- Table 139: Rest of Middle East and Africa Single Use Bioreactor Industry Revenue (Million) Forecast, by Application 2019 & 2032
- Table 140: Rest of Middle East and Africa Single Use Bioreactor Industry Volume (K Units) Forecast, by Application 2019 & 2032
- Table 141: Global Single Use Bioreactor Industry Revenue Million Forecast, by Type of Product 2019 & 2032
- Table 142: Global Single Use Bioreactor Industry Volume K Units Forecast, by Type of Product 2019 & 2032
- Table 143: Global Single Use Bioreactor Industry Revenue Million Forecast, by Cell Type 2019 & 2032
- Table 144: Global Single Use Bioreactor Industry Volume K Units Forecast, by Cell Type 2019 & 2032
- Table 145: Global Single Use Bioreactor Industry Revenue Million Forecast, by Molecule Type 2019 & 2032
- Table 146: Global Single Use Bioreactor Industry Volume K Units Forecast, by Molecule Type 2019 & 2032
- Table 147: Global Single Use Bioreactor Industry Revenue Million Forecast, by End User 2019 & 2032
- Table 148: Global Single Use Bioreactor Industry Volume K Units Forecast, by End User 2019 & 2032
- Table 149: Global Single Use Bioreactor Industry Revenue Million Forecast, by Country 2019 & 2032
- Table 150: Global Single Use Bioreactor Industry Volume K Units Forecast, by Country 2019 & 2032
- Table 151: Brazil Single Use Bioreactor Industry Revenue (Million) Forecast, by Application 2019 & 2032
- Table 152: Brazil Single Use Bioreactor Industry Volume (K Units) Forecast, by Application 2019 & 2032
- Table 153: Argentina Single Use Bioreactor Industry Revenue (Million) Forecast, by Application 2019 & 2032
- Table 154: Argentina Single Use Bioreactor Industry Volume (K Units) Forecast, by Application 2019 & 2032
- Table 155: Rest of South America Single Use Bioreactor Industry Revenue (Million) Forecast, by Application 2019 & 2032
- Table 156: Rest of South America Single Use Bioreactor Industry Volume (K Units) Forecast, by Application 2019 & 2032
Frequently Asked Questions
1. What is the projected Compound Annual Growth Rate (CAGR) of the Single Use Bioreactor Industry?
The projected CAGR is approximately 9.70%.
2. Which companies are prominent players in the Single Use Bioreactor Industry?
Key companies in the market include Danaher (Cytiva), Merck KGaA, Distek Inc, Celltainer, Pall Corporation, Eppendorf SE, Sartorius AG, Thermo Fisher Scientific, OmniBRx Biotechnologies, ABEC.
3. What are the main segments of the Single Use Bioreactor Industry?
The market segments include Type of Product, Cell Type, Molecule Type, End User.
4. Can you provide details about the market size?
The market size is estimated to be USD 1.47 Million as of 2022.
5. What are some drivers contributing to market growth?
Rapid Adoption of Single-use Technologies (SUTs) by the Industry; Cost Effectiveness and Lower Downtime; New Product Launches.
6. What are the notable trends driving market growth?
Monoclonal Antibodies Segment is Anticipated to Witness Growth.
7. Are there any restraints impacting market growth?
High Regular Recurring Expenses; Issues with Meeting the Standards of Good Manufacturing Practices.
8. Can you provide examples of recent developments in the market?
In June 2022, mAbxience equipped their cGMP (Current Good Manufacturing Practice) facility in León, Spain with an additional ABEC 4,000L CSR bioreactor, following the successful delivery of the first 4,000L CSR bioreactor in 2021. mAbxience selected ABEC's single-use technology to increase its CDMO (contract development and manufacturing organization) business and capacity.
9. What pricing options are available for accessing the report?
Pricing options include single-user, multi-user, and enterprise licenses priced at USD 4750, USD 5250, and USD 8750 respectively.
10. Is the market size provided in terms of value or volume?
The market size is provided in terms of value, measured in Million and volume, measured in K Units.
11. Are there any specific market keywords associated with the report?
Yes, the market keyword associated with the report is "Single Use Bioreactor Industry," which aids in identifying and referencing the specific market segment covered.
12. How do I determine which pricing option suits my needs best?
The pricing options vary based on user requirements and access needs. Individual users may opt for single-user licenses, while businesses requiring broader access may choose multi-user or enterprise licenses for cost-effective access to the report.
13. Are there any additional resources or data provided in the Single Use Bioreactor Industry report?
While the report offers comprehensive insights, it's advisable to review the specific contents or supplementary materials provided to ascertain if additional resources or data are available.
14. How can I stay updated on further developments or reports in the Single Use Bioreactor Industry?
To stay informed about further developments, trends, and reports in the Single Use Bioreactor Industry, consider subscribing to industry newsletters, following relevant companies and organizations, or regularly checking reputable industry news sources and publications.
Methodology
Step 1 - Identification of Relevant Samples Size from Population Database


Step 2 - Approaches for Defining Global Market Size (Value, Volume* & Price*)

Note*: In applicable scenarios
Step 3 - Data Sources
Primary Research
- Web Analytics
- Survey Reports
- Research Institute
- Latest Research Reports
- Opinion Leaders
Secondary Research
- Annual Reports
- White Paper
- Latest Press Release
- Industry Association
- Paid Database
- Investor Presentations

Step 4 - Data Triangulation
Involves using different sources of information in order to increase the validity of a study
These sources are likely to be stakeholders in a program - participants, other researchers, program staff, other community members, and so on.
Then we put all data in single framework & apply various statistical tools to find out the dynamic on the market.
During the analysis stage, feedback from the stakeholder groups would be compared to determine areas of agreement as well as areas of divergence
