

Key Insights
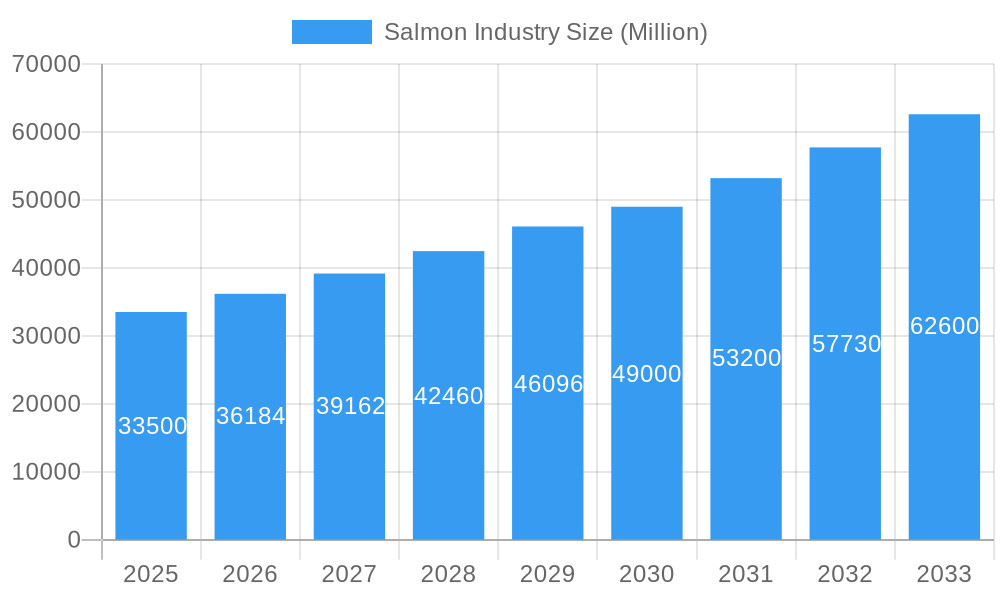
The global salmon industry, valued at $33.5 billion in 2025, is projected to experience robust growth, driven by increasing consumer demand for healthy protein sources and the expanding aquaculture sector. The compound annual growth rate (CAGR) of 8.07% from 2025 to 2033 indicates a significant market expansion, reaching an estimated value exceeding $65 billion by 2033. This growth is fueled by several factors, including rising disposable incomes in developing economies, increasing health consciousness leading to higher seafood consumption, and advancements in aquaculture techniques that improve salmon production efficiency and sustainability. The market is segmented by farming type (farmed vs. wild-caught) and species (Atlantic salmon, Coho salmon, Masu salmon, Chinook salmon, and others), with farmed Atlantic salmon currently dominating the market share. Major players like Leroy Seafood Group, Cooke Aquaculture, Cermaq, Mowi, and Grieg Seafood are key contributors to the industry's growth, constantly innovating in farming practices and expanding their global reach. Geographical distribution shows significant regional variations, with North America and Europe holding substantial market share. However, the Asia-Pacific region is expected to witness the fastest growth, driven by increasing consumption in countries like China and Japan.
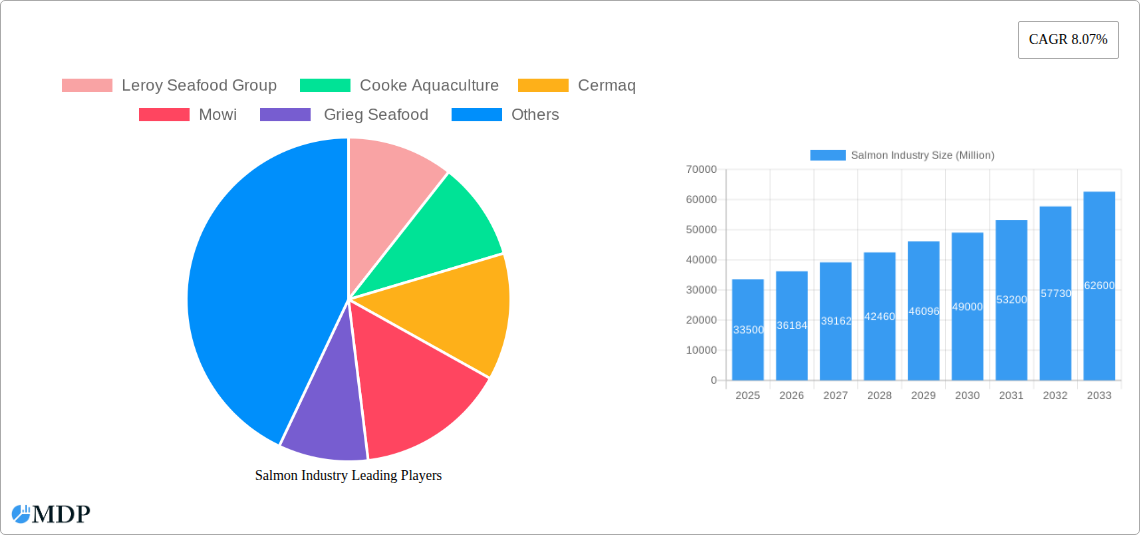
Salmon Industry Market Size (In Billion)
Despite the positive outlook, the industry faces certain challenges. Environmental concerns regarding aquaculture's impact on marine ecosystems and the potential for disease outbreaks are important considerations. Fluctuations in feed prices and stringent regulations on sustainable fishing practices also pose restraints. Addressing these challenges through sustainable aquaculture practices, stricter quality control measures, and transparent supply chains will be crucial for long-term industry success. The increasing focus on traceability and sustainability will be a key driver of future market segmentation, with consumers increasingly demanding sustainably sourced and ethically produced salmon. This presents opportunities for companies that prioritize environmentally friendly and responsible farming techniques. Furthermore, product innovation, such as value-added processed salmon products, will create new revenue streams and enhance market penetration.
Salmon Industry Company Market Share
Unlock the Untapped Potential: A Comprehensive Analysis of the Salmon Industry (2019-2033)
This in-depth report provides a comprehensive analysis of the global salmon industry, offering invaluable insights for stakeholders seeking to navigate this dynamic market. With a focus on market dynamics, leading players, and future trends, this report is essential for strategic decision-making. Covering the period from 2019 to 2033, with a base year of 2025, it delivers actionable intelligence on market size, segmentation, and growth projections. The report examines key players like Leroy Seafood Group, Cooke Aquaculture, Cermaq, Mowi, and Grieg Seafood, analyzing their market positions and strategic moves. Expect detailed forecasts, uncovering lucrative opportunities and potential challenges within the farmed and wild-captured salmon segments, encompassing Atlantic Salmon, Coho Salmon, Masu Salmon, Chinook Salmon, and other species.
Salmon Industry Market Dynamics & Concentration
The global salmon market, valued at $xx Million in 2025, is characterized by moderate concentration, with several major players holding significant market share. Leroy Seafood Group, Mowi, and Cooke Aquaculture are among the leading companies, collectively accounting for an estimated xx% of the market share in 2025. Market concentration is influenced by factors such as economies of scale, access to resources, and technological advancements. Regulatory frameworks, particularly those related to aquaculture sustainability and wild-caught quotas, significantly impact market dynamics. Product substitutes, such as other protein sources (e.g., poultry, plant-based alternatives), exert competitive pressure, while growing consumer demand for healthier and sustainably sourced seafood drives innovation and market growth. M&A activity in the industry has been moderate during the historical period (2019-2024), with an estimated xx M&A deals. This activity is likely to increase, particularly within the farmed salmon segment, as companies strive for expansion and consolidation.
- Market Share (2025): Leroy Seafood Group (xx%), Mowi (xx%), Cooke Aquaculture (xx%), Cermaq (xx%), Grieg Seafood (xx%), Others (xx%)
- M&A Deal Count (2019-2024): xx
- Key Innovation Drivers: Sustainability initiatives, technological advancements in aquaculture, diversification of product offerings.
- Regulatory Framework: Stringent regulations regarding aquaculture practices, wild-caught fishing quotas, and food safety.
Salmon Industry Industry Trends & Analysis
The global salmon market is experiencing robust growth, driven by increasing consumer demand for high-quality protein, health-conscious eating habits, and the rising popularity of salmon as a versatile and nutritious food source. The compound annual growth rate (CAGR) during the forecast period (2025-2033) is projected to be xx%, reaching a market value of $xx Million by 2033. Technological advancements in aquaculture, such as recirculating aquaculture systems (RAS) and automated feeding systems, are enhancing efficiency and sustainability. Consumer preferences are shifting towards sustainably sourced salmon, leading to a growing demand for certified products and transparent supply chains. Competitive dynamics are characterized by intense rivalry among major players, leading to pricing pressures and a focus on product differentiation. Market penetration of farmed salmon is high in many regions, while the wild-caught segment faces stricter regulations and supply constraints.
Leading Markets & Segments in Salmon Industry
The leading market for salmon is currently [Dominant Region, e.g., Europe], followed by [Second Leading Region, e.g., North America]. Within these regions, [Dominant Country, e.g., Norway] stands out as a major producer and exporter of farmed salmon. The farmed salmon segment dominates the overall market, accounting for approximately xx% of total volume in 2025. Atlantic salmon accounts for the largest share of the species segment, driven by its popularity and established market presence.
- Key Drivers for Farmed Salmon Dominance:
- Economies of scale and efficient production methods.
- Technological advancements leading to improved yields and reduced costs.
- Government support and investment in aquaculture infrastructure.
- Key Drivers for Geographic Dominance (e.g., Norway):
- Favorable environmental conditions for salmon farming.
- Established aquaculture industry with experienced workforce.
- Government policies supporting sustainable aquaculture practices.
- Wild-Caught Salmon: Significant in [Specific Regions], regulated to ensure sustainability.
Salmon Industry Product Developments
Recent product innovations focus on value-added products such as pre-packaged meals, smoked salmon, and ready-to-eat options. Technological advancements are leading to improved processing techniques, resulting in higher-quality products with extended shelf life. Companies are increasingly emphasizing sustainable sourcing and traceability, appealing to environmentally conscious consumers. These developments are enhancing market competitiveness and widening the appeal of salmon across diverse consumer demographics.
Key Drivers of Salmon Industry Growth
Technological advancements in aquaculture are significantly boosting production efficiency and sustainability. Growing global demand for healthy and protein-rich food sources fuels market expansion. Supportive government policies and investments in aquaculture infrastructure are creating a favorable business environment.
Challenges in the Salmon Industry Market
Regulatory hurdles related to aquaculture practices and environmental concerns pose significant challenges. Fluctuations in raw material prices and supply chain disruptions can impact profitability. Intense competition among major players results in pricing pressure and limits profit margins. Disease outbreaks and sea lice infestations can severely affect production and lead to significant economic losses. Sustainability concerns surrounding wild-caught salmon fishing remain a key challenge.
Emerging Opportunities in Salmon Industry
Advancements in RAS technology offer opportunities for sustainable and efficient salmon farming. Strategic partnerships and collaborations within the industry can promote innovation and market expansion. Expansion into new markets and consumer segments, such as emerging economies, presents substantial growth potential.
Leading Players in the Salmon Industry Sector
Key Milestones in Salmon Industry Industry
- 2020: Introduction of a new RAS technology by [Company Name], increasing production efficiency by xx%.
- 2022: Merger between [Company A] and [Company B], leading to increased market share and geographic expansion.
- 2023: Launch of a new sustainable salmon certification program, improving consumer trust and market access.
Strategic Outlook for Salmon Industry Market
The salmon industry is poised for continued growth, driven by technological innovation, expanding consumer demand, and increasing focus on sustainability. Strategic opportunities exist in developing value-added products, expanding into new markets, and forming strategic partnerships. Companies that invest in sustainable practices and adopt innovative technologies are expected to capture a larger share of the market in the long term.
Salmon Industry Segmentation
-
1. Species Type
- 1.1. Atlantic Salmon
- 1.2. Coho Salmon
- 1.3. Masu Salmon
- 1.4. Chinook Salmon
- 1.5. Other Species Types
-
2. Type
- 2.1. Farmed
- 2.2. Wild Captured
-
3. Species Type
- 3.1. Atlantic Salmon
- 3.2. Coho Salmon
- 3.3. Masu Salmon
- 3.4. Chinook Salmon
- 3.5. Other Species Types
-
4. Type
- 4.1. Farmed
- 4.2. Wild Captured
Salmon Industry Segmentation By Geography
-
1. North America
- 1.1. United States
- 1.2. Canada
-
2. Europe
- 2.1. Norway
- 2.2. Spain
- 2.3. Netherlands
- 2.4. France
- 2.5. Italy
- 2.6. Greece
- 2.7. United Kingdom
- 2.8. Scotland
-
3. Asia Pacific
- 3.1. China
- 3.2. Japan
- 3.3. Australia
-
4. South America
- 4.1. Chile
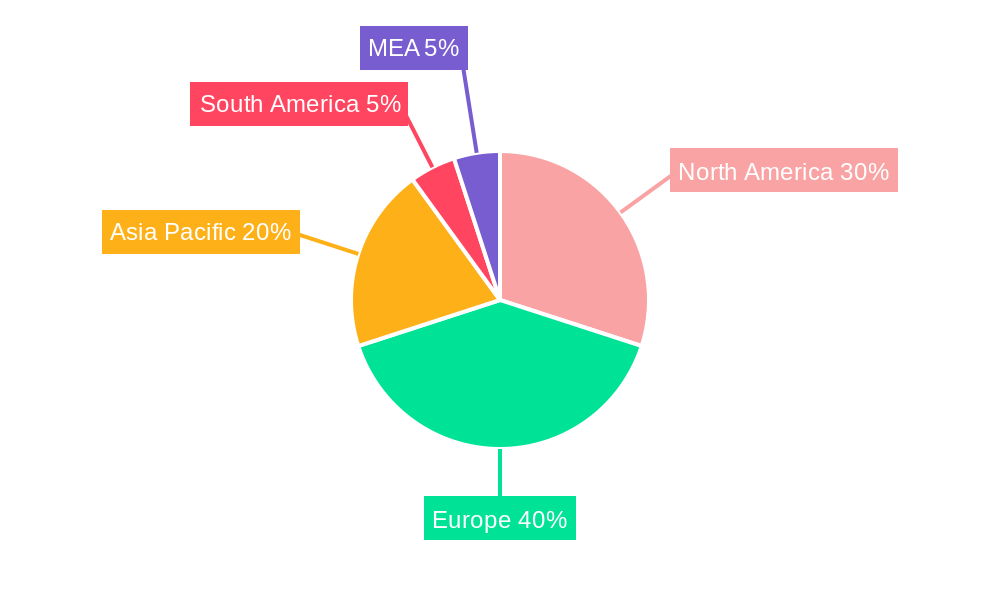
Salmon Industry Regional Market Share
Geographic Coverage of Salmon Industry
Salmon Industry REPORT HIGHLIGHTS
| Aspects | Details |
|---|---|
| Study Period | 2020-2034 |
| Base Year | 2025 |
| Estimated Year | 2026 |
| Forecast Period | 2026-2034 |
| Historical Period | 2020-2025 |
| Growth Rate | CAGR of 8.07% from 2020-2034 |
| Segmentation |
|
Table of Contents
- 1. Introduction
- 1.1. Research Scope
- 1.2. Market Segmentation
- 1.3. Research Objective
- 1.4. Definitions and Assumptions
- 2. Executive Summary
- 2.1. Market Snapshot
- 3. Market Dynamics
- 3.1. Market Drivers
- 3.2. Market Restrains
- 3.3. Market Trends
- 3.4. Market Opportunities
- 4. Market Factor Analysis
- 4.1. Porters Five Forces
- 4.1.1. Bargaining Power of Suppliers
- 4.1.2. Bargaining Power of Buyers
- 4.1.3. Threat of New Entrants
- 4.1.4. Threat of Substitutes
- 4.1.5. Competitive Rivalry
- 4.2. PESTEL analysis
- 4.3. BCG Analysis
- 4.3.1. Stars (High Growth, High Market Share)
- 4.3.2. Cash Cows (Low Growth, High Market Share)
- 4.3.3. Question Mark (High Growth, Low Market Share)
- 4.3.4. Dogs (Low Growth, Low Market Share)
- 4.4. Ansoff Matrix Analysis
- 4.5. Supply Chain Analysis
- 4.6. Regulatory Landscape
- 4.7. Current Market Potential and Opportunity Assessment (TAM–SAM–SOM Framework)
- 4.8. MDP Analyst Note
- 4.1. Porters Five Forces
- 5. Market Analysis, Insights and Forecast 2021-2033
- 5.1. Market Analysis, Insights and Forecast - by Species Type
- 5.1.1. Atlantic Salmon
- 5.1.2. Coho Salmon
- 5.1.3. Masu Salmon
- 5.1.4. Chinook Salmon
- 5.1.5. Other Species Types
- 5.2. Market Analysis, Insights and Forecast - by Type
- 5.2.1. Farmed
- 5.2.2. Wild Captured
- 5.3. Market Analysis, Insights and Forecast - by Species Type
- 5.3.1. Atlantic Salmon
- 5.3.2. Coho Salmon
- 5.3.3. Masu Salmon
- 5.3.4. Chinook Salmon
- 5.3.5. Other Species Types
- 5.4. Market Analysis, Insights and Forecast - by Type
- 5.4.1. Farmed
- 5.4.2. Wild Captured
- 5.5. Market Analysis, Insights and Forecast - by Region
- 5.5.1. North America
- 5.5.2. Europe
- 5.5.3. Asia Pacific
- 5.5.4. South America
- 5.1. Market Analysis, Insights and Forecast - by Species Type
- 6. Global Salmon Industry Analysis, Insights and Forecast, 2021-2033
- 6.1. Market Analysis, Insights and Forecast - by Species Type
- 6.1.1. Atlantic Salmon
- 6.1.2. Coho Salmon
- 6.1.3. Masu Salmon
- 6.1.4. Chinook Salmon
- 6.1.5. Other Species Types
- 6.2. Market Analysis, Insights and Forecast - by Type
- 6.2.1. Farmed
- 6.2.2. Wild Captured
- 6.3. Market Analysis, Insights and Forecast - by Species Type
- 6.3.1. Atlantic Salmon
- 6.3.2. Coho Salmon
- 6.3.3. Masu Salmon
- 6.3.4. Chinook Salmon
- 6.3.5. Other Species Types
- 6.4. Market Analysis, Insights and Forecast - by Type
- 6.4.1. Farmed
- 6.4.2. Wild Captured
- 6.1. Market Analysis, Insights and Forecast - by Species Type
- 7. North America Salmon Industry Analysis, Insights and Forecast, 2020-2032
- 7.1. Market Analysis, Insights and Forecast - by Species Type
- 7.1.1. Atlantic Salmon
- 7.1.2. Coho Salmon
- 7.1.3. Masu Salmon
- 7.1.4. Chinook Salmon
- 7.1.5. Other Species Types
- 7.2. Market Analysis, Insights and Forecast - by Type
- 7.2.1. Farmed
- 7.2.2. Wild Captured
- 7.3. Market Analysis, Insights and Forecast - by Species Type
- 7.3.1. Atlantic Salmon
- 7.3.2. Coho Salmon
- 7.3.3. Masu Salmon
- 7.3.4. Chinook Salmon
- 7.3.5. Other Species Types
- 7.4. Market Analysis, Insights and Forecast - by Type
- 7.4.1. Farmed
- 7.4.2. Wild Captured
- 7.1. Market Analysis, Insights and Forecast - by Species Type
- 8. Europe Salmon Industry Analysis, Insights and Forecast, 2020-2032
- 8.1. Market Analysis, Insights and Forecast - by Species Type
- 8.1.1. Atlantic Salmon
- 8.1.2. Coho Salmon
- 8.1.3. Masu Salmon
- 8.1.4. Chinook Salmon
- 8.1.5. Other Species Types
- 8.2. Market Analysis, Insights and Forecast - by Type
- 8.2.1. Farmed
- 8.2.2. Wild Captured
- 8.3. Market Analysis, Insights and Forecast - by Species Type
- 8.3.1. Atlantic Salmon
- 8.3.2. Coho Salmon
- 8.3.3. Masu Salmon
- 8.3.4. Chinook Salmon
- 8.3.5. Other Species Types
- 8.4. Market Analysis, Insights and Forecast - by Type
- 8.4.1. Farmed
- 8.4.2. Wild Captured
- 8.1. Market Analysis, Insights and Forecast - by Species Type
- 9. Asia Pacific Salmon Industry Analysis, Insights and Forecast, 2020-2032
- 9.1. Market Analysis, Insights and Forecast - by Species Type
- 9.1.1. Atlantic Salmon
- 9.1.2. Coho Salmon
- 9.1.3. Masu Salmon
- 9.1.4. Chinook Salmon
- 9.1.5. Other Species Types
- 9.2. Market Analysis, Insights and Forecast - by Type
- 9.2.1. Farmed
- 9.2.2. Wild Captured
- 9.3. Market Analysis, Insights and Forecast - by Species Type
- 9.3.1. Atlantic Salmon
- 9.3.2. Coho Salmon
- 9.3.3. Masu Salmon
- 9.3.4. Chinook Salmon
- 9.3.5. Other Species Types
- 9.4. Market Analysis, Insights and Forecast - by Type
- 9.4.1. Farmed
- 9.4.2. Wild Captured
- 9.1. Market Analysis, Insights and Forecast - by Species Type
- 10. South America Salmon Industry Analysis, Insights and Forecast, 2020-2032
- 10.1. Market Analysis, Insights and Forecast - by Species Type
- 10.1.1. Atlantic Salmon
- 10.1.2. Coho Salmon
- 10.1.3. Masu Salmon
- 10.1.4. Chinook Salmon
- 10.1.5. Other Species Types
- 10.2. Market Analysis, Insights and Forecast - by Type
- 10.2.1. Farmed
- 10.2.2. Wild Captured
- 10.3. Market Analysis, Insights and Forecast - by Species Type
- 10.3.1. Atlantic Salmon
- 10.3.2. Coho Salmon
- 10.3.3. Masu Salmon
- 10.3.4. Chinook Salmon
- 10.3.5. Other Species Types
- 10.4. Market Analysis, Insights and Forecast - by Type
- 10.4.1. Farmed
- 10.4.2. Wild Captured
- 10.1. Market Analysis, Insights and Forecast - by Species Type
- 11. Competitive Analysis
- 11.1. Company Profiles
- 11.1.1 Leroy Seafood Group
- 11.1.1.1. Company Overview
- 11.1.1.2. Products
- 11.1.1.3. Company Financials
- 11.1.1.4. SWOT Analysis
- 11.1.2 Cooke Aquaculture
- 11.1.2.1. Company Overview
- 11.1.2.2. Products
- 11.1.2.3. Company Financials
- 11.1.2.4. SWOT Analysis
- 11.1.3 Cermaq
- 11.1.3.1. Company Overview
- 11.1.3.2. Products
- 11.1.3.3. Company Financials
- 11.1.3.4. SWOT Analysis
- 11.1.4 Mowi
- 11.1.4.1. Company Overview
- 11.1.4.2. Products
- 11.1.4.3. Company Financials
- 11.1.4.4. SWOT Analysis
- 11.1.5 Grieg Seafood
- 11.1.5.1. Company Overview
- 11.1.5.2. Products
- 11.1.5.3. Company Financials
- 11.1.5.4. SWOT Analysis
- 11.1.1 Leroy Seafood Group
- 11.2. Market Entropy
- 11.2.1 Company's Key Areas Served
- 11.2.2 Recent Developments
- 11.3. Company Market Share Analysis 2025
- 11.3.1 Top 5 Companies Market Share Analysis
- 11.3.2 Top 3 Companies Market Share Analysis
- 11.4. List of Potential Customers
- 12. Research Methodology
List of Figures
- Figure 1: Global Salmon Industry Revenue Breakdown (Million, %) by Region 2025 & 2033
- Figure 2: North America Salmon Industry Revenue (Million), by Species Type 2025 & 2033
- Figure 3: North America Salmon Industry Revenue Share (%), by Species Type 2025 & 2033
- Figure 4: North America Salmon Industry Revenue (Million), by Type 2025 & 2033
- Figure 5: North America Salmon Industry Revenue Share (%), by Type 2025 & 2033
- Figure 6: North America Salmon Industry Revenue (Million), by Species Type 2025 & 2033
- Figure 7: North America Salmon Industry Revenue Share (%), by Species Type 2025 & 2033
- Figure 8: North America Salmon Industry Revenue (Million), by Type 2025 & 2033
- Figure 9: North America Salmon Industry Revenue Share (%), by Type 2025 & 2033
- Figure 10: North America Salmon Industry Revenue (Million), by Country 2025 & 2033
- Figure 11: North America Salmon Industry Revenue Share (%), by Country 2025 & 2033
- Figure 12: Europe Salmon Industry Revenue (Million), by Species Type 2025 & 2033
- Figure 13: Europe Salmon Industry Revenue Share (%), by Species Type 2025 & 2033
- Figure 14: Europe Salmon Industry Revenue (Million), by Type 2025 & 2033
- Figure 15: Europe Salmon Industry Revenue Share (%), by Type 2025 & 2033
- Figure 16: Europe Salmon Industry Revenue (Million), by Species Type 2025 & 2033
- Figure 17: Europe Salmon Industry Revenue Share (%), by Species Type 2025 & 2033
- Figure 18: Europe Salmon Industry Revenue (Million), by Type 2025 & 2033
- Figure 19: Europe Salmon Industry Revenue Share (%), by Type 2025 & 2033
- Figure 20: Europe Salmon Industry Revenue (Million), by Country 2025 & 2033
- Figure 21: Europe Salmon Industry Revenue Share (%), by Country 2025 & 2033
- Figure 22: Asia Pacific Salmon Industry Revenue (Million), by Species Type 2025 & 2033
- Figure 23: Asia Pacific Salmon Industry Revenue Share (%), by Species Type 2025 & 2033
- Figure 24: Asia Pacific Salmon Industry Revenue (Million), by Type 2025 & 2033
- Figure 25: Asia Pacific Salmon Industry Revenue Share (%), by Type 2025 & 2033
- Figure 26: Asia Pacific Salmon Industry Revenue (Million), by Species Type 2025 & 2033
- Figure 27: Asia Pacific Salmon Industry Revenue Share (%), by Species Type 2025 & 2033
- Figure 28: Asia Pacific Salmon Industry Revenue (Million), by Type 2025 & 2033
- Figure 29: Asia Pacific Salmon Industry Revenue Share (%), by Type 2025 & 2033
- Figure 30: Asia Pacific Salmon Industry Revenue (Million), by Country 2025 & 2033
- Figure 31: Asia Pacific Salmon Industry Revenue Share (%), by Country 2025 & 2033
- Figure 32: South America Salmon Industry Revenue (Million), by Species Type 2025 & 2033
- Figure 33: South America Salmon Industry Revenue Share (%), by Species Type 2025 & 2033
- Figure 34: South America Salmon Industry Revenue (Million), by Type 2025 & 2033
- Figure 35: South America Salmon Industry Revenue Share (%), by Type 2025 & 2033
- Figure 36: South America Salmon Industry Revenue (Million), by Species Type 2025 & 2033
- Figure 37: South America Salmon Industry Revenue Share (%), by Species Type 2025 & 2033
- Figure 38: South America Salmon Industry Revenue (Million), by Type 2025 & 2033
- Figure 39: South America Salmon Industry Revenue Share (%), by Type 2025 & 2033
- Figure 40: South America Salmon Industry Revenue (Million), by Country 2025 & 2033
- Figure 41: South America Salmon Industry Revenue Share (%), by Country 2025 & 2033
List of Tables
- Table 1: Global Salmon Industry Revenue Million Forecast, by Species Type 2020 & 2033
- Table 2: Global Salmon Industry Revenue Million Forecast, by Type 2020 & 2033
- Table 3: Global Salmon Industry Revenue Million Forecast, by Species Type 2020 & 2033
- Table 4: Global Salmon Industry Revenue Million Forecast, by Type 2020 & 2033
- Table 5: Global Salmon Industry Revenue Million Forecast, by Region 2020 & 2033
- Table 6: Global Salmon Industry Revenue Million Forecast, by Species Type 2020 & 2033
- Table 7: Global Salmon Industry Revenue Million Forecast, by Type 2020 & 2033
- Table 8: Global Salmon Industry Revenue Million Forecast, by Species Type 2020 & 2033
- Table 9: Global Salmon Industry Revenue Million Forecast, by Type 2020 & 2033
- Table 10: Global Salmon Industry Revenue Million Forecast, by Country 2020 & 2033
- Table 11: United States Salmon Industry Revenue (Million) Forecast, by Application 2020 & 2033
- Table 12: Canada Salmon Industry Revenue (Million) Forecast, by Application 2020 & 2033
- Table 13: Global Salmon Industry Revenue Million Forecast, by Species Type 2020 & 2033
- Table 14: Global Salmon Industry Revenue Million Forecast, by Type 2020 & 2033
- Table 15: Global Salmon Industry Revenue Million Forecast, by Species Type 2020 & 2033
- Table 16: Global Salmon Industry Revenue Million Forecast, by Type 2020 & 2033
- Table 17: Global Salmon Industry Revenue Million Forecast, by Country 2020 & 2033
- Table 18: Norway Salmon Industry Revenue (Million) Forecast, by Application 2020 & 2033
- Table 19: Spain Salmon Industry Revenue (Million) Forecast, by Application 2020 & 2033
- Table 20: Netherlands Salmon Industry Revenue (Million) Forecast, by Application 2020 & 2033
- Table 21: France Salmon Industry Revenue (Million) Forecast, by Application 2020 & 2033
- Table 22: Italy Salmon Industry Revenue (Million) Forecast, by Application 2020 & 2033
- Table 23: Greece Salmon Industry Revenue (Million) Forecast, by Application 2020 & 2033
- Table 24: United Kingdom Salmon Industry Revenue (Million) Forecast, by Application 2020 & 2033
- Table 25: Scotland Salmon Industry Revenue (Million) Forecast, by Application 2020 & 2033
- Table 26: Global Salmon Industry Revenue Million Forecast, by Species Type 2020 & 2033
- Table 27: Global Salmon Industry Revenue Million Forecast, by Type 2020 & 2033
- Table 28: Global Salmon Industry Revenue Million Forecast, by Species Type 2020 & 2033
- Table 29: Global Salmon Industry Revenue Million Forecast, by Type 2020 & 2033
- Table 30: Global Salmon Industry Revenue Million Forecast, by Country 2020 & 2033
- Table 31: China Salmon Industry Revenue (Million) Forecast, by Application 2020 & 2033
- Table 32: Japan Salmon Industry Revenue (Million) Forecast, by Application 2020 & 2033
- Table 33: Australia Salmon Industry Revenue (Million) Forecast, by Application 2020 & 2033
- Table 34: Global Salmon Industry Revenue Million Forecast, by Species Type 2020 & 2033
- Table 35: Global Salmon Industry Revenue Million Forecast, by Type 2020 & 2033
- Table 36: Global Salmon Industry Revenue Million Forecast, by Species Type 2020 & 2033
- Table 37: Global Salmon Industry Revenue Million Forecast, by Type 2020 & 2033
- Table 38: Global Salmon Industry Revenue Million Forecast, by Country 2020 & 2033
- Table 39: Chile Salmon Industry Revenue (Million) Forecast, by Application 2020 & 2033
Frequently Asked Questions
1. What is the projected Compound Annual Growth Rate (CAGR) of the Salmon Industry?
The projected CAGR is approximately 8.07%.
2. Which companies are prominent players in the Salmon Industry?
Key companies in the market include Leroy Seafood Group , Cooke Aquaculture , Cermaq, Mowi , Grieg Seafood .
3. What are the main segments of the Salmon Industry?
The market segments include Species Type, Type, Species Type, Type.
4. Can you provide details about the market size?
The market size is estimated to be USD 33.50 Million as of 2022.
5. What are some drivers contributing to market growth?
; Awareness About Health Benefits Associated With Pecan Consumption; Wide Application of Pecan.
6. What are the notable trends driving market growth?
Healthy Boost in the Salmon Production.
7. Are there any restraints impacting market growth?
; Volatility in the Prices; Adverse Weather Conditions Affecting Yield.
8. Can you provide examples of recent developments in the market?
N/A
9. What pricing options are available for accessing the report?
Pricing options include single-user, multi-user, and enterprise licenses priced at USD 4750, USD 5250, and USD 8750 respectively.
10. Is the market size provided in terms of value or volume?
The market size is provided in terms of value, measured in Million.
11. Are there any specific market keywords associated with the report?
Yes, the market keyword associated with the report is "Salmon Industry," which aids in identifying and referencing the specific market segment covered.
12. How do I determine which pricing option suits my needs best?
The pricing options vary based on user requirements and access needs. Individual users may opt for single-user licenses, while businesses requiring broader access may choose multi-user or enterprise licenses for cost-effective access to the report.
13. Are there any additional resources or data provided in the Salmon Industry report?
While the report offers comprehensive insights, it's advisable to review the specific contents or supplementary materials provided to ascertain if additional resources or data are available.
14. How can I stay updated on further developments or reports in the Salmon Industry?
To stay informed about further developments, trends, and reports in the Salmon Industry, consider subscribing to industry newsletters, following relevant companies and organizations, or regularly checking reputable industry news sources and publications.
Methodology
Step 1 - Identification of Relevant Samples Size from Population Database


Step 2 - Approaches for Defining Global Market Size (Value, Volume* & Price*)

Note*: In applicable scenarios
Step 3 - Data Sources
Primary Research
- Web Analytics
- Survey Reports
- Research Institute
- Latest Research Reports
- Opinion Leaders
Secondary Research
- Annual Reports
- White Paper
- Latest Press Release
- Industry Association
- Paid Database
- Investor Presentations

Step 4 - Data Triangulation
Involves using different sources of information in order to increase the validity of a study
These sources are likely to be stakeholders in a program - participants, other researchers, program staff, other community members, and so on.
Then we put all data in single framework & apply various statistical tools to find out the dynamic on the market.
During the analysis stage, feedback from the stakeholder groups would be compared to determine areas of agreement as well as areas of divergence