

Key Insights
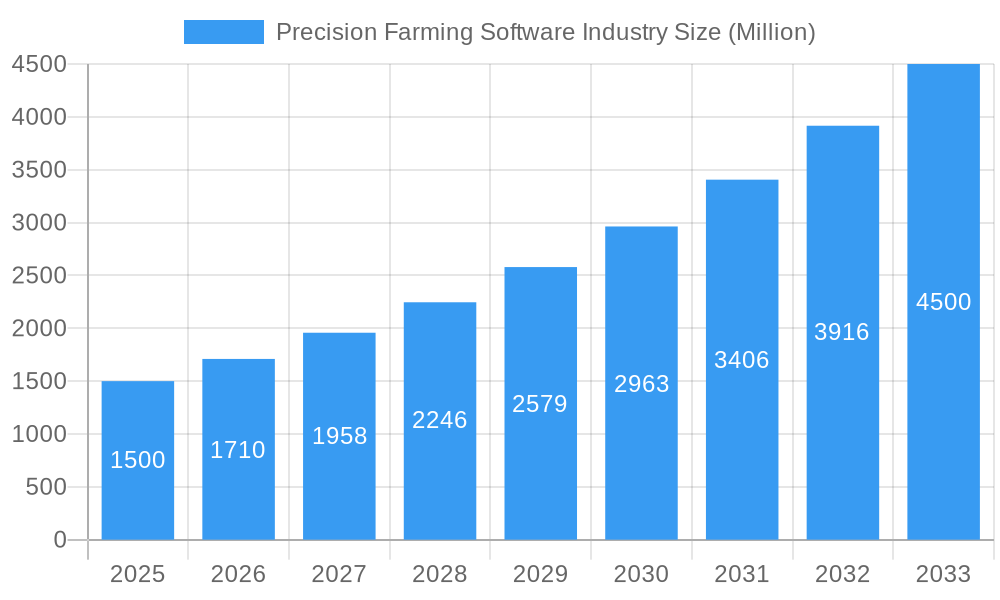
The Precision Farming Software market is poised for significant expansion, projected to reach $2.7 billion by 2025, with a Compound Annual Growth Rate (CAGR) of 13.9% through 2033. This growth is driven by farmers' increasing adoption of technology for enhanced efficiency and profitability. Precision farming software optimizes resource allocation (fertilizers, water, pesticides), leading to increased yields and reduced operational costs. Key contributors include the demand for data-driven agricultural decision-making, advancements in sensors, GPS, and cloud computing. Government initiatives supporting digital agriculture and the availability of user-friendly software solutions further accelerate market penetration. Key application segments like crop management, financial management, and farm inventory management are experiencing robust growth, with cloud-based solutions preferred for their scalability and accessibility over on-premise software.
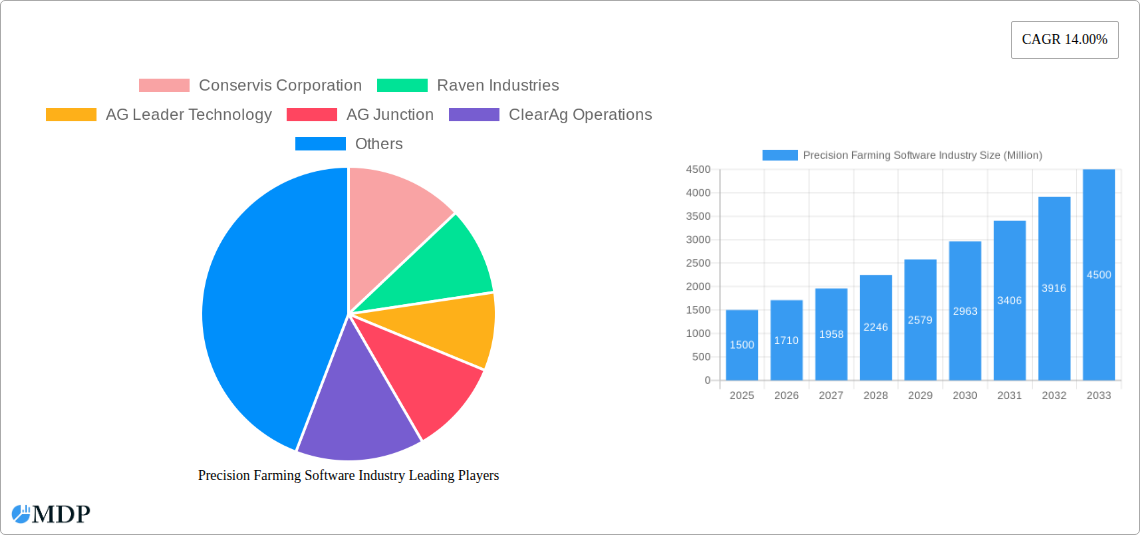
Precision Farming Software Industry Market Size (In Billion)
Market growth faces challenges, including the substantial initial investment required for precision farming technologies, particularly for small-scale farms. Reliable internet connectivity in rural areas and the complexity of integrating diverse software systems within existing farm infrastructure also present hurdles. Nevertheless, the compelling long-term advantages of improved efficiency, reduced waste, and enhanced sustainability are driving sustained adoption. The competitive landscape is dynamic, featuring established industry leaders and innovative startups continuously advancing technology and forging strategic alliances. Emerging economies with large agricultural sectors represent significant opportunities for geographical expansion. The market's future trajectory indicates a sustained upward trend, fueled by technological innovation and the ongoing imperative for sustainable and efficient agricultural practices.
Precision Farming Software Industry Company Market Share
Precision Farming Software Market: A Comprehensive Report (2019-2033)
This comprehensive report provides an in-depth analysis of the global precision farming software market, projecting a market value of $XX Million by 2033. It covers market dynamics, leading players, technological advancements, and future growth opportunities, offering actionable insights for stakeholders across the agricultural technology sector. The study period spans 2019-2033, with 2025 as the base and estimated year. This report is essential for investors, technology providers, farmers, and policymakers seeking to understand and capitalize on the transformative potential of precision farming software.
Precision Farming Software Industry Market Dynamics & Concentration
The precision farming software market is experiencing robust growth, driven by increasing adoption of digital technologies in agriculture. Market concentration is moderate, with several key players holding significant shares but a sizeable number of smaller, specialized companies also competing. The market share of the top 5 players is estimated at xx%, indicating a relatively fragmented landscape. Innovation is a key driver, with continuous advancements in data analytics, sensor technology, and artificial intelligence leading to more efficient and precise farming practices. Regulatory frameworks, while generally supportive of technological advancements in agriculture, vary across regions and can pose challenges for market expansion. Product substitutes, such as traditional farming methods, still exist but are losing ground to the efficiency and data-driven insights offered by precision farming software. End-user trends reveal a growing demand for integrated solutions and cloud-based platforms offering seamless data management and accessibility.
M&A activity in the sector has been steadily increasing, with xx major deals recorded between 2019 and 2024. This consolidation reflects the growing importance of scale and the need for companies to expand their product portfolios and geographical reach. Key factors influencing M&A include:
- Acquisition of specialized technologies and expertise.
- Expansion into new geographical markets.
- Access to broader customer bases.
- Strengthening of product offerings through integration.
Precision Farming Software Industry Industry Trends & Analysis
The global precision farming software market is experiencing significant growth, with a projected Compound Annual Growth Rate (CAGR) of xx% during the forecast period (2025-2033). This growth is primarily fueled by several key factors. Firstly, the rising demand for increased crop yields and improved resource efficiency is driving adoption. Secondly, technological advancements, such as the development of advanced sensors, data analytics platforms, and AI-powered decision support systems, are enhancing the capabilities and effectiveness of precision farming software. Furthermore, favorable government policies and subsidies aimed at promoting digital agriculture are boosting market penetration. The increasing availability of affordable high-speed internet and mobile connectivity in rural areas further accelerates adoption. The shift towards cloud-based solutions is also significantly impacting market trends, providing farmers with greater accessibility and scalability. Competitive dynamics are marked by intense innovation and strategic partnerships between software providers and agricultural equipment manufacturers.
Market penetration remains relatively low in many developing countries, indicating significant untapped potential for future growth. Consumer preferences are trending towards user-friendly interfaces, integrated platforms, and solutions that offer clear return-on-investment (ROI) for farmers. The market is witnessing a rise in subscription-based models for software access, along with increased focus on providing data security and privacy assurances to users.
Leading Markets & Segments in Precision Farming Software Industry
North America currently holds the dominant position in the precision farming software market, primarily due to the high adoption rate of advanced technologies among farmers and the presence of major players in the region. Europe follows as a significant market, with a focus on sustainable farming practices and government support for digital agriculture. The Asia-Pacific region presents considerable growth potential, although market penetration is relatively lower compared to North America and Europe. Among the application segments, Crop Management holds the largest market share, followed by Financial Management and Farm Inventory Management. Cloud-based solutions dominate the market over local or web-based options due to their scalability, accessibility, and data management capabilities.
Key drivers contributing to market dominance in different regions and segments include:
- North America: High technology adoption rates, well-established agricultural infrastructure, and the presence of major software developers.
- Europe: Focus on sustainable agriculture, government support for technological innovation, and a strong agricultural sector.
- Asia-Pacific: Growing agricultural sector, increasing government investments in digital agriculture, and rising smartphone penetration.
- Crop Management: Essential for yield optimization, resource management, and reducing operational costs.
- Cloud-based solutions: Enhanced accessibility, scalability, and data management capabilities.
Detailed analysis further reveals that the dominance of specific regions and segments is attributable to factors like economic policies supportive of technological adoption, well-developed agricultural infrastructure, high internet penetration rates, and a receptive farming community embracing digital solutions.
Precision Farming Software Industry Product Developments
Recent product developments have focused on integrating various data sources, including sensor data, satellite imagery, and weather information, to provide farmers with a holistic view of their operations. Advances in AI and machine learning are enabling predictive analytics for crop yield, pest management, and irrigation optimization. The emphasis is on creating user-friendly interfaces and seamless integration with existing farm management systems. Key competitive advantages stem from the accuracy of data analysis, the breadth of integrated features, and the robustness of customer support systems. Technological trends indicate a continued movement towards autonomous operations and the Internet of Things (IoT) integration.
Key Drivers of Precision Farming Software Growth
Several factors are driving the growth of the precision farming software industry. Technological advancements, particularly in areas like AI, machine learning, and sensor technology, are improving the accuracy and efficiency of farming practices. Economic incentives, such as government subsidies and the potential for increased profitability through optimized resource use, are driving adoption. Regulatory frameworks supportive of technological innovation in the agricultural sector are further accelerating market growth. Specifically, government initiatives promoting sustainable agriculture and digitalization are fostering wider adoption.
Challenges in the Precision Farming Software Industry Market
The precision farming software market faces several challenges. High initial investment costs for technology and infrastructure can be a barrier to entry for smaller farmers. Data security concerns and the need for robust cybersecurity measures are crucial considerations. Integration challenges with existing farm management systems can also hinder adoption. Furthermore, the need for reliable internet connectivity, particularly in rural areas, remains a significant constraint for widespread adoption. The competitive landscape, with numerous players offering similar solutions, also creates challenges for companies seeking to differentiate their offerings. These challenges cumulatively impact market growth, limiting its potential at a xx% rate.
Emerging Opportunities in Precision Farming Software Industry
Significant opportunities exist for long-term growth in the precision farming software market. Emerging technologies such as blockchain for secure data management and the increasing use of drones for data acquisition are creating new possibilities. Strategic partnerships between software providers, agricultural equipment manufacturers, and data analytics firms are opening up new avenues for market expansion. Furthermore, the growing focus on sustainable and environmentally friendly farming practices presents an opportunity for precision farming software to play a critical role in optimizing resource use and minimizing environmental impact. Expanding into new geographical markets, particularly in developing countries with significant agricultural potential, offers substantial growth potential.
Leading Players in the Precision Farming Software Industry Sector
- Conservis Corporation
- Raven Industries
- AG Leader Technology
- AG Junction
- ClearAg Operations
- Deere & Company
- Fairport Farm Software
- AG DNA
- Topcon Positioning Systems
- Trimble Inc
- Bayer CropScience AG
- Agribotix
- Case IH Agriculture
- Mapshots Inc
- IBM
- AGCO Corporation
Key Milestones in Precision Farming Software Industry Industry
- 2020: Several major players launched cloud-based platforms offering enhanced data management and analytics capabilities.
- 2021: Increased focus on AI-powered decision support systems for crop management and pest control.
- 2022: Several mergers and acquisitions occurred, consolidating market share and expanding product portfolios.
- 2023: Significant investments in research and development leading to advancements in sensor technology and data analytics.
- 2024: Growing adoption of precision farming software in developing countries.
Strategic Outlook for Precision Farming Software Market
The future of the precision farming software market is bright, with significant growth potential driven by ongoing technological advancements and increasing adoption among farmers globally. Strategic opportunities lie in developing innovative solutions that address the specific needs of farmers in different regions and crop types. Expanding into new application areas, such as livestock management and supply chain optimization, also presents opportunities for growth. Strategic partnerships and collaborations will play a key role in accelerating market penetration and driving innovation. The market is poised for significant expansion, with continuous improvements in data analytics, AI, and connectivity paving the way for further advancements in efficiency and sustainability within the agricultural sector.
Precision Farming Software Industry Segmentation
-
1. Application
- 1.1. Crop Management
- 1.2. Financial Management
- 1.3. Farm Inventory Management
- 1.4. Personnel Management
- 1.5. Weather Tracking and Forecasting
- 1.6. Other Applications
-
2. Type
- 2.1. Local or Web-based
- 2.2. Cloud-based
-
3. Application
- 3.1. Crop Management
- 3.2. Financial Management
- 3.3. Farm Inventory Management
- 3.4. Personnel Management
- 3.5. Weather Tracking and Forecasting
- 3.6. Other Applications
-
4. Type
- 4.1. Local or Web-based
- 4.2. Cloud-based
Precision Farming Software Industry Segmentation By Geography
-
1. North America
- 1.1. United States
- 1.2. Canada
- 1.3. Mexico
- 1.4. Rest of North America
-
2. Europe
- 2.1. Germany
- 2.2. United Kingdom
- 2.3. France
- 2.4. Italy
- 2.5. Spain
- 2.6. Rest of Europe
-
3. Asia Pacific
- 3.1. China
- 3.2. Japan
- 3.3. India
- 3.4. Australia
- 3.5. Rest of Asia Pacific
-
4. South America
- 4.1. Brazil
- 4.2. Argentina
- 4.3. Rest of South America
-
5. Africa
- 5.1. South Africa
- 5.2. Rest of Africa
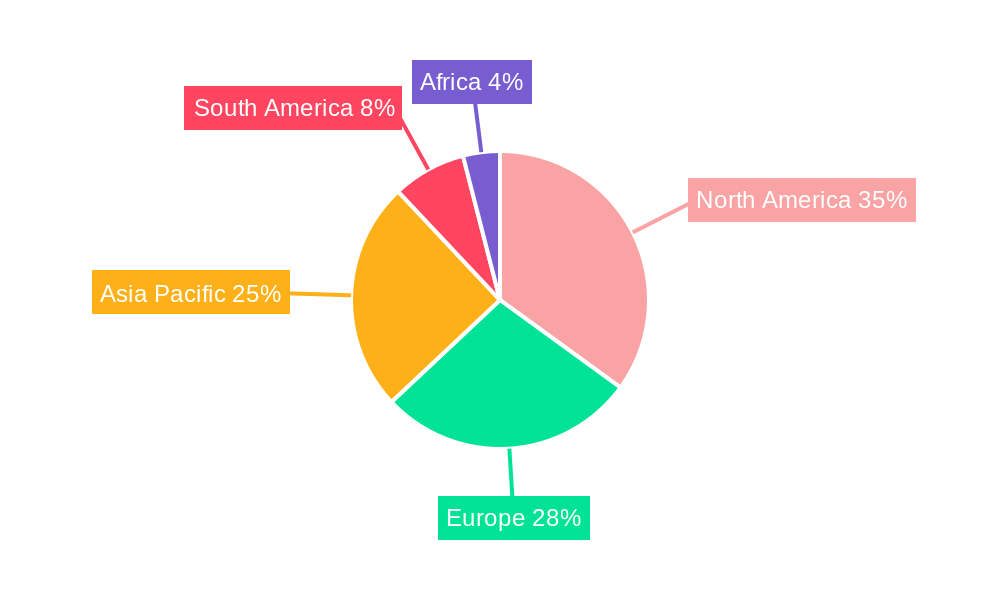
Precision Farming Software Industry Regional Market Share
Geographic Coverage of Precision Farming Software Industry
Precision Farming Software Industry REPORT HIGHLIGHTS
| Aspects | Details |
|---|---|
| Study Period | 2020-2034 |
| Base Year | 2025 |
| Estimated Year | 2026 |
| Forecast Period | 2026-2034 |
| Historical Period | 2020-2025 |
| Growth Rate | CAGR of 13.9% from 2020-2034 |
| Segmentation |
|
Table of Contents
- 1. Introduction
- 1.1. Research Scope
- 1.2. Market Segmentation
- 1.3. Research Objective
- 1.4. Definitions and Assumptions
- 2. Executive Summary
- 2.1. Market Snapshot
- 3. Market Dynamics
- 3.1. Market Drivers
- 3.2. Market Restrains
- 3.3. Market Trends
- 3.4. Market Opportunities
- 4. Market Factor Analysis
- 4.1. Porters Five Forces
- 4.1.1. Bargaining Power of Suppliers
- 4.1.2. Bargaining Power of Buyers
- 4.1.3. Threat of New Entrants
- 4.1.4. Threat of Substitutes
- 4.1.5. Competitive Rivalry
- 4.2. PESTEL analysis
- 4.3. BCG Analysis
- 4.3.1. Stars (High Growth, High Market Share)
- 4.3.2. Cash Cows (Low Growth, High Market Share)
- 4.3.3. Question Mark (High Growth, Low Market Share)
- 4.3.4. Dogs (Low Growth, Low Market Share)
- 4.4. Ansoff Matrix Analysis
- 4.5. Supply Chain Analysis
- 4.6. Regulatory Landscape
- 4.7. Current Market Potential and Opportunity Assessment (TAM–SAM–SOM Framework)
- 4.8. MDP Analyst Note
- 4.1. Porters Five Forces
- 5. Market Analysis, Insights and Forecast 2021-2033
- 5.1. Market Analysis, Insights and Forecast - by Application
- 5.1.1. Crop Management
- 5.1.2. Financial Management
- 5.1.3. Farm Inventory Management
- 5.1.4. Personnel Management
- 5.1.5. Weather Tracking and Forecasting
- 5.1.6. Other Applications
- 5.2. Market Analysis, Insights and Forecast - by Type
- 5.2.1. Local or Web-based
- 5.2.2. Cloud-based
- 5.3. Market Analysis, Insights and Forecast - by Application
- 5.3.1. Crop Management
- 5.3.2. Financial Management
- 5.3.3. Farm Inventory Management
- 5.3.4. Personnel Management
- 5.3.5. Weather Tracking and Forecasting
- 5.3.6. Other Applications
- 5.4. Market Analysis, Insights and Forecast - by Type
- 5.4.1. Local or Web-based
- 5.4.2. Cloud-based
- 5.5. Market Analysis, Insights and Forecast - by Region
- 5.5.1. North America
- 5.5.2. Europe
- 5.5.3. Asia Pacific
- 5.5.4. South America
- 5.5.5. Africa
- 5.1. Market Analysis, Insights and Forecast - by Application
- 6. Global Precision Farming Software Industry Analysis, Insights and Forecast, 2021-2033
- 6.1. Market Analysis, Insights and Forecast - by Application
- 6.1.1. Crop Management
- 6.1.2. Financial Management
- 6.1.3. Farm Inventory Management
- 6.1.4. Personnel Management
- 6.1.5. Weather Tracking and Forecasting
- 6.1.6. Other Applications
- 6.2. Market Analysis, Insights and Forecast - by Type
- 6.2.1. Local or Web-based
- 6.2.2. Cloud-based
- 6.3. Market Analysis, Insights and Forecast - by Application
- 6.3.1. Crop Management
- 6.3.2. Financial Management
- 6.3.3. Farm Inventory Management
- 6.3.4. Personnel Management
- 6.3.5. Weather Tracking and Forecasting
- 6.3.6. Other Applications
- 6.4. Market Analysis, Insights and Forecast - by Type
- 6.4.1. Local or Web-based
- 6.4.2. Cloud-based
- 6.1. Market Analysis, Insights and Forecast - by Application
- 7. North America Precision Farming Software Industry Analysis, Insights and Forecast, 2020-2032
- 7.1. Market Analysis, Insights and Forecast - by Application
- 7.1.1. Crop Management
- 7.1.2. Financial Management
- 7.1.3. Farm Inventory Management
- 7.1.4. Personnel Management
- 7.1.5. Weather Tracking and Forecasting
- 7.1.6. Other Applications
- 7.2. Market Analysis, Insights and Forecast - by Type
- 7.2.1. Local or Web-based
- 7.2.2. Cloud-based
- 7.3. Market Analysis, Insights and Forecast - by Application
- 7.3.1. Crop Management
- 7.3.2. Financial Management
- 7.3.3. Farm Inventory Management
- 7.3.4. Personnel Management
- 7.3.5. Weather Tracking and Forecasting
- 7.3.6. Other Applications
- 7.4. Market Analysis, Insights and Forecast - by Type
- 7.4.1. Local or Web-based
- 7.4.2. Cloud-based
- 7.1. Market Analysis, Insights and Forecast - by Application
- 8. Europe Precision Farming Software Industry Analysis, Insights and Forecast, 2020-2032
- 8.1. Market Analysis, Insights and Forecast - by Application
- 8.1.1. Crop Management
- 8.1.2. Financial Management
- 8.1.3. Farm Inventory Management
- 8.1.4. Personnel Management
- 8.1.5. Weather Tracking and Forecasting
- 8.1.6. Other Applications
- 8.2. Market Analysis, Insights and Forecast - by Type
- 8.2.1. Local or Web-based
- 8.2.2. Cloud-based
- 8.3. Market Analysis, Insights and Forecast - by Application
- 8.3.1. Crop Management
- 8.3.2. Financial Management
- 8.3.3. Farm Inventory Management
- 8.3.4. Personnel Management
- 8.3.5. Weather Tracking and Forecasting
- 8.3.6. Other Applications
- 8.4. Market Analysis, Insights and Forecast - by Type
- 8.4.1. Local or Web-based
- 8.4.2. Cloud-based
- 8.1. Market Analysis, Insights and Forecast - by Application
- 9. Asia Pacific Precision Farming Software Industry Analysis, Insights and Forecast, 2020-2032
- 9.1. Market Analysis, Insights and Forecast - by Application
- 9.1.1. Crop Management
- 9.1.2. Financial Management
- 9.1.3. Farm Inventory Management
- 9.1.4. Personnel Management
- 9.1.5. Weather Tracking and Forecasting
- 9.1.6. Other Applications
- 9.2. Market Analysis, Insights and Forecast - by Type
- 9.2.1. Local or Web-based
- 9.2.2. Cloud-based
- 9.3. Market Analysis, Insights and Forecast - by Application
- 9.3.1. Crop Management
- 9.3.2. Financial Management
- 9.3.3. Farm Inventory Management
- 9.3.4. Personnel Management
- 9.3.5. Weather Tracking and Forecasting
- 9.3.6. Other Applications
- 9.4. Market Analysis, Insights and Forecast - by Type
- 9.4.1. Local or Web-based
- 9.4.2. Cloud-based
- 9.1. Market Analysis, Insights and Forecast - by Application
- 10. South America Precision Farming Software Industry Analysis, Insights and Forecast, 2020-2032
- 10.1. Market Analysis, Insights and Forecast - by Application
- 10.1.1. Crop Management
- 10.1.2. Financial Management
- 10.1.3. Farm Inventory Management
- 10.1.4. Personnel Management
- 10.1.5. Weather Tracking and Forecasting
- 10.1.6. Other Applications
- 10.2. Market Analysis, Insights and Forecast - by Type
- 10.2.1. Local or Web-based
- 10.2.2. Cloud-based
- 10.3. Market Analysis, Insights and Forecast - by Application
- 10.3.1. Crop Management
- 10.3.2. Financial Management
- 10.3.3. Farm Inventory Management
- 10.3.4. Personnel Management
- 10.3.5. Weather Tracking and Forecasting
- 10.3.6. Other Applications
- 10.4. Market Analysis, Insights and Forecast - by Type
- 10.4.1. Local or Web-based
- 10.4.2. Cloud-based
- 10.1. Market Analysis, Insights and Forecast - by Application
- 11. Africa Precision Farming Software Industry Analysis, Insights and Forecast, 2020-2032
- 11.1. Market Analysis, Insights and Forecast - by Application
- 11.1.1. Crop Management
- 11.1.2. Financial Management
- 11.1.3. Farm Inventory Management
- 11.1.4. Personnel Management
- 11.1.5. Weather Tracking and Forecasting
- 11.1.6. Other Applications
- 11.2. Market Analysis, Insights and Forecast - by Type
- 11.2.1. Local or Web-based
- 11.2.2. Cloud-based
- 11.3. Market Analysis, Insights and Forecast - by Application
- 11.3.1. Crop Management
- 11.3.2. Financial Management
- 11.3.3. Farm Inventory Management
- 11.3.4. Personnel Management
- 11.3.5. Weather Tracking and Forecasting
- 11.3.6. Other Applications
- 11.4. Market Analysis, Insights and Forecast - by Type
- 11.4.1. Local or Web-based
- 11.4.2. Cloud-based
- 11.1. Market Analysis, Insights and Forecast - by Application
- 12. Competitive Analysis
- 12.1. Company Profiles
- 12.1.1 Conservis Corporation
- 12.1.1.1. Company Overview
- 12.1.1.2. Products
- 12.1.1.3. Company Financials
- 12.1.1.4. SWOT Analysis
- 12.1.2 Raven Industries
- 12.1.2.1. Company Overview
- 12.1.2.2. Products
- 12.1.2.3. Company Financials
- 12.1.2.4. SWOT Analysis
- 12.1.3 AG Leader Technology
- 12.1.3.1. Company Overview
- 12.1.3.2. Products
- 12.1.3.3. Company Financials
- 12.1.3.4. SWOT Analysis
- 12.1.4 AG Junction
- 12.1.4.1. Company Overview
- 12.1.4.2. Products
- 12.1.4.3. Company Financials
- 12.1.4.4. SWOT Analysis
- 12.1.5 ClearAg Operations
- 12.1.5.1. Company Overview
- 12.1.5.2. Products
- 12.1.5.3. Company Financials
- 12.1.5.4. SWOT Analysis
- 12.1.6 Deere & Company
- 12.1.6.1. Company Overview
- 12.1.6.2. Products
- 12.1.6.3. Company Financials
- 12.1.6.4. SWOT Analysis
- 12.1.7 Fairport Farm Software
- 12.1.7.1. Company Overview
- 12.1.7.2. Products
- 12.1.7.3. Company Financials
- 12.1.7.4. SWOT Analysis
- 12.1.8 AG DNA
- 12.1.8.1. Company Overview
- 12.1.8.2. Products
- 12.1.8.3. Company Financials
- 12.1.8.4. SWOT Analysis
- 12.1.9 Topcon Positioning Systems
- 12.1.9.1. Company Overview
- 12.1.9.2. Products
- 12.1.9.3. Company Financials
- 12.1.9.4. SWOT Analysis
- 12.1.10 Trimble Inc
- 12.1.10.1. Company Overview
- 12.1.10.2. Products
- 12.1.10.3. Company Financials
- 12.1.10.4. SWOT Analysis
- 12.1.11 Bayer CropScience AG
- 12.1.11.1. Company Overview
- 12.1.11.2. Products
- 12.1.11.3. Company Financials
- 12.1.11.4. SWOT Analysis
- 12.1.12 Agribotix
- 12.1.12.1. Company Overview
- 12.1.12.2. Products
- 12.1.12.3. Company Financials
- 12.1.12.4. SWOT Analysis
- 12.1.13 Case IH Agriculture
- 12.1.13.1. Company Overview
- 12.1.13.2. Products
- 12.1.13.3. Company Financials
- 12.1.13.4. SWOT Analysis
- 12.1.14 Mapshots Inc
- 12.1.14.1. Company Overview
- 12.1.14.2. Products
- 12.1.14.3. Company Financials
- 12.1.14.4. SWOT Analysis
- 12.1.15 IBM
- 12.1.15.1. Company Overview
- 12.1.15.2. Products
- 12.1.15.3. Company Financials
- 12.1.15.4. SWOT Analysis
- 12.1.16 AGCO Corporation
- 12.1.16.1. Company Overview
- 12.1.16.2. Products
- 12.1.16.3. Company Financials
- 12.1.16.4. SWOT Analysis
- 12.1.1 Conservis Corporation
- 12.2. Market Entropy
- 12.2.1 Company's Key Areas Served
- 12.2.2 Recent Developments
- 12.3. Company Market Share Analysis 2025
- 12.3.1 Top 5 Companies Market Share Analysis
- 12.3.2 Top 3 Companies Market Share Analysis
- 12.4. List of Potential Customers
- 13. Research Methodology
List of Figures
- Figure 1: Global Precision Farming Software Industry Revenue Breakdown (billion, %) by Region 2025 & 2033
- Figure 2: North America Precision Farming Software Industry Revenue (billion), by Application 2025 & 2033
- Figure 3: North America Precision Farming Software Industry Revenue Share (%), by Application 2025 & 2033
- Figure 4: North America Precision Farming Software Industry Revenue (billion), by Type 2025 & 2033
- Figure 5: North America Precision Farming Software Industry Revenue Share (%), by Type 2025 & 2033
- Figure 6: North America Precision Farming Software Industry Revenue (billion), by Application 2025 & 2033
- Figure 7: North America Precision Farming Software Industry Revenue Share (%), by Application 2025 & 2033
- Figure 8: North America Precision Farming Software Industry Revenue (billion), by Type 2025 & 2033
- Figure 9: North America Precision Farming Software Industry Revenue Share (%), by Type 2025 & 2033
- Figure 10: North America Precision Farming Software Industry Revenue (billion), by Country 2025 & 2033
- Figure 11: North America Precision Farming Software Industry Revenue Share (%), by Country 2025 & 2033
- Figure 12: Europe Precision Farming Software Industry Revenue (billion), by Application 2025 & 2033
- Figure 13: Europe Precision Farming Software Industry Revenue Share (%), by Application 2025 & 2033
- Figure 14: Europe Precision Farming Software Industry Revenue (billion), by Type 2025 & 2033
- Figure 15: Europe Precision Farming Software Industry Revenue Share (%), by Type 2025 & 2033
- Figure 16: Europe Precision Farming Software Industry Revenue (billion), by Application 2025 & 2033
- Figure 17: Europe Precision Farming Software Industry Revenue Share (%), by Application 2025 & 2033
- Figure 18: Europe Precision Farming Software Industry Revenue (billion), by Type 2025 & 2033
- Figure 19: Europe Precision Farming Software Industry Revenue Share (%), by Type 2025 & 2033
- Figure 20: Europe Precision Farming Software Industry Revenue (billion), by Country 2025 & 2033
- Figure 21: Europe Precision Farming Software Industry Revenue Share (%), by Country 2025 & 2033
- Figure 22: Asia Pacific Precision Farming Software Industry Revenue (billion), by Application 2025 & 2033
- Figure 23: Asia Pacific Precision Farming Software Industry Revenue Share (%), by Application 2025 & 2033
- Figure 24: Asia Pacific Precision Farming Software Industry Revenue (billion), by Type 2025 & 2033
- Figure 25: Asia Pacific Precision Farming Software Industry Revenue Share (%), by Type 2025 & 2033
- Figure 26: Asia Pacific Precision Farming Software Industry Revenue (billion), by Application 2025 & 2033
- Figure 27: Asia Pacific Precision Farming Software Industry Revenue Share (%), by Application 2025 & 2033
- Figure 28: Asia Pacific Precision Farming Software Industry Revenue (billion), by Type 2025 & 2033
- Figure 29: Asia Pacific Precision Farming Software Industry Revenue Share (%), by Type 2025 & 2033
- Figure 30: Asia Pacific Precision Farming Software Industry Revenue (billion), by Country 2025 & 2033
- Figure 31: Asia Pacific Precision Farming Software Industry Revenue Share (%), by Country 2025 & 2033
- Figure 32: South America Precision Farming Software Industry Revenue (billion), by Application 2025 & 2033
- Figure 33: South America Precision Farming Software Industry Revenue Share (%), by Application 2025 & 2033
- Figure 34: South America Precision Farming Software Industry Revenue (billion), by Type 2025 & 2033
- Figure 35: South America Precision Farming Software Industry Revenue Share (%), by Type 2025 & 2033
- Figure 36: South America Precision Farming Software Industry Revenue (billion), by Application 2025 & 2033
- Figure 37: South America Precision Farming Software Industry Revenue Share (%), by Application 2025 & 2033
- Figure 38: South America Precision Farming Software Industry Revenue (billion), by Type 2025 & 2033
- Figure 39: South America Precision Farming Software Industry Revenue Share (%), by Type 2025 & 2033
- Figure 40: South America Precision Farming Software Industry Revenue (billion), by Country 2025 & 2033
- Figure 41: South America Precision Farming Software Industry Revenue Share (%), by Country 2025 & 2033
- Figure 42: Africa Precision Farming Software Industry Revenue (billion), by Application 2025 & 2033
- Figure 43: Africa Precision Farming Software Industry Revenue Share (%), by Application 2025 & 2033
- Figure 44: Africa Precision Farming Software Industry Revenue (billion), by Type 2025 & 2033
- Figure 45: Africa Precision Farming Software Industry Revenue Share (%), by Type 2025 & 2033
- Figure 46: Africa Precision Farming Software Industry Revenue (billion), by Application 2025 & 2033
- Figure 47: Africa Precision Farming Software Industry Revenue Share (%), by Application 2025 & 2033
- Figure 48: Africa Precision Farming Software Industry Revenue (billion), by Type 2025 & 2033
- Figure 49: Africa Precision Farming Software Industry Revenue Share (%), by Type 2025 & 2033
- Figure 50: Africa Precision Farming Software Industry Revenue (billion), by Country 2025 & 2033
- Figure 51: Africa Precision Farming Software Industry Revenue Share (%), by Country 2025 & 2033
List of Tables
- Table 1: Global Precision Farming Software Industry Revenue billion Forecast, by Application 2020 & 2033
- Table 2: Global Precision Farming Software Industry Revenue billion Forecast, by Type 2020 & 2033
- Table 3: Global Precision Farming Software Industry Revenue billion Forecast, by Application 2020 & 2033
- Table 4: Global Precision Farming Software Industry Revenue billion Forecast, by Type 2020 & 2033
- Table 5: Global Precision Farming Software Industry Revenue billion Forecast, by Region 2020 & 2033
- Table 6: Global Precision Farming Software Industry Revenue billion Forecast, by Application 2020 & 2033
- Table 7: Global Precision Farming Software Industry Revenue billion Forecast, by Type 2020 & 2033
- Table 8: Global Precision Farming Software Industry Revenue billion Forecast, by Application 2020 & 2033
- Table 9: Global Precision Farming Software Industry Revenue billion Forecast, by Type 2020 & 2033
- Table 10: Global Precision Farming Software Industry Revenue billion Forecast, by Country 2020 & 2033
- Table 11: United States Precision Farming Software Industry Revenue (billion) Forecast, by Application 2020 & 2033
- Table 12: Canada Precision Farming Software Industry Revenue (billion) Forecast, by Application 2020 & 2033
- Table 13: Mexico Precision Farming Software Industry Revenue (billion) Forecast, by Application 2020 & 2033
- Table 14: Rest of North America Precision Farming Software Industry Revenue (billion) Forecast, by Application 2020 & 2033
- Table 15: Global Precision Farming Software Industry Revenue billion Forecast, by Application 2020 & 2033
- Table 16: Global Precision Farming Software Industry Revenue billion Forecast, by Type 2020 & 2033
- Table 17: Global Precision Farming Software Industry Revenue billion Forecast, by Application 2020 & 2033
- Table 18: Global Precision Farming Software Industry Revenue billion Forecast, by Type 2020 & 2033
- Table 19: Global Precision Farming Software Industry Revenue billion Forecast, by Country 2020 & 2033
- Table 20: Germany Precision Farming Software Industry Revenue (billion) Forecast, by Application 2020 & 2033
- Table 21: United Kingdom Precision Farming Software Industry Revenue (billion) Forecast, by Application 2020 & 2033
- Table 22: France Precision Farming Software Industry Revenue (billion) Forecast, by Application 2020 & 2033
- Table 23: Italy Precision Farming Software Industry Revenue (billion) Forecast, by Application 2020 & 2033
- Table 24: Spain Precision Farming Software Industry Revenue (billion) Forecast, by Application 2020 & 2033
- Table 25: Rest of Europe Precision Farming Software Industry Revenue (billion) Forecast, by Application 2020 & 2033
- Table 26: Global Precision Farming Software Industry Revenue billion Forecast, by Application 2020 & 2033
- Table 27: Global Precision Farming Software Industry Revenue billion Forecast, by Type 2020 & 2033
- Table 28: Global Precision Farming Software Industry Revenue billion Forecast, by Application 2020 & 2033
- Table 29: Global Precision Farming Software Industry Revenue billion Forecast, by Type 2020 & 2033
- Table 30: Global Precision Farming Software Industry Revenue billion Forecast, by Country 2020 & 2033
- Table 31: China Precision Farming Software Industry Revenue (billion) Forecast, by Application 2020 & 2033
- Table 32: Japan Precision Farming Software Industry Revenue (billion) Forecast, by Application 2020 & 2033
- Table 33: India Precision Farming Software Industry Revenue (billion) Forecast, by Application 2020 & 2033
- Table 34: Australia Precision Farming Software Industry Revenue (billion) Forecast, by Application 2020 & 2033
- Table 35: Rest of Asia Pacific Precision Farming Software Industry Revenue (billion) Forecast, by Application 2020 & 2033
- Table 36: Global Precision Farming Software Industry Revenue billion Forecast, by Application 2020 & 2033
- Table 37: Global Precision Farming Software Industry Revenue billion Forecast, by Type 2020 & 2033
- Table 38: Global Precision Farming Software Industry Revenue billion Forecast, by Application 2020 & 2033
- Table 39: Global Precision Farming Software Industry Revenue billion Forecast, by Type 2020 & 2033
- Table 40: Global Precision Farming Software Industry Revenue billion Forecast, by Country 2020 & 2033
- Table 41: Brazil Precision Farming Software Industry Revenue (billion) Forecast, by Application 2020 & 2033
- Table 42: Argentina Precision Farming Software Industry Revenue (billion) Forecast, by Application 2020 & 2033
- Table 43: Rest of South America Precision Farming Software Industry Revenue (billion) Forecast, by Application 2020 & 2033
- Table 44: Global Precision Farming Software Industry Revenue billion Forecast, by Application 2020 & 2033
- Table 45: Global Precision Farming Software Industry Revenue billion Forecast, by Type 2020 & 2033
- Table 46: Global Precision Farming Software Industry Revenue billion Forecast, by Application 2020 & 2033
- Table 47: Global Precision Farming Software Industry Revenue billion Forecast, by Type 2020 & 2033
- Table 48: Global Precision Farming Software Industry Revenue billion Forecast, by Country 2020 & 2033
- Table 49: South Africa Precision Farming Software Industry Revenue (billion) Forecast, by Application 2020 & 2033
- Table 50: Rest of Africa Precision Farming Software Industry Revenue (billion) Forecast, by Application 2020 & 2033
Frequently Asked Questions
1. What is the projected Compound Annual Growth Rate (CAGR) of the Precision Farming Software Industry?
The projected CAGR is approximately 13.9%.
2. Which companies are prominent players in the Precision Farming Software Industry?
Key companies in the market include Conservis Corporation, Raven Industries, AG Leader Technology, AG Junction, ClearAg Operations, Deere & Company, Fairport Farm Software, AG DNA, Topcon Positioning Systems, Trimble Inc, Bayer CropScience AG, Agribotix, Case IH Agriculture, Mapshots Inc, IBM, AGCO Corporation.
3. What are the main segments of the Precision Farming Software Industry?
The market segments include Application, Type, Application, Type.
4. Can you provide details about the market size?
The market size is estimated to be USD 2.7 billion as of 2022.
5. What are some drivers contributing to market growth?
Increasing Demand for Tomato; Adoption of Greenhouse Technology in Tomato Cultivation; Government support.
6. What are the notable trends driving market growth?
Farm Labor Shortage and Rise in Average Farm Size.
7. Are there any restraints impacting market growth?
Increasing Loses due to Physiological Disorder. Pest and Disease; Unfavourable Climatic Condition.
8. Can you provide examples of recent developments in the market?
N/A
9. What pricing options are available for accessing the report?
Pricing options include single-user, multi-user, and enterprise licenses priced at USD 4750, USD 5250, and USD 8750 respectively.
10. Is the market size provided in terms of value or volume?
The market size is provided in terms of value, measured in billion.
11. Are there any specific market keywords associated with the report?
Yes, the market keyword associated with the report is "Precision Farming Software Industry," which aids in identifying and referencing the specific market segment covered.
12. How do I determine which pricing option suits my needs best?
The pricing options vary based on user requirements and access needs. Individual users may opt for single-user licenses, while businesses requiring broader access may choose multi-user or enterprise licenses for cost-effective access to the report.
13. Are there any additional resources or data provided in the Precision Farming Software Industry report?
While the report offers comprehensive insights, it's advisable to review the specific contents or supplementary materials provided to ascertain if additional resources or data are available.
14. How can I stay updated on further developments or reports in the Precision Farming Software Industry?
To stay informed about further developments, trends, and reports in the Precision Farming Software Industry, consider subscribing to industry newsletters, following relevant companies and organizations, or regularly checking reputable industry news sources and publications.
Methodology
Step 1 - Identification of Relevant Samples Size from Population Database


Step 2 - Approaches for Defining Global Market Size (Value, Volume* & Price*)

Note*: In applicable scenarios
Step 3 - Data Sources
Primary Research
- Web Analytics
- Survey Reports
- Research Institute
- Latest Research Reports
- Opinion Leaders
Secondary Research
- Annual Reports
- White Paper
- Latest Press Release
- Industry Association
- Paid Database
- Investor Presentations

Step 4 - Data Triangulation
Involves using different sources of information in order to increase the validity of a study
These sources are likely to be stakeholders in a program - participants, other researchers, program staff, other community members, and so on.
Then we put all data in single framework & apply various statistical tools to find out the dynamic on the market.
During the analysis stage, feedback from the stakeholder groups would be compared to determine areas of agreement as well as areas of divergence