

Key Insights
The global nematicides market, valued at approximately $289.36 million in 2025, is projected for significant expansion, driven by a Compound Annual Growth Rate (CAGR) of 4.2% from 2025 to 2033. Key growth drivers include increasing demand for higher crop yields and premium agricultural produce. The escalating incidence of nematode infestations across diverse crops, such as commercial crops, fruits and vegetables, grains and cereals, pulses and oilseeds, and ornamental plants, underscores the critical need for effective nematicide solutions. Advancements in nematicide formulations, emphasizing targeted and eco-friendly options, further propel market growth. Prevailing application methods include chemigation, foliar application, and soil treatment, each addressing specific crop requirements and nematode vulnerabilities. While innovation and heightened awareness of nematode damage foster market expansion, regulatory constraints on certain nematicide types due to environmental concerns and the emergence of nematode resistance present notable challenges.
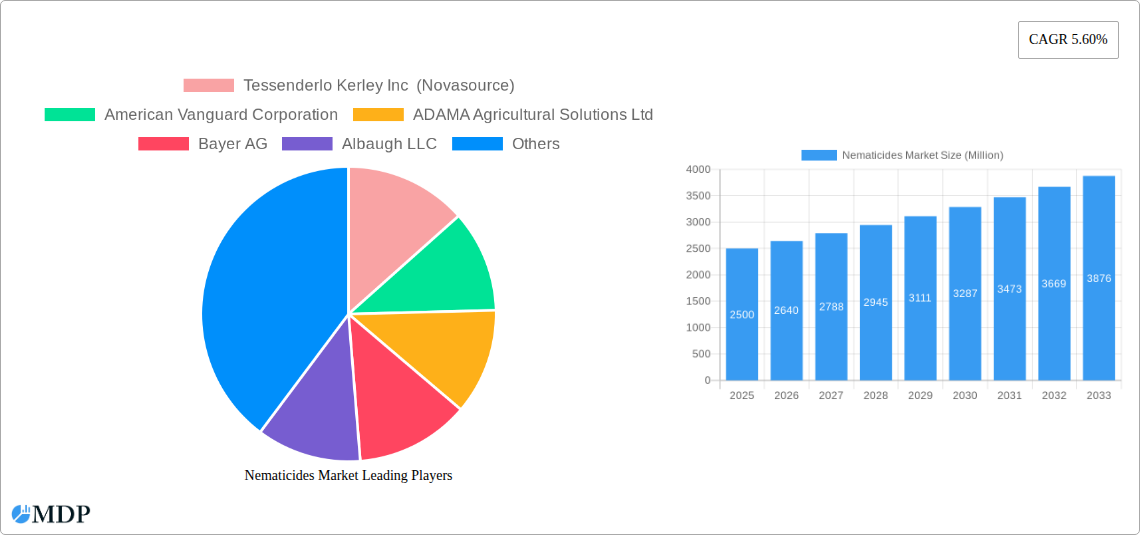
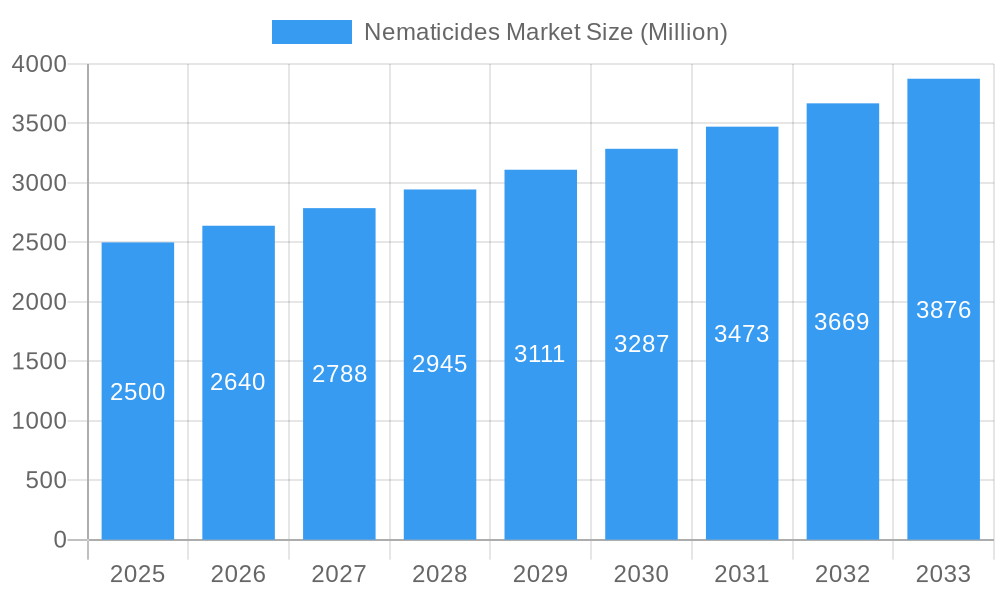
Nematicides Market Market Size (In Million)
The market features prominent players including Tessenderlo Kerley Inc (Novasource), American Vanguard Corporation, ADAMA Agricultural Solutions Ltd, Bayer AG, Albaugh LLC, Syngenta Group, UPL Limited, Corteva Agriscience, and Vive Crop Protection, all contributing to competitive dynamics and product innovation. Segmentation analysis indicates substantial demand across various crop types, with commercial crops and fruits & vegetables anticipated to command the largest market share due to their high economic value and susceptibility to nematode damage. Soil treatment is projected to be the dominant application method, owing to its efficacy in managing soil-borne nematodes. Regional market growth will vary, with areas characterized by intensive agricultural practices likely experiencing accelerated expansion. Despite existing restraints, the sustained emphasis on food security and the development of innovative, sustainable nematicides paint a positive market outlook, with projected growth potentially surpassing the current CAGR towards the latter part of the forecast period, fueled by the adoption of advanced technologies and enhanced pest management strategies.
Nematicides Market Company Market Share
Nematicides Market: A Comprehensive Analysis (2019-2033)
This comprehensive report provides a detailed analysis of the Nematicides Market, covering market dynamics, industry trends, leading segments, key players, and future growth opportunities. With a study period spanning 2019-2033, a base year of 2025, and a forecast period of 2025-2033, this report offers invaluable insights for stakeholders seeking to navigate this dynamic market. The market is projected to reach xx Million by 2033, exhibiting a CAGR of xx% during the forecast period.
Nematicides Market Market Dynamics & Concentration
The Nematicides market is characterized by a moderately concentrated landscape, with key players holding significant market share. Market concentration is influenced by factors such as economies of scale in production, extensive research and development capabilities, and strong distribution networks. The market share of the top five players is estimated at xx%. Innovation is a crucial driver, with companies constantly striving to develop more effective, environmentally friendly, and cost-efficient nematicides. Stringent regulatory frameworks, particularly concerning environmental impact and human health, significantly shape market dynamics. The emergence of bio-based nematicides presents a significant challenge to traditional chemical nematicides, offering a viable substitute in environmentally conscious markets. End-user trends, such as increasing adoption of sustainable agricultural practices and growing demand for high-yield crops, significantly impact market growth.
Mergers and acquisitions (M&A) have played a significant role in shaping the market landscape. Recent years have witnessed an increase in M&A activity, primarily driven by companies' efforts to expand their product portfolios, enhance their geographical reach, and gain access to new technologies.
- Market Share of Top 5 Players: xx%
- Number of M&A Deals (2019-2024): xx
- Key Innovation Drivers: Development of bio-based nematicides, improved formulation technologies, and targeted delivery systems.
- Regulatory Landscape: Stringent regulations concerning environmental impact and human health.
Nematicides Market Industry Trends & Analysis
The Nematicides market is experiencing robust growth, driven by several key factors. The increasing prevalence of nematode infestations in various crops is a major driver, necessitating the use of effective nematicides to protect crop yields. Technological advancements, such as the development of novel formulations and targeted delivery systems, are enhancing the efficacy and environmental profile of nematicides. Consumer preferences are shifting towards environmentally friendly and sustainable agricultural practices, which is fueling demand for bio-based nematicides. Competitive dynamics are intense, with companies investing heavily in research and development to differentiate their products and gain market share.
The market is witnessing significant technological disruptions, particularly with the introduction of bio-based nematicides and advanced application technologies. These innovations address concerns about the environmental impact of conventional chemical nematicides. Market penetration of bio-based nematicides is still relatively low, but it's projected to increase significantly in the coming years due to growing environmental awareness and favorable government regulations. The overall market growth is primarily driven by the growing demand for high-yield crops and the increasing awareness among farmers about the harmful effects of nematodes on crop production.
- Market Growth Drivers: Increasing nematode infestations, technological advancements, consumer preference for sustainable agriculture.
- CAGR (2025-2033): xx%
- Market Penetration of Bio-based Nematicides (2025): xx%
Leading Markets & Segments in Nematicides Market
The global Nematicides market is geographically diverse, with significant regional variations in market size and growth rate. While specific regional dominance requires further analysis based on precise data, various factors influence market dynamics across different geographical areas. Within application modes, soil treatment currently holds the largest market share due to its effectiveness in controlling nematodes in the soil. However, seed treatment is experiencing rapid growth due to its targeted application and reduced environmental impact. In terms of crop type, fruits and vegetables represent a substantial market segment, followed by grains & cereals and pulses & oilseeds. Turf & ornamental applications are also gaining traction.
- Key Drivers in Leading Regions/Segments: (Specific details pending further analysis) Examples include favorable government policies promoting sustainable agriculture, well-developed agricultural infrastructure, and high crop yields.
- Dominant Application Mode: Soil Treatment
- Fastest-Growing Application Mode: Seed Treatment
- Largest Crop Type Segment: Fruits & Vegetables
Nematicides Market Product Developments
Recent years have witnessed significant innovation in nematicide product development, with a notable focus on enhancing efficacy, reducing environmental impact, and improving application methods. Companies are developing novel formulations, such as nano-encapsulated nematicides, which improve efficacy and reduce environmental risks. Advancements in application technologies, such as precision application systems, contribute to more targeted treatments and reduced chemical usage. The market is also seeing a rise in bio-based nematicides derived from natural sources, offering a more sustainable alternative to chemical nematicides. These product innovations cater to evolving market needs and regulations, enhancing the overall market competitiveness.
Key Drivers of Nematicides Market Growth
Several factors are driving the growth of the nematicides market. The increasing prevalence of nematode infestations in agricultural fields and their detrimental effects on crop yields is a primary driver. Government regulations and initiatives promoting sustainable agricultural practices are encouraging the adoption of eco-friendly nematicides. Technological advancements in nematicide formulation and application methods are enhancing their effectiveness and reducing environmental impacts. Rising consumer demand for high-quality and safe agricultural produce fuels the need for effective nematode control.
Challenges in the Nematicides Market Market
The Nematicides market faces several challenges, including stringent regulations concerning the use of chemical nematicides, leading to limitations on the types of nematicides that can be used and increasing compliance costs. Supply chain disruptions can impact the availability and cost of nematicides, particularly during periods of economic uncertainty or geopolitical instability. Intense competition among established players and the emergence of new entrants present challenges in maintaining market share and profitability. The high cost of research and development for new nematicides also poses a significant hurdle.
Emerging Opportunities in Nematicides Market
The Nematicides market presents several promising opportunities. Technological breakthroughs in bio-pesticide development are creating new avenues for environmentally friendly pest management. Strategic partnerships between chemical and biotechnology companies are fostering innovation and market expansion. Expanding into new geographical markets with high nematode infestation rates and a growing demand for agricultural produce presents significant potential for market growth. Increased awareness of the economic losses caused by nematodes is driving demand for effective control solutions.
Leading Players in the Nematicides Market Sector
- Tessenderlo Kerley Inc (Novasource)
- American Vanguard Corporation
- ADAMA Agricultural Solutions Ltd
- Bayer AG
- Albaugh LLC
- Syngenta Group
- UPL Limited
- Corteva Agriscience
- Vive Crop Protection
Key Milestones in Nematicides Market Industry
- May 2022: Corteva Agriscience in Brazil expanded its portfolio, services, and industrial infrastructure to commercial partners, strengthening its seed treatment activities with new global brands LumiGEN and Ampl.
- June 2022: ADAMA Ltd acquired AgriNova New Zealand Ltd, expanding its product line in the New Zealand market.
- January 2023: Bayer partnered with Oerth Bio to enhance crop protection technology and create more eco-friendly solutions.
Strategic Outlook for Nematicides Market Market
The Nematicides market exhibits strong potential for future growth, driven by ongoing technological advancements, increasing awareness of sustainable agriculture, and the growing demand for food security globally. Strategic opportunities include focusing on the development and commercialization of bio-based nematicides, expanding into emerging markets, and forming strategic partnerships to enhance market reach and innovation. Companies that can effectively address the challenges of regulatory compliance, supply chain resilience, and intense competition will be well-positioned to capitalize on the market's significant growth potential.
Nematicides Market Segmentation
-
1. Application Mode
- 1.1. Chemigation
- 1.2. Foliar
- 1.3. Fumigation
- 1.4. Seed Treatment
- 1.5. Soil Treatment
-
2. Crop Type
- 2.1. Commercial Crops
- 2.2. Fruits & Vegetables
- 2.3. Grains & Cereals
- 2.4. Pulses & Oilseeds
- 2.5. Turf & Ornamental
-
3. Application Mode
- 3.1. Chemigation
- 3.2. Foliar
- 3.3. Fumigation
- 3.4. Seed Treatment
- 3.5. Soil Treatment
-
4. Crop Type
- 4.1. Commercial Crops
- 4.2. Fruits & Vegetables
- 4.3. Grains & Cereals
- 4.4. Pulses & Oilseeds
- 4.5. Turf & Ornamental
Nematicides Market Segmentation By Geography
-
1. North America
- 1.1. United States
- 1.2. Canada
- 1.3. Mexico
-
2. South America
- 2.1. Brazil
- 2.2. Argentina
- 2.3. Rest of South America
-
3. Europe
- 3.1. United Kingdom
- 3.2. Germany
- 3.3. France
- 3.4. Italy
- 3.5. Spain
- 3.6. Russia
- 3.7. Benelux
- 3.8. Nordics
- 3.9. Rest of Europe
-
4. Middle East & Africa
- 4.1. Turkey
- 4.2. Israel
- 4.3. GCC
- 4.4. North Africa
- 4.5. South Africa
- 4.6. Rest of Middle East & Africa
-
5. Asia Pacific
- 5.1. China
- 5.2. India
- 5.3. Japan
- 5.4. South Korea
- 5.5. ASEAN
- 5.6. Oceania
- 5.7. Rest of Asia Pacific
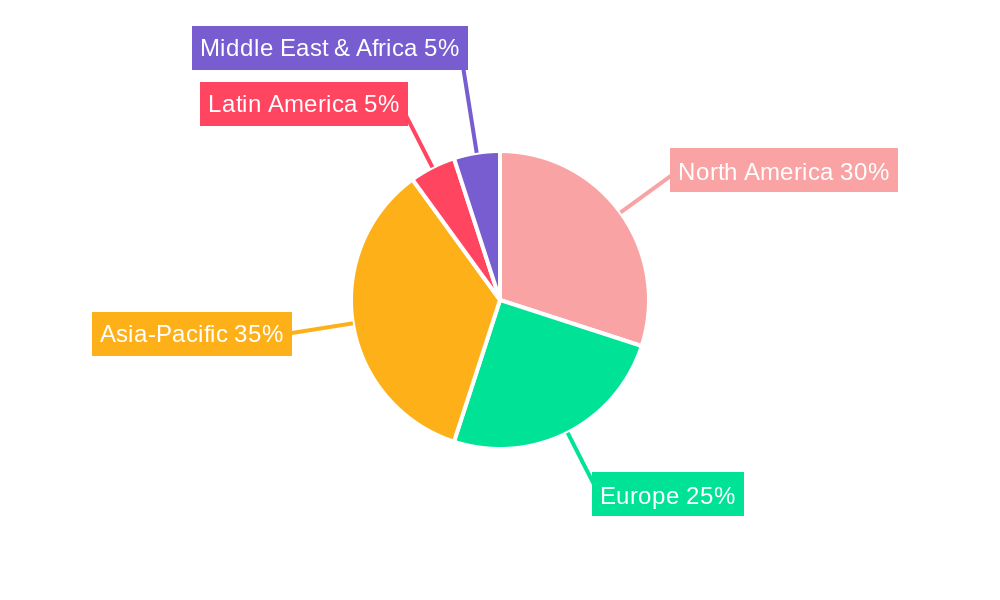
Nematicides Market Regional Market Share
Geographic Coverage of Nematicides Market
Nematicides Market REPORT HIGHLIGHTS
| Aspects | Details |
|---|---|
| Study Period | 2020-2034 |
| Base Year | 2025 |
| Estimated Year | 2026 |
| Forecast Period | 2026-2034 |
| Historical Period | 2020-2025 |
| Growth Rate | CAGR of 4.2% from 2020-2034 |
| Segmentation |
|
Table of Contents
- 1. Introduction
- 1.1. Research Scope
- 1.2. Market Segmentation
- 1.3. Research Objective
- 1.4. Definitions and Assumptions
- 2. Executive Summary
- 2.1. Market Snapshot
- 3. Market Dynamics
- 3.1. Market Drivers
- 3.2. Market Restrains
- 3.3. Market Trends
- 3.4. Market Opportunities
- 4. Market Factor Analysis
- 4.1. Porters Five Forces
- 4.1.1. Bargaining Power of Suppliers
- 4.1.2. Bargaining Power of Buyers
- 4.1.3. Threat of New Entrants
- 4.1.4. Threat of Substitutes
- 4.1.5. Competitive Rivalry
- 4.2. PESTEL analysis
- 4.3. BCG Analysis
- 4.3.1. Stars (High Growth, High Market Share)
- 4.3.2. Cash Cows (Low Growth, High Market Share)
- 4.3.3. Question Mark (High Growth, Low Market Share)
- 4.3.4. Dogs (Low Growth, Low Market Share)
- 4.4. Ansoff Matrix Analysis
- 4.5. Supply Chain Analysis
- 4.6. Regulatory Landscape
- 4.7. Current Market Potential and Opportunity Assessment (TAM–SAM–SOM Framework)
- 4.8. MDP Analyst Note
- 4.1. Porters Five Forces
- 5. Market Analysis, Insights and Forecast 2021-2033
- 5.1. Market Analysis, Insights and Forecast - by Application Mode
- 5.1.1. Chemigation
- 5.1.2. Foliar
- 5.1.3. Fumigation
- 5.1.4. Seed Treatment
- 5.1.5. Soil Treatment
- 5.2. Market Analysis, Insights and Forecast - by Crop Type
- 5.2.1. Commercial Crops
- 5.2.2. Fruits & Vegetables
- 5.2.3. Grains & Cereals
- 5.2.4. Pulses & Oilseeds
- 5.2.5. Turf & Ornamental
- 5.3. Market Analysis, Insights and Forecast - by Application Mode
- 5.3.1. Chemigation
- 5.3.2. Foliar
- 5.3.3. Fumigation
- 5.3.4. Seed Treatment
- 5.3.5. Soil Treatment
- 5.4. Market Analysis, Insights and Forecast - by Crop Type
- 5.4.1. Commercial Crops
- 5.4.2. Fruits & Vegetables
- 5.4.3. Grains & Cereals
- 5.4.4. Pulses & Oilseeds
- 5.4.5. Turf & Ornamental
- 5.5. Market Analysis, Insights and Forecast - by Region
- 5.5.1. North America
- 5.5.2. South America
- 5.5.3. Europe
- 5.5.4. Middle East & Africa
- 5.5.5. Asia Pacific
- 5.1. Market Analysis, Insights and Forecast - by Application Mode
- 6. Global Nematicides Market Analysis, Insights and Forecast, 2021-2033
- 6.1. Market Analysis, Insights and Forecast - by Application Mode
- 6.1.1. Chemigation
- 6.1.2. Foliar
- 6.1.3. Fumigation
- 6.1.4. Seed Treatment
- 6.1.5. Soil Treatment
- 6.2. Market Analysis, Insights and Forecast - by Crop Type
- 6.2.1. Commercial Crops
- 6.2.2. Fruits & Vegetables
- 6.2.3. Grains & Cereals
- 6.2.4. Pulses & Oilseeds
- 6.2.5. Turf & Ornamental
- 6.3. Market Analysis, Insights and Forecast - by Application Mode
- 6.3.1. Chemigation
- 6.3.2. Foliar
- 6.3.3. Fumigation
- 6.3.4. Seed Treatment
- 6.3.5. Soil Treatment
- 6.4. Market Analysis, Insights and Forecast - by Crop Type
- 6.4.1. Commercial Crops
- 6.4.2. Fruits & Vegetables
- 6.4.3. Grains & Cereals
- 6.4.4. Pulses & Oilseeds
- 6.4.5. Turf & Ornamental
- 6.1. Market Analysis, Insights and Forecast - by Application Mode
- 7. North America Nematicides Market Analysis, Insights and Forecast, 2020-2032
- 7.1. Market Analysis, Insights and Forecast - by Application Mode
- 7.1.1. Chemigation
- 7.1.2. Foliar
- 7.1.3. Fumigation
- 7.1.4. Seed Treatment
- 7.1.5. Soil Treatment
- 7.2. Market Analysis, Insights and Forecast - by Crop Type
- 7.2.1. Commercial Crops
- 7.2.2. Fruits & Vegetables
- 7.2.3. Grains & Cereals
- 7.2.4. Pulses & Oilseeds
- 7.2.5. Turf & Ornamental
- 7.3. Market Analysis, Insights and Forecast - by Application Mode
- 7.3.1. Chemigation
- 7.3.2. Foliar
- 7.3.3. Fumigation
- 7.3.4. Seed Treatment
- 7.3.5. Soil Treatment
- 7.4. Market Analysis, Insights and Forecast - by Crop Type
- 7.4.1. Commercial Crops
- 7.4.2. Fruits & Vegetables
- 7.4.3. Grains & Cereals
- 7.4.4. Pulses & Oilseeds
- 7.4.5. Turf & Ornamental
- 7.1. Market Analysis, Insights and Forecast - by Application Mode
- 8. South America Nematicides Market Analysis, Insights and Forecast, 2020-2032
- 8.1. Market Analysis, Insights and Forecast - by Application Mode
- 8.1.1. Chemigation
- 8.1.2. Foliar
- 8.1.3. Fumigation
- 8.1.4. Seed Treatment
- 8.1.5. Soil Treatment
- 8.2. Market Analysis, Insights and Forecast - by Crop Type
- 8.2.1. Commercial Crops
- 8.2.2. Fruits & Vegetables
- 8.2.3. Grains & Cereals
- 8.2.4. Pulses & Oilseeds
- 8.2.5. Turf & Ornamental
- 8.3. Market Analysis, Insights and Forecast - by Application Mode
- 8.3.1. Chemigation
- 8.3.2. Foliar
- 8.3.3. Fumigation
- 8.3.4. Seed Treatment
- 8.3.5. Soil Treatment
- 8.4. Market Analysis, Insights and Forecast - by Crop Type
- 8.4.1. Commercial Crops
- 8.4.2. Fruits & Vegetables
- 8.4.3. Grains & Cereals
- 8.4.4. Pulses & Oilseeds
- 8.4.5. Turf & Ornamental
- 8.1. Market Analysis, Insights and Forecast - by Application Mode
- 9. Europe Nematicides Market Analysis, Insights and Forecast, 2020-2032
- 9.1. Market Analysis, Insights and Forecast - by Application Mode
- 9.1.1. Chemigation
- 9.1.2. Foliar
- 9.1.3. Fumigation
- 9.1.4. Seed Treatment
- 9.1.5. Soil Treatment
- 9.2. Market Analysis, Insights and Forecast - by Crop Type
- 9.2.1. Commercial Crops
- 9.2.2. Fruits & Vegetables
- 9.2.3. Grains & Cereals
- 9.2.4. Pulses & Oilseeds
- 9.2.5. Turf & Ornamental
- 9.3. Market Analysis, Insights and Forecast - by Application Mode
- 9.3.1. Chemigation
- 9.3.2. Foliar
- 9.3.3. Fumigation
- 9.3.4. Seed Treatment
- 9.3.5. Soil Treatment
- 9.4. Market Analysis, Insights and Forecast - by Crop Type
- 9.4.1. Commercial Crops
- 9.4.2. Fruits & Vegetables
- 9.4.3. Grains & Cereals
- 9.4.4. Pulses & Oilseeds
- 9.4.5. Turf & Ornamental
- 9.1. Market Analysis, Insights and Forecast - by Application Mode
- 10. Middle East & Africa Nematicides Market Analysis, Insights and Forecast, 2020-2032
- 10.1. Market Analysis, Insights and Forecast - by Application Mode
- 10.1.1. Chemigation
- 10.1.2. Foliar
- 10.1.3. Fumigation
- 10.1.4. Seed Treatment
- 10.1.5. Soil Treatment
- 10.2. Market Analysis, Insights and Forecast - by Crop Type
- 10.2.1. Commercial Crops
- 10.2.2. Fruits & Vegetables
- 10.2.3. Grains & Cereals
- 10.2.4. Pulses & Oilseeds
- 10.2.5. Turf & Ornamental
- 10.3. Market Analysis, Insights and Forecast - by Application Mode
- 10.3.1. Chemigation
- 10.3.2. Foliar
- 10.3.3. Fumigation
- 10.3.4. Seed Treatment
- 10.3.5. Soil Treatment
- 10.4. Market Analysis, Insights and Forecast - by Crop Type
- 10.4.1. Commercial Crops
- 10.4.2. Fruits & Vegetables
- 10.4.3. Grains & Cereals
- 10.4.4. Pulses & Oilseeds
- 10.4.5. Turf & Ornamental
- 10.1. Market Analysis, Insights and Forecast - by Application Mode
- 11. Asia Pacific Nematicides Market Analysis, Insights and Forecast, 2020-2032
- 11.1. Market Analysis, Insights and Forecast - by Application Mode
- 11.1.1. Chemigation
- 11.1.2. Foliar
- 11.1.3. Fumigation
- 11.1.4. Seed Treatment
- 11.1.5. Soil Treatment
- 11.2. Market Analysis, Insights and Forecast - by Crop Type
- 11.2.1. Commercial Crops
- 11.2.2. Fruits & Vegetables
- 11.2.3. Grains & Cereals
- 11.2.4. Pulses & Oilseeds
- 11.2.5. Turf & Ornamental
- 11.3. Market Analysis, Insights and Forecast - by Application Mode
- 11.3.1. Chemigation
- 11.3.2. Foliar
- 11.3.3. Fumigation
- 11.3.4. Seed Treatment
- 11.3.5. Soil Treatment
- 11.4. Market Analysis, Insights and Forecast - by Crop Type
- 11.4.1. Commercial Crops
- 11.4.2. Fruits & Vegetables
- 11.4.3. Grains & Cereals
- 11.4.4. Pulses & Oilseeds
- 11.4.5. Turf & Ornamental
- 11.1. Market Analysis, Insights and Forecast - by Application Mode
- 12. Competitive Analysis
- 12.1. Company Profiles
- 12.1.1 Tessenderlo Kerley Inc (Novasource)
- 12.1.1.1. Company Overview
- 12.1.1.2. Products
- 12.1.1.3. Company Financials
- 12.1.1.4. SWOT Analysis
- 12.1.2 American Vanguard Corporation
- 12.1.2.1. Company Overview
- 12.1.2.2. Products
- 12.1.2.3. Company Financials
- 12.1.2.4. SWOT Analysis
- 12.1.3 ADAMA Agricultural Solutions Ltd
- 12.1.3.1. Company Overview
- 12.1.3.2. Products
- 12.1.3.3. Company Financials
- 12.1.3.4. SWOT Analysis
- 12.1.4 Bayer AG
- 12.1.4.1. Company Overview
- 12.1.4.2. Products
- 12.1.4.3. Company Financials
- 12.1.4.4. SWOT Analysis
- 12.1.5 Albaugh LLC
- 12.1.5.1. Company Overview
- 12.1.5.2. Products
- 12.1.5.3. Company Financials
- 12.1.5.4. SWOT Analysis
- 12.1.6 Syngenta Group
- 12.1.6.1. Company Overview
- 12.1.6.2. Products
- 12.1.6.3. Company Financials
- 12.1.6.4. SWOT Analysis
- 12.1.7 Upl Limited
- 12.1.7.1. Company Overview
- 12.1.7.2. Products
- 12.1.7.3. Company Financials
- 12.1.7.4. SWOT Analysis
- 12.1.8 Corteva Agriscience
- 12.1.8.1. Company Overview
- 12.1.8.2. Products
- 12.1.8.3. Company Financials
- 12.1.8.4. SWOT Analysis
- 12.1.9 Vive Crop Protectio
- 12.1.9.1. Company Overview
- 12.1.9.2. Products
- 12.1.9.3. Company Financials
- 12.1.9.4. SWOT Analysis
- 12.1.1 Tessenderlo Kerley Inc (Novasource)
- 12.2. Market Entropy
- 12.2.1 Company's Key Areas Served
- 12.2.2 Recent Developments
- 12.3. Company Market Share Analysis 2025
- 12.3.1 Top 5 Companies Market Share Analysis
- 12.3.2 Top 3 Companies Market Share Analysis
- 12.4. List of Potential Customers
- 13. Research Methodology
List of Figures
- Figure 1: Global Nematicides Market Revenue Breakdown (million, %) by Region 2025 & 2033
- Figure 2: North America Nematicides Market Revenue (million), by Application Mode 2025 & 2033
- Figure 3: North America Nematicides Market Revenue Share (%), by Application Mode 2025 & 2033
- Figure 4: North America Nematicides Market Revenue (million), by Crop Type 2025 & 2033
- Figure 5: North America Nematicides Market Revenue Share (%), by Crop Type 2025 & 2033
- Figure 6: North America Nematicides Market Revenue (million), by Application Mode 2025 & 2033
- Figure 7: North America Nematicides Market Revenue Share (%), by Application Mode 2025 & 2033
- Figure 8: North America Nematicides Market Revenue (million), by Crop Type 2025 & 2033
- Figure 9: North America Nematicides Market Revenue Share (%), by Crop Type 2025 & 2033
- Figure 10: North America Nematicides Market Revenue (million), by Country 2025 & 2033
- Figure 11: North America Nematicides Market Revenue Share (%), by Country 2025 & 2033
- Figure 12: South America Nematicides Market Revenue (million), by Application Mode 2025 & 2033
- Figure 13: South America Nematicides Market Revenue Share (%), by Application Mode 2025 & 2033
- Figure 14: South America Nematicides Market Revenue (million), by Crop Type 2025 & 2033
- Figure 15: South America Nematicides Market Revenue Share (%), by Crop Type 2025 & 2033
- Figure 16: South America Nematicides Market Revenue (million), by Application Mode 2025 & 2033
- Figure 17: South America Nematicides Market Revenue Share (%), by Application Mode 2025 & 2033
- Figure 18: South America Nematicides Market Revenue (million), by Crop Type 2025 & 2033
- Figure 19: South America Nematicides Market Revenue Share (%), by Crop Type 2025 & 2033
- Figure 20: South America Nematicides Market Revenue (million), by Country 2025 & 2033
- Figure 21: South America Nematicides Market Revenue Share (%), by Country 2025 & 2033
- Figure 22: Europe Nematicides Market Revenue (million), by Application Mode 2025 & 2033
- Figure 23: Europe Nematicides Market Revenue Share (%), by Application Mode 2025 & 2033
- Figure 24: Europe Nematicides Market Revenue (million), by Crop Type 2025 & 2033
- Figure 25: Europe Nematicides Market Revenue Share (%), by Crop Type 2025 & 2033
- Figure 26: Europe Nematicides Market Revenue (million), by Application Mode 2025 & 2033
- Figure 27: Europe Nematicides Market Revenue Share (%), by Application Mode 2025 & 2033
- Figure 28: Europe Nematicides Market Revenue (million), by Crop Type 2025 & 2033
- Figure 29: Europe Nematicides Market Revenue Share (%), by Crop Type 2025 & 2033
- Figure 30: Europe Nematicides Market Revenue (million), by Country 2025 & 2033
- Figure 31: Europe Nematicides Market Revenue Share (%), by Country 2025 & 2033
- Figure 32: Middle East & Africa Nematicides Market Revenue (million), by Application Mode 2025 & 2033
- Figure 33: Middle East & Africa Nematicides Market Revenue Share (%), by Application Mode 2025 & 2033
- Figure 34: Middle East & Africa Nematicides Market Revenue (million), by Crop Type 2025 & 2033
- Figure 35: Middle East & Africa Nematicides Market Revenue Share (%), by Crop Type 2025 & 2033
- Figure 36: Middle East & Africa Nematicides Market Revenue (million), by Application Mode 2025 & 2033
- Figure 37: Middle East & Africa Nematicides Market Revenue Share (%), by Application Mode 2025 & 2033
- Figure 38: Middle East & Africa Nematicides Market Revenue (million), by Crop Type 2025 & 2033
- Figure 39: Middle East & Africa Nematicides Market Revenue Share (%), by Crop Type 2025 & 2033
- Figure 40: Middle East & Africa Nematicides Market Revenue (million), by Country 2025 & 2033
- Figure 41: Middle East & Africa Nematicides Market Revenue Share (%), by Country 2025 & 2033
- Figure 42: Asia Pacific Nematicides Market Revenue (million), by Application Mode 2025 & 2033
- Figure 43: Asia Pacific Nematicides Market Revenue Share (%), by Application Mode 2025 & 2033
- Figure 44: Asia Pacific Nematicides Market Revenue (million), by Crop Type 2025 & 2033
- Figure 45: Asia Pacific Nematicides Market Revenue Share (%), by Crop Type 2025 & 2033
- Figure 46: Asia Pacific Nematicides Market Revenue (million), by Application Mode 2025 & 2033
- Figure 47: Asia Pacific Nematicides Market Revenue Share (%), by Application Mode 2025 & 2033
- Figure 48: Asia Pacific Nematicides Market Revenue (million), by Crop Type 2025 & 2033
- Figure 49: Asia Pacific Nematicides Market Revenue Share (%), by Crop Type 2025 & 2033
- Figure 50: Asia Pacific Nematicides Market Revenue (million), by Country 2025 & 2033
- Figure 51: Asia Pacific Nematicides Market Revenue Share (%), by Country 2025 & 2033
List of Tables
- Table 1: Global Nematicides Market Revenue million Forecast, by Application Mode 2020 & 2033
- Table 2: Global Nematicides Market Revenue million Forecast, by Crop Type 2020 & 2033
- Table 3: Global Nematicides Market Revenue million Forecast, by Application Mode 2020 & 2033
- Table 4: Global Nematicides Market Revenue million Forecast, by Crop Type 2020 & 2033
- Table 5: Global Nematicides Market Revenue million Forecast, by Region 2020 & 2033
- Table 6: Global Nematicides Market Revenue million Forecast, by Application Mode 2020 & 2033
- Table 7: Global Nematicides Market Revenue million Forecast, by Crop Type 2020 & 2033
- Table 8: Global Nematicides Market Revenue million Forecast, by Application Mode 2020 & 2033
- Table 9: Global Nematicides Market Revenue million Forecast, by Crop Type 2020 & 2033
- Table 10: Global Nematicides Market Revenue million Forecast, by Country 2020 & 2033
- Table 11: United States Nematicides Market Revenue (million) Forecast, by Application 2020 & 2033
- Table 12: Canada Nematicides Market Revenue (million) Forecast, by Application 2020 & 2033
- Table 13: Mexico Nematicides Market Revenue (million) Forecast, by Application 2020 & 2033
- Table 14: Global Nematicides Market Revenue million Forecast, by Application Mode 2020 & 2033
- Table 15: Global Nematicides Market Revenue million Forecast, by Crop Type 2020 & 2033
- Table 16: Global Nematicides Market Revenue million Forecast, by Application Mode 2020 & 2033
- Table 17: Global Nematicides Market Revenue million Forecast, by Crop Type 2020 & 2033
- Table 18: Global Nematicides Market Revenue million Forecast, by Country 2020 & 2033
- Table 19: Brazil Nematicides Market Revenue (million) Forecast, by Application 2020 & 2033
- Table 20: Argentina Nematicides Market Revenue (million) Forecast, by Application 2020 & 2033
- Table 21: Rest of South America Nematicides Market Revenue (million) Forecast, by Application 2020 & 2033
- Table 22: Global Nematicides Market Revenue million Forecast, by Application Mode 2020 & 2033
- Table 23: Global Nematicides Market Revenue million Forecast, by Crop Type 2020 & 2033
- Table 24: Global Nematicides Market Revenue million Forecast, by Application Mode 2020 & 2033
- Table 25: Global Nematicides Market Revenue million Forecast, by Crop Type 2020 & 2033
- Table 26: Global Nematicides Market Revenue million Forecast, by Country 2020 & 2033
- Table 27: United Kingdom Nematicides Market Revenue (million) Forecast, by Application 2020 & 2033
- Table 28: Germany Nematicides Market Revenue (million) Forecast, by Application 2020 & 2033
- Table 29: France Nematicides Market Revenue (million) Forecast, by Application 2020 & 2033
- Table 30: Italy Nematicides Market Revenue (million) Forecast, by Application 2020 & 2033
- Table 31: Spain Nematicides Market Revenue (million) Forecast, by Application 2020 & 2033
- Table 32: Russia Nematicides Market Revenue (million) Forecast, by Application 2020 & 2033
- Table 33: Benelux Nematicides Market Revenue (million) Forecast, by Application 2020 & 2033
- Table 34: Nordics Nematicides Market Revenue (million) Forecast, by Application 2020 & 2033
- Table 35: Rest of Europe Nematicides Market Revenue (million) Forecast, by Application 2020 & 2033
- Table 36: Global Nematicides Market Revenue million Forecast, by Application Mode 2020 & 2033
- Table 37: Global Nematicides Market Revenue million Forecast, by Crop Type 2020 & 2033
- Table 38: Global Nematicides Market Revenue million Forecast, by Application Mode 2020 & 2033
- Table 39: Global Nematicides Market Revenue million Forecast, by Crop Type 2020 & 2033
- Table 40: Global Nematicides Market Revenue million Forecast, by Country 2020 & 2033
- Table 41: Turkey Nematicides Market Revenue (million) Forecast, by Application 2020 & 2033
- Table 42: Israel Nematicides Market Revenue (million) Forecast, by Application 2020 & 2033
- Table 43: GCC Nematicides Market Revenue (million) Forecast, by Application 2020 & 2033
- Table 44: North Africa Nematicides Market Revenue (million) Forecast, by Application 2020 & 2033
- Table 45: South Africa Nematicides Market Revenue (million) Forecast, by Application 2020 & 2033
- Table 46: Rest of Middle East & Africa Nematicides Market Revenue (million) Forecast, by Application 2020 & 2033
- Table 47: Global Nematicides Market Revenue million Forecast, by Application Mode 2020 & 2033
- Table 48: Global Nematicides Market Revenue million Forecast, by Crop Type 2020 & 2033
- Table 49: Global Nematicides Market Revenue million Forecast, by Application Mode 2020 & 2033
- Table 50: Global Nematicides Market Revenue million Forecast, by Crop Type 2020 & 2033
- Table 51: Global Nematicides Market Revenue million Forecast, by Country 2020 & 2033
- Table 52: China Nematicides Market Revenue (million) Forecast, by Application 2020 & 2033
- Table 53: India Nematicides Market Revenue (million) Forecast, by Application 2020 & 2033
- Table 54: Japan Nematicides Market Revenue (million) Forecast, by Application 2020 & 2033
- Table 55: South Korea Nematicides Market Revenue (million) Forecast, by Application 2020 & 2033
- Table 56: ASEAN Nematicides Market Revenue (million) Forecast, by Application 2020 & 2033
- Table 57: Oceania Nematicides Market Revenue (million) Forecast, by Application 2020 & 2033
- Table 58: Rest of Asia Pacific Nematicides Market Revenue (million) Forecast, by Application 2020 & 2033
Frequently Asked Questions
1. What is the projected Compound Annual Growth Rate (CAGR) of the Nematicides Market?
The projected CAGR is approximately 4.2%.
2. Which companies are prominent players in the Nematicides Market?
Key companies in the market include Tessenderlo Kerley Inc (Novasource), American Vanguard Corporation, ADAMA Agricultural Solutions Ltd, Bayer AG, Albaugh LLC, Syngenta Group, Upl Limited, Corteva Agriscience, Vive Crop Protectio.
3. What are the main segments of the Nematicides Market?
The market segments include Application Mode, Crop Type, Application Mode, Crop Type.
4. Can you provide details about the market size?
The market size is estimated to be USD 289.36 million as of 2022.
5. What are some drivers contributing to market growth?
Seed Treatment As A Solution To Enhance Yield; Growing Awareness For Seed Treatment Among The Farmers; Rising Trend Of Organic Farming.
6. What are the notable trends driving market growth?
Increased nematode infestations and the growing adoption of nematicides stood South America in prominent position.
7. Are there any restraints impacting market growth?
Limitations Across Farm-Level Seed Treatment; Rising Environmental Concerns.
8. Can you provide examples of recent developments in the market?
January 2023: Bayer formed a new partnership with Oerth Bio to enhance crop protection technology and create more eco-friendly crop protection solutions.June 2022: AgriNova New Zealand Ltd was acquired by ADAMA Ltd. With this acquisition, ADAMA expanded its product line in the New Zealand market.May 2022: Corteva Agriscience in Brazil expanded its portfolio, services, and industrial infrastructure to commercial partners to strengthen its activities in the seed treatment industry. For instance, the company strengthened its operations in the area of seed treatment with the new global brands LumiGEN and Ampl.
9. What pricing options are available for accessing the report?
Pricing options include single-user, multi-user, and enterprise licenses priced at USD 3800, USD 4500, and USD 5800 respectively.
10. Is the market size provided in terms of value or volume?
The market size is provided in terms of value, measured in million.
11. Are there any specific market keywords associated with the report?
Yes, the market keyword associated with the report is "Nematicides Market," which aids in identifying and referencing the specific market segment covered.
12. How do I determine which pricing option suits my needs best?
The pricing options vary based on user requirements and access needs. Individual users may opt for single-user licenses, while businesses requiring broader access may choose multi-user or enterprise licenses for cost-effective access to the report.
13. Are there any additional resources or data provided in the Nematicides Market report?
While the report offers comprehensive insights, it's advisable to review the specific contents or supplementary materials provided to ascertain if additional resources or data are available.
14. How can I stay updated on further developments or reports in the Nematicides Market?
To stay informed about further developments, trends, and reports in the Nematicides Market, consider subscribing to industry newsletters, following relevant companies and organizations, or regularly checking reputable industry news sources and publications.
Methodology
Step 1 - Identification of Relevant Samples Size from Population Database


Step 2 - Approaches for Defining Global Market Size (Value, Volume* & Price*)

Note*: In applicable scenarios
Step 3 - Data Sources
Primary Research
- Web Analytics
- Survey Reports
- Research Institute
- Latest Research Reports
- Opinion Leaders
Secondary Research
- Annual Reports
- White Paper
- Latest Press Release
- Industry Association
- Paid Database
- Investor Presentations

Step 4 - Data Triangulation
Involves using different sources of information in order to increase the validity of a study
These sources are likely to be stakeholders in a program - participants, other researchers, program staff, other community members, and so on.
Then we put all data in single framework & apply various statistical tools to find out the dynamic on the market.
During the analysis stage, feedback from the stakeholder groups would be compared to determine areas of agreement as well as areas of divergence