

Key Insights
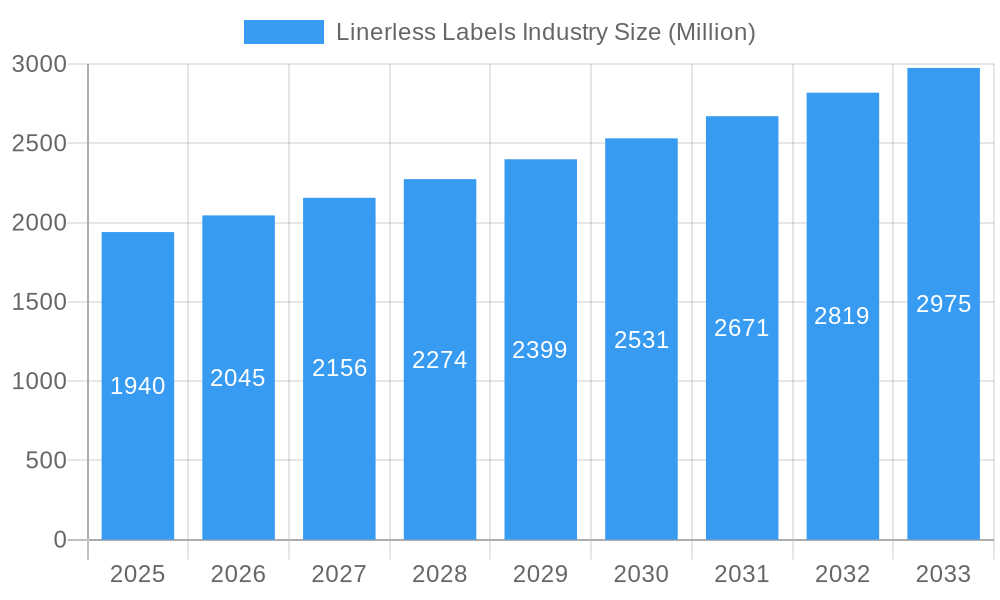
The linerless label market, valued at $1.94 billion in 2025, is projected to experience robust growth, driven by increasing demand for sustainable packaging solutions across diverse sectors. The compound annual growth rate (CAGR) of 5.28% from 2025 to 2033 indicates a significant expansion of this market. Key drivers include the growing consumer preference for eco-friendly products, reducing waste and minimizing environmental impact. The shift towards e-commerce and the resulting need for efficient and cost-effective labeling further fuels market growth. The food and beverage industry, a major end-user, is adopting linerless labels to enhance product appeal and streamline packaging processes. Technological advancements in printing techniques, particularly digital printing, are enabling greater customization and faster turnaround times, contributing to market expansion. While potential restraints such as initial investment costs for new equipment and the need for specialized adhesive technologies exist, the overall market outlook remains positive. Segmentation by end-user industry (food, beverage, healthcare, cosmetics, etc.) and printing technology (gravure, flexography, digital) provides detailed insights into market dynamics and growth opportunities across various segments. The market's geographical distribution shows significant growth potential across regions like Asia-Pacific, fueled by rising consumer spending and expanding manufacturing sectors.
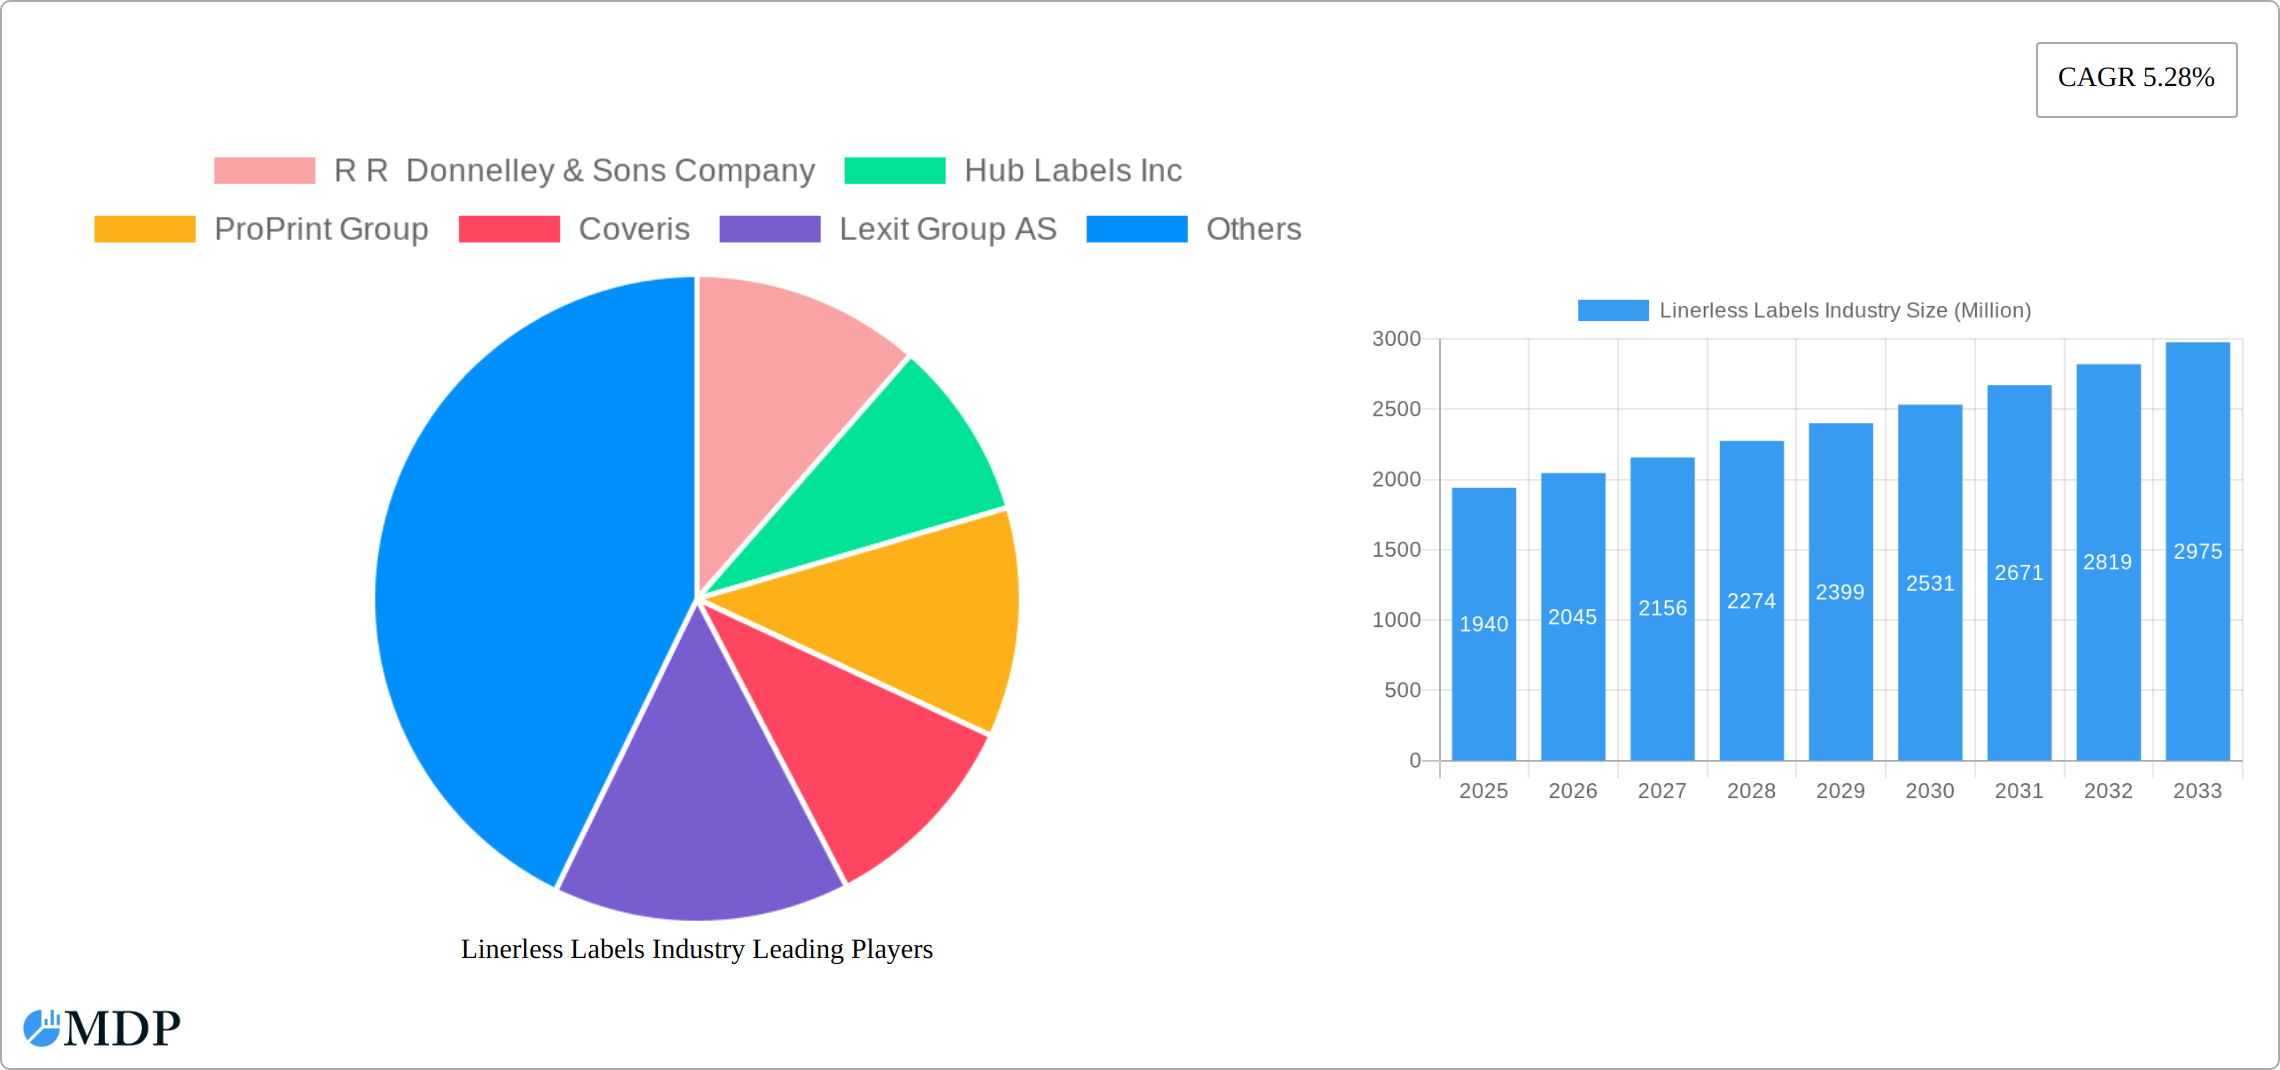
Linerless Labels Industry Market Size (In Billion)
The competitive landscape is characterized by a mix of large multinational corporations and specialized regional players. Companies like R R Donnelley & Sons Company, Hub Labels Inc., and others are actively investing in research and development to enhance their linerless label offerings. Strategic partnerships and collaborations are also emerging, aimed at providing comprehensive solutions that cater to specific industry needs. The continued focus on sustainability, coupled with technological advancements and evolving consumer preferences, positions the linerless label market for considerable future expansion. The market is expected to see innovation in material science, leading to improved adhesive performance and recyclability, further strengthening the market's growth trajectory. Regional variations in adoption rates and regulatory landscapes will influence market growth within individual geographical areas.
Linerless Labels Industry Company Market Share
Linerless Labels Industry: A Comprehensive Market Report (2019-2033)
This comprehensive report provides a detailed analysis of the Linerless Labels industry, encompassing market dynamics, trends, leading players, and future growth prospects. With a study period spanning 2019-2033, a base year of 2025, and a forecast period of 2025-2033, this report is an indispensable resource for industry stakeholders, investors, and strategic decision-makers. The report leverages extensive data analysis to deliver actionable insights into a multi-million dollar market poised for significant expansion.
Linerless Labels Industry Market Dynamics & Concentration
The global linerless labels market, valued at $XX million in 2024, is experiencing robust growth, driven by increasing demand across various end-use sectors. Market concentration is moderate, with several major players holding significant market share. However, the entry of innovative startups and the expansion of existing players are reshaping the competitive landscape. Innovation in printing technologies, particularly the adoption of digital printing, is a key growth driver. Regulatory frameworks concerning sustainability and waste reduction are influencing material choices and manufacturing processes. The rise of eco-friendly alternatives to traditional labels is creating substitution opportunities within the market. Furthermore, evolving end-user preferences for convenient and sustainable packaging solutions are boosting the demand for linerless labels. M&A activity in the sector has been steady, with approximately XX deals recorded between 2019 and 2024. Key mergers and acquisitions include:
- Strategic partnerships for distribution expansion (e.g., Lexit Group's partnership with Markem-Imaje).
- Investments in advanced printing and coating technologies (e.g., ProPrint Group's EUR 1 million investment).
- Consolidation amongst smaller players to increase market share.
These activities are indicative of a market striving for consolidation and enhanced technological capabilities. The projected market share for the top five players in 2025 is estimated at XX%.
Linerless Labels Industry Industry Trends & Analysis
The linerless labels market demonstrates a robust Compound Annual Growth Rate (CAGR) of XX% during the forecast period (2025-2033). This growth is fueled by several key factors. The growing preference for sustainable packaging solutions is driving a shift away from traditional pressure-sensitive labels. The increasing adoption of e-commerce and the need for efficient and cost-effective labeling solutions also contribute to the market's expansion. Technological advancements in printing technologies, such as digital printing, are enabling the creation of highly customized and personalized labels. Additionally, the rising demand for labels in the food, beverage, and healthcare sectors are significant contributors to overall market growth. Market penetration of linerless labels is expected to reach XX% by 2033, surpassing traditional label alternatives in several key markets. Competitive dynamics are largely driven by innovation in materials, printing technologies, and cost-efficiency. The focus is shifting towards eco-friendly materials and the development of next-generation linerless label substrates.
Leading Markets & Segments in Linerless Labels Industry
The global linerless labels market is experiencing robust expansion, with North America currently leading the charge, closely followed by dynamic growth in Europe and the rapidly emerging Asia-Pacific region. The specific drivers of this growth are tailored to the unique demands and regulatory landscapes within these key markets:
By End-User Industry:
- Food & Beverage: This sector is a primary beneficiary, driven by the escalating consumer preference for sustainable and eco-friendly packaging solutions. The demand for convenient, spill-resistant, and information-rich labels that meet stringent food safety and regulatory standards further accelerates adoption. Innovations in resealable and tamper-evident features also contribute significantly.
- Healthcare: The critical need for secure, tamper-evident, and compliant labeling in pharmaceuticals and medical devices fuels growth. Linerless labels offer enhanced security features, improved traceability, and the ability to withstand harsh sterilization processes, making them indispensable for patient safety and regulatory adherence.
- Cosmetics & Household: The pursuit of premium aesthetics and personalized branding in the cosmetics and household product sectors is a significant growth catalyst. Linerless labels allow for high-quality graphics, intricate designs, and unique finishes, enhancing shelf appeal and brand differentiation.
- Logistics & E-commerce: The exponential growth of e-commerce and the increasing complexity of global supply chains are creating a substantial demand for efficient and trackable packaging. Linerless labels facilitate faster application, reduce waste, and provide superior print clarity for barcodes and shipping information, optimizing operational efficiency.
By Printing Technology:
- Flexography: Remains a cornerstone of linerless label production, prized for its cost-effectiveness, high-volume output capabilities, and proven reliability across a wide spectrum of materials and applications.
- Digital Printing: Is experiencing a rapid ascent, revolutionizing the market with its unparalleled flexibility for short-run production, on-demand customization, and vibrant, high-resolution graphics. This technology is crucial for meeting the evolving needs of brand owners seeking personalized and dynamic labeling solutions.
The regional dominance observed is a result of a confluence of factors, including supportive government initiatives promoting sustainable manufacturing and packaging, highly developed industrial infrastructures that facilitate efficient production and distribution networks, and a discerning consumer base that actively seeks innovative and environmentally responsible product packaging.
Linerless Labels Industry Product Developments
The landscape of linerless labels is continuously being shaped by groundbreaking product innovations. A key focus is on enhancing material science, leading to the development of adhesives with superior tack, repositionability, and residue-free removal, ensuring optimal performance across diverse substrates and application conditions. Simultaneously, there is a significant push towards incorporating recycled and renewable materials, aligning with global sustainability mandates and consumer expectations for eco-conscious products. Advancements in printing technologies are enabling higher print resolutions, exceptional color vibrancy, and improved label durability, including resistance to environmental factors like UV light and moisture. These innovations are not only catering to the evolving market needs for enhanced performance and sustainability but are also addressing the critical requirement for cost-effectiveness. The market is also witnessing the strategic introduction of specialized linerless labels engineered for niche applications, such as those requiring extreme temperature resistance for cold storage, or enhanced durability in high-humidity industrial environments.
Key Drivers of Linerless Labels Industry Growth
The growth of the linerless labels industry is driven by several key factors:
- Technological advancements: Improvements in adhesive technology, printing methods, and material science are enabling the production of higher-quality, more versatile labels.
- Sustainability concerns: The increasing focus on reducing waste and environmental impact is driving the adoption of linerless labels as a more eco-friendly alternative.
- E-commerce boom: The rapid growth of online retail is fueling the demand for efficient and cost-effective labeling solutions.
Challenges in the Linerless Labels Industry Market
While the linerless labels market is brimming with opportunity, it is not without its hurdles:
- Capital Investment and Technological Adoption: The implementation of advanced linerless application systems and the adoption of new material formulations often necessitate a substantial initial capital investment, which can be a barrier for some businesses.
- Supply Chain Volatility and Raw Material Sourcing: Global supply chain disruptions, geopolitical factors, and fluctuations in the availability and cost of key raw materials can impact production timelines and cost structures for linerless label manufacturers.
- Market Saturation and Differentiation: As the market matures, competition intensifies, requiring existing and new players to constantly innovate and differentiate their offerings to capture market share and maintain profitability.
- Educating the Market and End-Users: In some instances, there is a need for ongoing education and awareness campaigns to fully highlight the benefits and operational advantages of linerless labeling solutions to potential end-users.
Emerging Opportunities in Linerless Labels Industry
The linerless labels market presents several exciting opportunities:
- Expansion into new applications: The potential for linerless labels extends beyond existing applications, opening avenues in emerging sectors.
- Technological innovation: Continuous advancements in printing and material technology will create new possibilities.
- Strategic partnerships: Collaborations between label manufacturers and technology providers can unlock new growth opportunities.
Leading Players in the Linerless Labels Industry Sector
- R R Donnelley & Sons Company
- Hub Labels Inc
- ProPrint Group
- Coveris
- Lexit Group AS
- Gipako UAB
- Optimum Group
- Skanem AS
- NAStar Inc
- Reflex Labels Ltd
- Innovia Films (CCL Industries)
- SATO Europe GmbH
- UPM Raflatac
- Avery Dennison
- Constantia Flexibles
Key Milestones in Linerless Labels Industry Industry
- February 2022: ProPrint Group invested almost EUR 1 million in new coating and printing equipment, significantly increasing its linerless label production capacity.
- February 2022: Lexit Group partnered with Markem-Imaje to expand its distribution network in Scandinavia.
Strategic Outlook for Linerless Labels Industry Market
The linerless labels market is strategically positioned for sustained and accelerated growth. This trajectory will be propelled by the ongoing wave of technological advancements, the undeniable shift towards sustainable packaging solutions, and the ever-increasing demand from a diverse range of end-use sectors. To thrive in this dynamic environment, companies will need to prioritize strategic alliances and collaborations, pursue judicious geographical expansion into high-growth regions, and actively engage in product diversification to cater to evolving market niches. Long-term success will be intrinsically linked to an organization's agility in adapting to shifting consumer preferences, its commitment to offering environmentally responsible and cost-effective labeling solutions, and its capacity to innovate and lead in the development of next-generation linerless technologies.
Linerless Labels Industry Segmentation
-
1. Printing Technology
- 1.1. Gravure
- 1.2. Flexography
- 1.3. Digital
- 1.4. Other Processes of Printing
-
2. End-user Industry
- 2.1. Food
- 2.2. Beverage
- 2.3. Healthcare
- 2.4. Cosmetics
- 2.5. Household
- 2.6. Industrial
- 2.7. Logistics
- 2.8. Other End-user Industries
Linerless Labels Industry Segmentation By Geography
- 1. North America
- 2. Europe
- 3. Asia Pacific
- 4. Latin America
- 5. Middle East and Africa
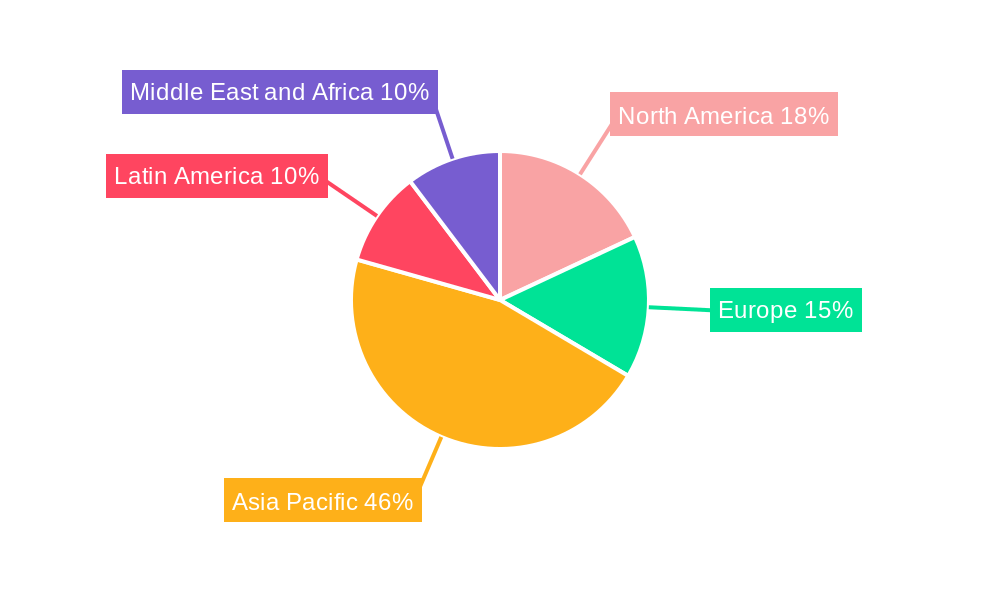
Linerless Labels Industry Regional Market Share
Geographic Coverage of Linerless Labels Industry
Linerless Labels Industry REPORT HIGHLIGHTS
| Aspects | Details |
|---|---|
| Study Period | 2020-2034 |
| Base Year | 2025 |
| Estimated Year | 2026 |
| Forecast Period | 2026-2034 |
| Historical Period | 2020-2025 |
| Growth Rate | CAGR of 5.28% from 2020-2034 |
| Segmentation |
|
Table of Contents
- 1. Introduction
- 1.1. Research Scope
- 1.2. Market Segmentation
- 1.3. Research Objective
- 1.4. Definitions and Assumptions
- 2. Executive Summary
- 2.1. Market Snapshot
- 3. Market Dynamics
- 3.1. Market Drivers
- 3.2. Market Restrains
- 3.3. Market Trends
- 3.4. Market Opportunities
- 4. Market Factor Analysis
- 4.1. Porters Five Forces
- 4.1.1. Bargaining Power of Suppliers
- 4.1.2. Bargaining Power of Buyers
- 4.1.3. Threat of New Entrants
- 4.1.4. Threat of Substitutes
- 4.1.5. Competitive Rivalry
- 4.2. PESTEL analysis
- 4.3. BCG Analysis
- 4.3.1. Stars (High Growth, High Market Share)
- 4.3.2. Cash Cows (Low Growth, High Market Share)
- 4.3.3. Question Mark (High Growth, Low Market Share)
- 4.3.4. Dogs (Low Growth, Low Market Share)
- 4.4. Ansoff Matrix Analysis
- 4.5. Supply Chain Analysis
- 4.6. Regulatory Landscape
- 4.7. Current Market Potential and Opportunity Assessment (TAM–SAM–SOM Framework)
- 4.8. MDP Analyst Note
- 4.1. Porters Five Forces
- 5. Market Analysis, Insights and Forecast 2021-2033
- 5.1. Market Analysis, Insights and Forecast - by Printing Technology
- 5.1.1. Gravure
- 5.1.2. Flexography
- 5.1.3. Digital
- 5.1.4. Other Processes of Printing
- 5.2. Market Analysis, Insights and Forecast - by End-user Industry
- 5.2.1. Food
- 5.2.2. Beverage
- 5.2.3. Healthcare
- 5.2.4. Cosmetics
- 5.2.5. Household
- 5.2.6. Industrial
- 5.2.7. Logistics
- 5.2.8. Other End-user Industries
- 5.3. Market Analysis, Insights and Forecast - by Region
- 5.3.1. North America
- 5.3.2. Europe
- 5.3.3. Asia Pacific
- 5.3.4. Latin America
- 5.3.5. Middle East and Africa
- 5.1. Market Analysis, Insights and Forecast - by Printing Technology
- 6. Global Linerless Labels Industry Analysis, Insights and Forecast, 2021-2033
- 6.1. Market Analysis, Insights and Forecast - by Printing Technology
- 6.1.1. Gravure
- 6.1.2. Flexography
- 6.1.3. Digital
- 6.1.4. Other Processes of Printing
- 6.2. Market Analysis, Insights and Forecast - by End-user Industry
- 6.2.1. Food
- 6.2.2. Beverage
- 6.2.3. Healthcare
- 6.2.4. Cosmetics
- 6.2.5. Household
- 6.2.6. Industrial
- 6.2.7. Logistics
- 6.2.8. Other End-user Industries
- 6.1. Market Analysis, Insights and Forecast - by Printing Technology
- 7. North America Linerless Labels Industry Analysis, Insights and Forecast, 2020-2032
- 7.1. Market Analysis, Insights and Forecast - by Printing Technology
- 7.1.1. Gravure
- 7.1.2. Flexography
- 7.1.3. Digital
- 7.1.4. Other Processes of Printing
- 7.2. Market Analysis, Insights and Forecast - by End-user Industry
- 7.2.1. Food
- 7.2.2. Beverage
- 7.2.3. Healthcare
- 7.2.4. Cosmetics
- 7.2.5. Household
- 7.2.6. Industrial
- 7.2.7. Logistics
- 7.2.8. Other End-user Industries
- 7.1. Market Analysis, Insights and Forecast - by Printing Technology
- 8. Europe Linerless Labels Industry Analysis, Insights and Forecast, 2020-2032
- 8.1. Market Analysis, Insights and Forecast - by Printing Technology
- 8.1.1. Gravure
- 8.1.2. Flexography
- 8.1.3. Digital
- 8.1.4. Other Processes of Printing
- 8.2. Market Analysis, Insights and Forecast - by End-user Industry
- 8.2.1. Food
- 8.2.2. Beverage
- 8.2.3. Healthcare
- 8.2.4. Cosmetics
- 8.2.5. Household
- 8.2.6. Industrial
- 8.2.7. Logistics
- 8.2.8. Other End-user Industries
- 8.1. Market Analysis, Insights and Forecast - by Printing Technology
- 9. Asia Pacific Linerless Labels Industry Analysis, Insights and Forecast, 2020-2032
- 9.1. Market Analysis, Insights and Forecast - by Printing Technology
- 9.1.1. Gravure
- 9.1.2. Flexography
- 9.1.3. Digital
- 9.1.4. Other Processes of Printing
- 9.2. Market Analysis, Insights and Forecast - by End-user Industry
- 9.2.1. Food
- 9.2.2. Beverage
- 9.2.3. Healthcare
- 9.2.4. Cosmetics
- 9.2.5. Household
- 9.2.6. Industrial
- 9.2.7. Logistics
- 9.2.8. Other End-user Industries
- 9.1. Market Analysis, Insights and Forecast - by Printing Technology
- 10. Latin America Linerless Labels Industry Analysis, Insights and Forecast, 2020-2032
- 10.1. Market Analysis, Insights and Forecast - by Printing Technology
- 10.1.1. Gravure
- 10.1.2. Flexography
- 10.1.3. Digital
- 10.1.4. Other Processes of Printing
- 10.2. Market Analysis, Insights and Forecast - by End-user Industry
- 10.2.1. Food
- 10.2.2. Beverage
- 10.2.3. Healthcare
- 10.2.4. Cosmetics
- 10.2.5. Household
- 10.2.6. Industrial
- 10.2.7. Logistics
- 10.2.8. Other End-user Industries
- 10.1. Market Analysis, Insights and Forecast - by Printing Technology
- 11. Middle East and Africa Linerless Labels Industry Analysis, Insights and Forecast, 2020-2032
- 11.1. Market Analysis, Insights and Forecast - by Printing Technology
- 11.1.1. Gravure
- 11.1.2. Flexography
- 11.1.3. Digital
- 11.1.4. Other Processes of Printing
- 11.2. Market Analysis, Insights and Forecast - by End-user Industry
- 11.2.1. Food
- 11.2.2. Beverage
- 11.2.3. Healthcare
- 11.2.4. Cosmetics
- 11.2.5. Household
- 11.2.6. Industrial
- 11.2.7. Logistics
- 11.2.8. Other End-user Industries
- 11.1. Market Analysis, Insights and Forecast - by Printing Technology
- 12. Competitive Analysis
- 12.1. Company Profiles
- 12.1.1 R R Donnelley & Sons Company
- 12.1.1.1. Company Overview
- 12.1.1.2. Products
- 12.1.1.3. Company Financials
- 12.1.1.4. SWOT Analysis
- 12.1.2 Hub Labels Inc
- 12.1.2.1. Company Overview
- 12.1.2.2. Products
- 12.1.2.3. Company Financials
- 12.1.2.4. SWOT Analysis
- 12.1.3 ProPrint Group
- 12.1.3.1. Company Overview
- 12.1.3.2. Products
- 12.1.3.3. Company Financials
- 12.1.3.4. SWOT Analysis
- 12.1.4 Coveris
- 12.1.4.1. Company Overview
- 12.1.4.2. Products
- 12.1.4.3. Company Financials
- 12.1.4.4. SWOT Analysis
- 12.1.5 Lexit Group AS
- 12.1.5.1. Company Overview
- 12.1.5.2. Products
- 12.1.5.3. Company Financials
- 12.1.5.4. SWOT Analysis
- 12.1.6 Gipako UAB*List Not Exhaustive
- 12.1.6.1. Company Overview
- 12.1.6.2. Products
- 12.1.6.3. Company Financials
- 12.1.6.4. SWOT Analysis
- 12.1.7 Optimum Group
- 12.1.7.1. Company Overview
- 12.1.7.2. Products
- 12.1.7.3. Company Financials
- 12.1.7.4. SWOT Analysis
- 12.1.8 Skanem AS
- 12.1.8.1. Company Overview
- 12.1.8.2. Products
- 12.1.8.3. Company Financials
- 12.1.8.4. SWOT Analysis
- 12.1.9 NAStar Inc
- 12.1.9.1. Company Overview
- 12.1.9.2. Products
- 12.1.9.3. Company Financials
- 12.1.9.4. SWOT Analysis
- 12.1.10 Reflex Labels Ltd
- 12.1.10.1. Company Overview
- 12.1.10.2. Products
- 12.1.10.3. Company Financials
- 12.1.10.4. SWOT Analysis
- 12.1.11 Innovia Films (CCL Industries)
- 12.1.11.1. Company Overview
- 12.1.11.2. Products
- 12.1.11.3. Company Financials
- 12.1.11.4. SWOT Analysis
- 12.1.12 SATO Europe GmbH
- 12.1.12.1. Company Overview
- 12.1.12.2. Products
- 12.1.12.3. Company Financials
- 12.1.12.4. SWOT Analysis
- 12.1.1 R R Donnelley & Sons Company
- 12.2. Market Entropy
- 12.2.1 Company's Key Areas Served
- 12.2.2 Recent Developments
- 12.3. Company Market Share Analysis 2025
- 12.3.1 Top 5 Companies Market Share Analysis
- 12.3.2 Top 3 Companies Market Share Analysis
- 12.4. List of Potential Customers
- 13. Research Methodology
List of Figures
- Figure 1: Global Linerless Labels Industry Revenue Breakdown (Million, %) by Region 2025 & 2033
- Figure 2: North America Linerless Labels Industry Revenue (Million), by Printing Technology 2025 & 2033
- Figure 3: North America Linerless Labels Industry Revenue Share (%), by Printing Technology 2025 & 2033
- Figure 4: North America Linerless Labels Industry Revenue (Million), by End-user Industry 2025 & 2033
- Figure 5: North America Linerless Labels Industry Revenue Share (%), by End-user Industry 2025 & 2033
- Figure 6: North America Linerless Labels Industry Revenue (Million), by Country 2025 & 2033
- Figure 7: North America Linerless Labels Industry Revenue Share (%), by Country 2025 & 2033
- Figure 8: Europe Linerless Labels Industry Revenue (Million), by Printing Technology 2025 & 2033
- Figure 9: Europe Linerless Labels Industry Revenue Share (%), by Printing Technology 2025 & 2033
- Figure 10: Europe Linerless Labels Industry Revenue (Million), by End-user Industry 2025 & 2033
- Figure 11: Europe Linerless Labels Industry Revenue Share (%), by End-user Industry 2025 & 2033
- Figure 12: Europe Linerless Labels Industry Revenue (Million), by Country 2025 & 2033
- Figure 13: Europe Linerless Labels Industry Revenue Share (%), by Country 2025 & 2033
- Figure 14: Asia Pacific Linerless Labels Industry Revenue (Million), by Printing Technology 2025 & 2033
- Figure 15: Asia Pacific Linerless Labels Industry Revenue Share (%), by Printing Technology 2025 & 2033
- Figure 16: Asia Pacific Linerless Labels Industry Revenue (Million), by End-user Industry 2025 & 2033
- Figure 17: Asia Pacific Linerless Labels Industry Revenue Share (%), by End-user Industry 2025 & 2033
- Figure 18: Asia Pacific Linerless Labels Industry Revenue (Million), by Country 2025 & 2033
- Figure 19: Asia Pacific Linerless Labels Industry Revenue Share (%), by Country 2025 & 2033
- Figure 20: Latin America Linerless Labels Industry Revenue (Million), by Printing Technology 2025 & 2033
- Figure 21: Latin America Linerless Labels Industry Revenue Share (%), by Printing Technology 2025 & 2033
- Figure 22: Latin America Linerless Labels Industry Revenue (Million), by End-user Industry 2025 & 2033
- Figure 23: Latin America Linerless Labels Industry Revenue Share (%), by End-user Industry 2025 & 2033
- Figure 24: Latin America Linerless Labels Industry Revenue (Million), by Country 2025 & 2033
- Figure 25: Latin America Linerless Labels Industry Revenue Share (%), by Country 2025 & 2033
- Figure 26: Middle East and Africa Linerless Labels Industry Revenue (Million), by Printing Technology 2025 & 2033
- Figure 27: Middle East and Africa Linerless Labels Industry Revenue Share (%), by Printing Technology 2025 & 2033
- Figure 28: Middle East and Africa Linerless Labels Industry Revenue (Million), by End-user Industry 2025 & 2033
- Figure 29: Middle East and Africa Linerless Labels Industry Revenue Share (%), by End-user Industry 2025 & 2033
- Figure 30: Middle East and Africa Linerless Labels Industry Revenue (Million), by Country 2025 & 2033
- Figure 31: Middle East and Africa Linerless Labels Industry Revenue Share (%), by Country 2025 & 2033
List of Tables
- Table 1: Global Linerless Labels Industry Revenue Million Forecast, by Printing Technology 2020 & 2033
- Table 2: Global Linerless Labels Industry Revenue Million Forecast, by End-user Industry 2020 & 2033
- Table 3: Global Linerless Labels Industry Revenue Million Forecast, by Region 2020 & 2033
- Table 4: Global Linerless Labels Industry Revenue Million Forecast, by Printing Technology 2020 & 2033
- Table 5: Global Linerless Labels Industry Revenue Million Forecast, by End-user Industry 2020 & 2033
- Table 6: Global Linerless Labels Industry Revenue Million Forecast, by Country 2020 & 2033
- Table 7: Global Linerless Labels Industry Revenue Million Forecast, by Printing Technology 2020 & 2033
- Table 8: Global Linerless Labels Industry Revenue Million Forecast, by End-user Industry 2020 & 2033
- Table 9: Global Linerless Labels Industry Revenue Million Forecast, by Country 2020 & 2033
- Table 10: Global Linerless Labels Industry Revenue Million Forecast, by Printing Technology 2020 & 2033
- Table 11: Global Linerless Labels Industry Revenue Million Forecast, by End-user Industry 2020 & 2033
- Table 12: Global Linerless Labels Industry Revenue Million Forecast, by Country 2020 & 2033
- Table 13: Global Linerless Labels Industry Revenue Million Forecast, by Printing Technology 2020 & 2033
- Table 14: Global Linerless Labels Industry Revenue Million Forecast, by End-user Industry 2020 & 2033
- Table 15: Global Linerless Labels Industry Revenue Million Forecast, by Country 2020 & 2033
- Table 16: Global Linerless Labels Industry Revenue Million Forecast, by Printing Technology 2020 & 2033
- Table 17: Global Linerless Labels Industry Revenue Million Forecast, by End-user Industry 2020 & 2033
- Table 18: Global Linerless Labels Industry Revenue Million Forecast, by Country 2020 & 2033
Frequently Asked Questions
1. What is the projected Compound Annual Growth Rate (CAGR) of the Linerless Labels Industry?
The projected CAGR is approximately 5.28%.
2. Which companies are prominent players in the Linerless Labels Industry?
Key companies in the market include R R Donnelley & Sons Company, Hub Labels Inc, ProPrint Group, Coveris, Lexit Group AS, Gipako UAB*List Not Exhaustive, Optimum Group, Skanem AS, NAStar Inc, Reflex Labels Ltd, Innovia Films (CCL Industries), SATO Europe GmbH.
3. What are the main segments of the Linerless Labels Industry?
The market segments include Printing Technology, End-user Industry.
4. Can you provide details about the market size?
The market size is estimated to be USD 1.94 Million as of 2022.
5. What are some drivers contributing to market growth?
Increasing Demand for Packaged Foods and Beverages; Increasing Demand for Pharmaceutical Supplies.
6. What are the notable trends driving market growth?
Food and Beverage Expected to Hold the Largest Market Share.
7. Are there any restraints impacting market growth?
Fluctuation in the Prices of Raw Materials.
8. Can you provide examples of recent developments in the market?
Feb 2022 - ProPrintGroup installed a new Ravenwood Com500 Coater. There will also be a new advanced 10-colour EdaleFL3 flexo press. As a result, ProPrint'sLinerless Labels segment now has a total investment of almost EUR 1 million. ProPrintwill becomes a first-class Linerless Labels provider as a result of the transfer, which will greatly increase Linerless Labeling capacity.
9. What pricing options are available for accessing the report?
Pricing options include single-user, multi-user, and enterprise licenses priced at USD 4750, USD 5250, and USD 8750 respectively.
10. Is the market size provided in terms of value or volume?
The market size is provided in terms of value, measured in Million.
11. Are there any specific market keywords associated with the report?
Yes, the market keyword associated with the report is "Linerless Labels Industry," which aids in identifying and referencing the specific market segment covered.
12. How do I determine which pricing option suits my needs best?
The pricing options vary based on user requirements and access needs. Individual users may opt for single-user licenses, while businesses requiring broader access may choose multi-user or enterprise licenses for cost-effective access to the report.
13. Are there any additional resources or data provided in the Linerless Labels Industry report?
While the report offers comprehensive insights, it's advisable to review the specific contents or supplementary materials provided to ascertain if additional resources or data are available.
14. How can I stay updated on further developments or reports in the Linerless Labels Industry?
To stay informed about further developments, trends, and reports in the Linerless Labels Industry, consider subscribing to industry newsletters, following relevant companies and organizations, or regularly checking reputable industry news sources and publications.
Methodology
Step 1 - Identification of Relevant Samples Size from Population Database


Step 2 - Approaches for Defining Global Market Size (Value, Volume* & Price*)

Note*: In applicable scenarios
Step 3 - Data Sources
Primary Research
- Web Analytics
- Survey Reports
- Research Institute
- Latest Research Reports
- Opinion Leaders
Secondary Research
- Annual Reports
- White Paper
- Latest Press Release
- Industry Association
- Paid Database
- Investor Presentations

Step 4 - Data Triangulation
Involves using different sources of information in order to increase the validity of a study
These sources are likely to be stakeholders in a program - participants, other researchers, program staff, other community members, and so on.
Then we put all data in single framework & apply various statistical tools to find out the dynamic on the market.
During the analysis stage, feedback from the stakeholder groups would be compared to determine areas of agreement as well as areas of divergence