

Key Insights
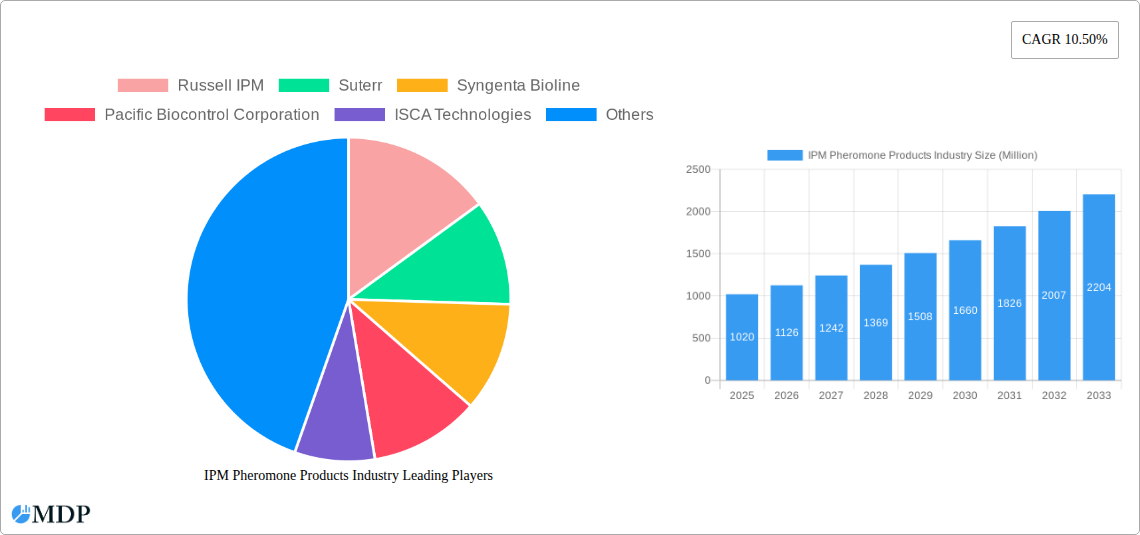
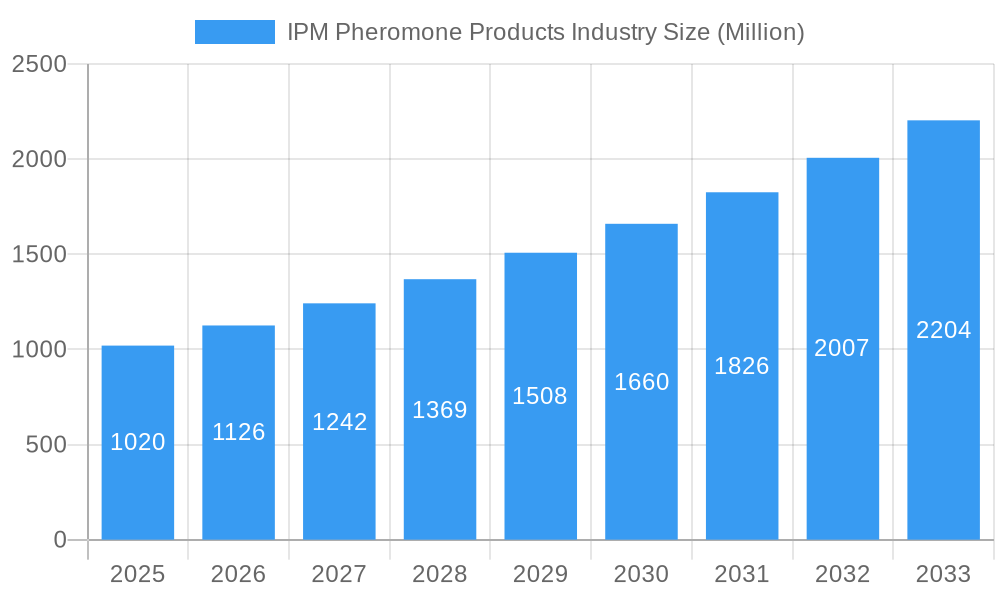
The global Integrated Pest Management (IPM) pheromone products market is experiencing robust growth, projected to reach a substantial size driven by increasing demand for eco-friendly pest control solutions. The market's Compound Annual Growth Rate (CAGR) of 10.50% from 2019 to 2024 indicates a significant upward trajectory. This growth is fueled by several key factors. Firstly, the rising consumer awareness of the harmful effects of chemical pesticides on human health and the environment is driving a shift towards sustainable agricultural practices. Secondly, stringent government regulations on pesticide use in many regions are further bolstering the adoption of IPM pheromone-based strategies. The diverse applications of these products across various crops (field crops, vegetable crops, and others) and pest management functions (mating disruption, detection & monitoring, mass trapping) contribute to market expansion. Technological advancements leading to improved pheromone formulations and delivery systems are also contributing to this growth. The market segmentation reveals strong demand across various application modes, including traps, lures, and dispensers, reflecting the versatility and effectiveness of IPM pheromone technologies. Major players like Russell IPM, Syngenta Bioline, and BASF SE are actively involved in R&D and market expansion, further solidifying the industry's growth potential.
IPM Pheromone Products Industry Market Size (In Billion)
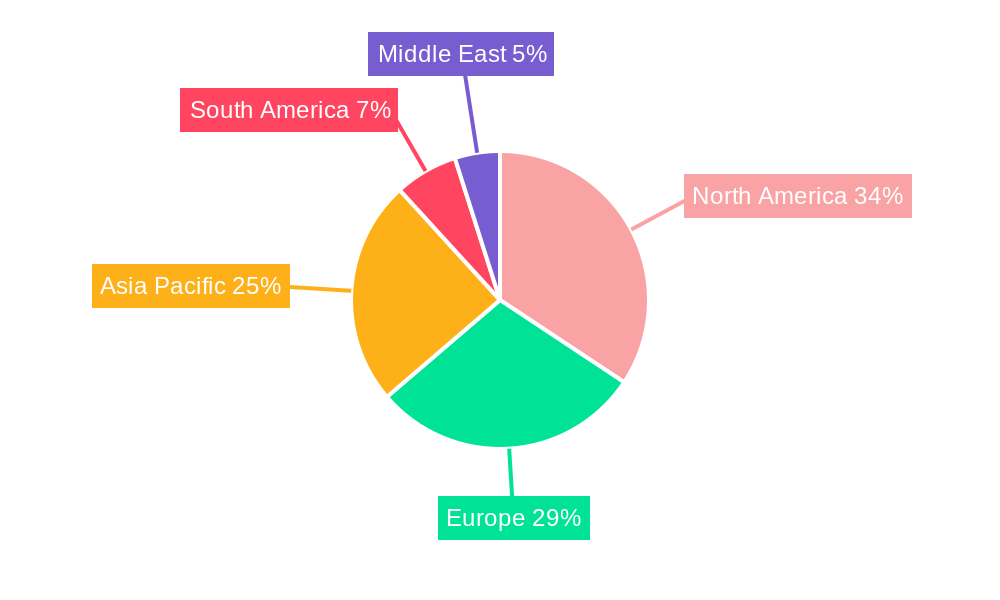
The market's geographical distribution shows strong presence across North America, Europe, and Asia-Pacific, with potential for significant future growth in emerging economies. While North America and Europe currently hold substantial market share due to established agricultural practices and regulatory frameworks, the Asia-Pacific region is poised for accelerated growth due to increasing agricultural activity and rising awareness of sustainable pest management. Factors such as high initial investment costs for implementation and potential challenges related to pheromone efficacy under varying environmental conditions may act as restraints, though these are likely to be outweighed by the long-term benefits and growing market acceptance of IPM pheromone products. Future growth will depend on continued technological innovation, increased government support for sustainable agriculture, and sustained consumer demand for safe and environmentally friendly food production. The forecast period (2025-2033) promises sustained expansion driven by these factors.
IPM Pheromone Products Industry Company Market Share
IPM Pheromone Products Industry Market Report: 2019-2033
This comprehensive report provides an in-depth analysis of the IPM Pheromone Products industry, offering valuable insights for stakeholders seeking to understand market dynamics, growth opportunities, and competitive landscapes. The report covers the period 2019-2033, with a focus on the estimated year 2025 and a forecast period of 2025-2033. The global market size is projected to reach xx Million by 2033, exhibiting a CAGR of xx% during the forecast period.
IPM Pheromone Products Industry Market Dynamics & Concentration
The IPM pheromone products market is characterized by a moderately concentrated landscape with key players like Russell IPM, Suterr, Syngenta Bioline, Pacific Biocontrol Corporation, ISCA Technologies, Shin-Etsu, Hercon Environmental, Sumi Agro France, Isagro, and BASF SE holding significant market share. The market share of the top five players is estimated at xx% in 2025. Innovation in pheromone delivery systems and formulations is a key driver, alongside increasing regulatory support for IPM strategies. Product substitutes, such as chemical insecticides, pose competition, but the growing preference for eco-friendly pest management solutions fuels market growth. The industry has witnessed xx M&A deals in the historical period (2019-2024), indicating strategic consolidation. End-user trends show a shift towards integrated pest management (IPM) programs, particularly within the agriculture sector.
- Market Concentration: Moderately Concentrated
- Innovation Drivers: Novel delivery systems, improved pheromone formulations.
- Regulatory Frameworks: Increasingly supportive of IPM practices.
- Product Substitutes: Chemical insecticides.
- End-user Trends: Growing adoption of IPM strategies in agriculture.
- M&A Activities: xx deals between 2019-2024.
IPM Pheromone Products Industry Industry Trends & Analysis
The IPM pheromone products market is experiencing significant growth, driven by factors like the rising demand for sustainable agricultural practices, increasing consumer awareness of pesticide residue concerns, and stringent regulations against chemical pesticides in various regions. Technological advancements, including the development of more effective and targeted pheromones, have further boosted market expansion. The market penetration of pheromone-based IPM solutions in specific crop segments is increasing steadily, with a notable rise in adoption among vegetable and field crops. The CAGR for the market during the forecast period (2025-2033) is projected at xx%, driven by the increasing awareness of environmentally friendly pest control methods and favorable government regulations. Competitive dynamics are shaped by continuous product innovation, strategic partnerships, and expansion into new geographical markets. Consumer preferences increasingly favor natural pest control methods, creating a strong impetus for market growth.
Leading Markets & Segments in IPM Pheromone Products Industry
The North American region currently holds the dominant position in the global IPM pheromone products market, followed by Europe and Asia-Pacific. Within segments:
By Type: Pheromones holds the largest market share, followed by aggregation pheromones. "Others" represents a smaller but growing segment with specialized pheromone blends.
By Function: Mating disruption is the leading application, followed by detection and monitoring, with mass trapping showing steady growth.
By Mode of Application: Traps are currently the most prevalent mode of application, with dispensers and lures showing increasing popularity.
By Crops: Field crops and vegetable crops are the key end-use segments, driven by the high prevalence of pests and the significant economic impact of crop losses.
Key Drivers:
- North America: Strong regulatory support for IPM, high adoption rates in agriculture.
- Europe: Growing consumer demand for sustainable and organic produce.
- Asia-Pacific: Increasing investments in agricultural technology and rising awareness of IPM.
IPM Pheromone Products Industry Product Developments
Recent product innovations focus on improved pheromone formulations with enhanced efficacy and longevity, along with the development of sophisticated dispenser technologies for precise and targeted application. These innovations aim to enhance the effectiveness of mating disruption, detection, and trapping strategies, while minimizing environmental impact. The market is witnessing a trend toward the integration of pheromone-based IPM with other pest management techniques, creating synergistic solutions for broader pest control.
Key Drivers of IPM Pheromone Products Industry Growth
The growth of the IPM pheromone products industry is driven by several factors:
- Technological Advancements: Development of more effective and specific pheromone formulations.
- Stringent Regulations: Growing restrictions on the use of chemical pesticides.
- Rising Consumer Demand: Increasing preference for organically grown produce and environmentally friendly pest management.
- Economic Benefits: IPM offers cost savings compared to traditional methods in the long run.
Challenges in the IPM Pheromone Products Industry Market
The industry faces several challenges, including:
- High Initial Investment Costs: Adoption of IPM can involve significant upfront investment.
- Supply Chain Disruptions: Global supply chain issues can impact the availability of raw materials.
- Competition from Chemical Pesticides: The lower cost of chemical pesticides remains a barrier to adoption.
- Effectiveness Variability: The efficacy of pheromone-based IPM can vary depending on environmental conditions.
Emerging Opportunities in IPM Pheromone Products Industry
Significant long-term growth opportunities exist, spurred by:
- Technological Breakthroughs: Advancements in pheromone synthesis and delivery systems.
- Strategic Partnerships: Collaboration between pheromone manufacturers and agricultural companies.
- Market Expansion: Expansion into developing countries with increasing demand for IPM.
- Development of integrated pest management strategies: Combining pheromone-based methods with other sustainable pest control techniques.
Leading Players in the IPM Pheromone Products Industry Sector
- Russell IPM
- Suterr
- Syngenta Bioline
- Pacific Biocontrol Corporation
- ISCA Technologies
- Shin-Etsu
- Hercon Environmental
- Sumi Agro France
- Isagro
- BASF SE
Key Milestones in IPM Pheromone Products Industry Industry
- 2020: Launch of a new pheromone dispenser with improved efficacy by ISCA Technologies.
- 2021: Syngenta Bioline acquires a smaller pheromone manufacturer, expanding its market reach.
- 2022: Introduction of a novel pheromone blend for managing a specific pest species by Russell IPM.
- 2023: Significant investments in R&D by BASF SE for advanced pheromone delivery systems.
Strategic Outlook for IPM Pheromone Products Industry Market
The IPM pheromone products market is poised for robust growth over the next decade, driven by increasing environmental concerns, favorable regulatory landscapes, and ongoing technological advancements. Strategic opportunities lie in developing innovative pheromone-based solutions targeting specific pests and crops, expanding into emerging markets, and forging strategic alliances to enhance market penetration and distribution capabilities. The focus will shift towards developing integrated pest management systems incorporating pheromones alongside other sustainable techniques, offering comprehensive and effective pest control solutions.
IPM Pheromone Products Industry Segmentation
- 1. Production Analysis
- 2. Consumption Analysis
- 3. Import Market Analysis (Value & Volume)
- 4. Export Market Analysis (Value & Volume)
- 5. Price Trend Analysis
IPM Pheromone Products Industry Segmentation By Geography
-
1. North America
- 1.1. United States
- 1.2. Canada
- 1.3. Mexico
-
2. South America
- 2.1. Brazil
- 2.2. Argentina
- 2.3. Rest of South America
-
3. Europe
- 3.1. United Kingdom
- 3.2. Germany
- 3.3. France
- 3.4. Italy
- 3.5. Spain
- 3.6. Russia
- 3.7. Benelux
- 3.8. Nordics
- 3.9. Rest of Europe
-
4. Middle East & Africa
- 4.1. Turkey
- 4.2. Israel
- 4.3. GCC
- 4.4. North Africa
- 4.5. South Africa
- 4.6. Rest of Middle East & Africa
-
5. Asia Pacific
- 5.1. China
- 5.2. India
- 5.3. Japan
- 5.4. South Korea
- 5.5. ASEAN
- 5.6. Oceania
- 5.7. Rest of Asia Pacific
IPM Pheromone Products Industry Regional Market Share
Geographic Coverage of IPM Pheromone Products Industry
IPM Pheromone Products Industry REPORT HIGHLIGHTS
| Aspects | Details |
|---|---|
| Study Period | 2020-2034 |
| Base Year | 2025 |
| Estimated Year | 2026 |
| Forecast Period | 2026-2034 |
| Historical Period | 2020-2025 |
| Growth Rate | CAGR of 10.50% from 2020-2034 |
| Segmentation |
|
Table of Contents
- 1. Introduction
- 1.1. Research Scope
- 1.2. Market Segmentation
- 1.3. Research Objective
- 1.4. Definitions and Assumptions
- 2. Executive Summary
- 2.1. Market Snapshot
- 3. Market Dynamics
- 3.1. Market Drivers
- 3.2. Market Restrains
- 3.3. Market Trends
- 3.4. Market Opportunities
- 4. Market Factor Analysis
- 4.1. Porters Five Forces
- 4.1.1. Bargaining Power of Suppliers
- 4.1.2. Bargaining Power of Buyers
- 4.1.3. Threat of New Entrants
- 4.1.4. Threat of Substitutes
- 4.1.5. Competitive Rivalry
- 4.2. PESTEL analysis
- 4.3. BCG Analysis
- 4.3.1. Stars (High Growth, High Market Share)
- 4.3.2. Cash Cows (Low Growth, High Market Share)
- 4.3.3. Question Mark (High Growth, Low Market Share)
- 4.3.4. Dogs (Low Growth, Low Market Share)
- 4.4. Ansoff Matrix Analysis
- 4.5. Supply Chain Analysis
- 4.6. Regulatory Landscape
- 4.7. Current Market Potential and Opportunity Assessment (TAM–SAM–SOM Framework)
- 4.8. MDP Analyst Note
- 4.1. Porters Five Forces
- 5. Market Analysis, Insights and Forecast 2021-2033
- 5.1. Market Analysis, Insights and Forecast - by Production Analysis
- 5.2. Market Analysis, Insights and Forecast - by Consumption Analysis
- 5.3. Market Analysis, Insights and Forecast - by Import Market Analysis (Value & Volume)
- 5.4. Market Analysis, Insights and Forecast - by Export Market Analysis (Value & Volume)
- 5.5. Market Analysis, Insights and Forecast - by Price Trend Analysis
- 5.6. Market Analysis, Insights and Forecast - by Region
- 5.6.1. North America
- 5.6.2. South America
- 5.6.3. Europe
- 5.6.4. Middle East & Africa
- 5.6.5. Asia Pacific
- 6. Global IPM Pheromone Products Industry Analysis, Insights and Forecast, 2021-2033
- 6.1. Market Analysis, Insights and Forecast - by Production Analysis
- 6.2. Market Analysis, Insights and Forecast - by Consumption Analysis
- 6.3. Market Analysis, Insights and Forecast - by Import Market Analysis (Value & Volume)
- 6.4. Market Analysis, Insights and Forecast - by Export Market Analysis (Value & Volume)
- 6.5. Market Analysis, Insights and Forecast - by Price Trend Analysis
- 7. North America IPM Pheromone Products Industry Analysis, Insights and Forecast, 2020-2032
- 7.1. Market Analysis, Insights and Forecast - by Production Analysis
- 7.2. Market Analysis, Insights and Forecast - by Consumption Analysis
- 7.3. Market Analysis, Insights and Forecast - by Import Market Analysis (Value & Volume)
- 7.4. Market Analysis, Insights and Forecast - by Export Market Analysis (Value & Volume)
- 7.5. Market Analysis, Insights and Forecast - by Price Trend Analysis
- 8. South America IPM Pheromone Products Industry Analysis, Insights and Forecast, 2020-2032
- 8.1. Market Analysis, Insights and Forecast - by Production Analysis
- 8.2. Market Analysis, Insights and Forecast - by Consumption Analysis
- 8.3. Market Analysis, Insights and Forecast - by Import Market Analysis (Value & Volume)
- 8.4. Market Analysis, Insights and Forecast - by Export Market Analysis (Value & Volume)
- 8.5. Market Analysis, Insights and Forecast - by Price Trend Analysis
- 9. Europe IPM Pheromone Products Industry Analysis, Insights and Forecast, 2020-2032
- 9.1. Market Analysis, Insights and Forecast - by Production Analysis
- 9.2. Market Analysis, Insights and Forecast - by Consumption Analysis
- 9.3. Market Analysis, Insights and Forecast - by Import Market Analysis (Value & Volume)
- 9.4. Market Analysis, Insights and Forecast - by Export Market Analysis (Value & Volume)
- 9.5. Market Analysis, Insights and Forecast - by Price Trend Analysis
- 10. Middle East & Africa IPM Pheromone Products Industry Analysis, Insights and Forecast, 2020-2032
- 10.1. Market Analysis, Insights and Forecast - by Production Analysis
- 10.2. Market Analysis, Insights and Forecast - by Consumption Analysis
- 10.3. Market Analysis, Insights and Forecast - by Import Market Analysis (Value & Volume)
- 10.4. Market Analysis, Insights and Forecast - by Export Market Analysis (Value & Volume)
- 10.5. Market Analysis, Insights and Forecast - by Price Trend Analysis
- 11. Asia Pacific IPM Pheromone Products Industry Analysis, Insights and Forecast, 2020-2032
- 11.1. Market Analysis, Insights and Forecast - by Production Analysis
- 11.2. Market Analysis, Insights and Forecast - by Consumption Analysis
- 11.3. Market Analysis, Insights and Forecast - by Import Market Analysis (Value & Volume)
- 11.4. Market Analysis, Insights and Forecast - by Export Market Analysis (Value & Volume)
- 11.5. Market Analysis, Insights and Forecast - by Price Trend Analysis
- 12. Competitive Analysis
- 12.1. Company Profiles
- 12.1.1 Russell IPM
- 12.1.1.1. Company Overview
- 12.1.1.2. Products
- 12.1.1.3. Company Financials
- 12.1.1.4. SWOT Analysis
- 12.1.2 Suterr
- 12.1.2.1. Company Overview
- 12.1.2.2. Products
- 12.1.2.3. Company Financials
- 12.1.2.4. SWOT Analysis
- 12.1.3 Syngenta Bioline
- 12.1.3.1. Company Overview
- 12.1.3.2. Products
- 12.1.3.3. Company Financials
- 12.1.3.4. SWOT Analysis
- 12.1.4 Pacific Biocontrol Corporation
- 12.1.4.1. Company Overview
- 12.1.4.2. Products
- 12.1.4.3. Company Financials
- 12.1.4.4. SWOT Analysis
- 12.1.5 ISCA Technologies
- 12.1.5.1. Company Overview
- 12.1.5.2. Products
- 12.1.5.3. Company Financials
- 12.1.5.4. SWOT Analysis
- 12.1.6 Shin-Etsu
- 12.1.6.1. Company Overview
- 12.1.6.2. Products
- 12.1.6.3. Company Financials
- 12.1.6.4. SWOT Analysis
- 12.1.7 Hercon Environmental
- 12.1.7.1. Company Overview
- 12.1.7.2. Products
- 12.1.7.3. Company Financials
- 12.1.7.4. SWOT Analysis
- 12.1.8 Sumi Agro France
- 12.1.8.1. Company Overview
- 12.1.8.2. Products
- 12.1.8.3. Company Financials
- 12.1.8.4. SWOT Analysis
- 12.1.9 Isagro
- 12.1.9.1. Company Overview
- 12.1.9.2. Products
- 12.1.9.3. Company Financials
- 12.1.9.4. SWOT Analysis
- 12.1.10 BASF SE
- 12.1.10.1. Company Overview
- 12.1.10.2. Products
- 12.1.10.3. Company Financials
- 12.1.10.4. SWOT Analysis
- 12.1.1 Russell IPM
- 12.2. Market Entropy
- 12.2.1 Company's Key Areas Served
- 12.2.2 Recent Developments
- 12.3. Company Market Share Analysis 2025
- 12.3.1 Top 5 Companies Market Share Analysis
- 12.3.2 Top 3 Companies Market Share Analysis
- 12.4. List of Potential Customers
- 13. Research Methodology
List of Figures
- Figure 1: Global IPM Pheromone Products Industry Revenue Breakdown (Million, %) by Region 2025 & 2033
- Figure 2: North America IPM Pheromone Products Industry Revenue (Million), by Production Analysis 2025 & 2033
- Figure 3: North America IPM Pheromone Products Industry Revenue Share (%), by Production Analysis 2025 & 2033
- Figure 4: North America IPM Pheromone Products Industry Revenue (Million), by Consumption Analysis 2025 & 2033
- Figure 5: North America IPM Pheromone Products Industry Revenue Share (%), by Consumption Analysis 2025 & 2033
- Figure 6: North America IPM Pheromone Products Industry Revenue (Million), by Import Market Analysis (Value & Volume) 2025 & 2033
- Figure 7: North America IPM Pheromone Products Industry Revenue Share (%), by Import Market Analysis (Value & Volume) 2025 & 2033
- Figure 8: North America IPM Pheromone Products Industry Revenue (Million), by Export Market Analysis (Value & Volume) 2025 & 2033
- Figure 9: North America IPM Pheromone Products Industry Revenue Share (%), by Export Market Analysis (Value & Volume) 2025 & 2033
- Figure 10: North America IPM Pheromone Products Industry Revenue (Million), by Price Trend Analysis 2025 & 2033
- Figure 11: North America IPM Pheromone Products Industry Revenue Share (%), by Price Trend Analysis 2025 & 2033
- Figure 12: North America IPM Pheromone Products Industry Revenue (Million), by Country 2025 & 2033
- Figure 13: North America IPM Pheromone Products Industry Revenue Share (%), by Country 2025 & 2033
- Figure 14: South America IPM Pheromone Products Industry Revenue (Million), by Production Analysis 2025 & 2033
- Figure 15: South America IPM Pheromone Products Industry Revenue Share (%), by Production Analysis 2025 & 2033
- Figure 16: South America IPM Pheromone Products Industry Revenue (Million), by Consumption Analysis 2025 & 2033
- Figure 17: South America IPM Pheromone Products Industry Revenue Share (%), by Consumption Analysis 2025 & 2033
- Figure 18: South America IPM Pheromone Products Industry Revenue (Million), by Import Market Analysis (Value & Volume) 2025 & 2033
- Figure 19: South America IPM Pheromone Products Industry Revenue Share (%), by Import Market Analysis (Value & Volume) 2025 & 2033
- Figure 20: South America IPM Pheromone Products Industry Revenue (Million), by Export Market Analysis (Value & Volume) 2025 & 2033
- Figure 21: South America IPM Pheromone Products Industry Revenue Share (%), by Export Market Analysis (Value & Volume) 2025 & 2033
- Figure 22: South America IPM Pheromone Products Industry Revenue (Million), by Price Trend Analysis 2025 & 2033
- Figure 23: South America IPM Pheromone Products Industry Revenue Share (%), by Price Trend Analysis 2025 & 2033
- Figure 24: South America IPM Pheromone Products Industry Revenue (Million), by Country 2025 & 2033
- Figure 25: South America IPM Pheromone Products Industry Revenue Share (%), by Country 2025 & 2033
- Figure 26: Europe IPM Pheromone Products Industry Revenue (Million), by Production Analysis 2025 & 2033
- Figure 27: Europe IPM Pheromone Products Industry Revenue Share (%), by Production Analysis 2025 & 2033
- Figure 28: Europe IPM Pheromone Products Industry Revenue (Million), by Consumption Analysis 2025 & 2033
- Figure 29: Europe IPM Pheromone Products Industry Revenue Share (%), by Consumption Analysis 2025 & 2033
- Figure 30: Europe IPM Pheromone Products Industry Revenue (Million), by Import Market Analysis (Value & Volume) 2025 & 2033
- Figure 31: Europe IPM Pheromone Products Industry Revenue Share (%), by Import Market Analysis (Value & Volume) 2025 & 2033
- Figure 32: Europe IPM Pheromone Products Industry Revenue (Million), by Export Market Analysis (Value & Volume) 2025 & 2033
- Figure 33: Europe IPM Pheromone Products Industry Revenue Share (%), by Export Market Analysis (Value & Volume) 2025 & 2033
- Figure 34: Europe IPM Pheromone Products Industry Revenue (Million), by Price Trend Analysis 2025 & 2033
- Figure 35: Europe IPM Pheromone Products Industry Revenue Share (%), by Price Trend Analysis 2025 & 2033
- Figure 36: Europe IPM Pheromone Products Industry Revenue (Million), by Country 2025 & 2033
- Figure 37: Europe IPM Pheromone Products Industry Revenue Share (%), by Country 2025 & 2033
- Figure 38: Middle East & Africa IPM Pheromone Products Industry Revenue (Million), by Production Analysis 2025 & 2033
- Figure 39: Middle East & Africa IPM Pheromone Products Industry Revenue Share (%), by Production Analysis 2025 & 2033
- Figure 40: Middle East & Africa IPM Pheromone Products Industry Revenue (Million), by Consumption Analysis 2025 & 2033
- Figure 41: Middle East & Africa IPM Pheromone Products Industry Revenue Share (%), by Consumption Analysis 2025 & 2033
- Figure 42: Middle East & Africa IPM Pheromone Products Industry Revenue (Million), by Import Market Analysis (Value & Volume) 2025 & 2033
- Figure 43: Middle East & Africa IPM Pheromone Products Industry Revenue Share (%), by Import Market Analysis (Value & Volume) 2025 & 2033
- Figure 44: Middle East & Africa IPM Pheromone Products Industry Revenue (Million), by Export Market Analysis (Value & Volume) 2025 & 2033
- Figure 45: Middle East & Africa IPM Pheromone Products Industry Revenue Share (%), by Export Market Analysis (Value & Volume) 2025 & 2033
- Figure 46: Middle East & Africa IPM Pheromone Products Industry Revenue (Million), by Price Trend Analysis 2025 & 2033
- Figure 47: Middle East & Africa IPM Pheromone Products Industry Revenue Share (%), by Price Trend Analysis 2025 & 2033
- Figure 48: Middle East & Africa IPM Pheromone Products Industry Revenue (Million), by Country 2025 & 2033
- Figure 49: Middle East & Africa IPM Pheromone Products Industry Revenue Share (%), by Country 2025 & 2033
- Figure 50: Asia Pacific IPM Pheromone Products Industry Revenue (Million), by Production Analysis 2025 & 2033
- Figure 51: Asia Pacific IPM Pheromone Products Industry Revenue Share (%), by Production Analysis 2025 & 2033
- Figure 52: Asia Pacific IPM Pheromone Products Industry Revenue (Million), by Consumption Analysis 2025 & 2033
- Figure 53: Asia Pacific IPM Pheromone Products Industry Revenue Share (%), by Consumption Analysis 2025 & 2033
- Figure 54: Asia Pacific IPM Pheromone Products Industry Revenue (Million), by Import Market Analysis (Value & Volume) 2025 & 2033
- Figure 55: Asia Pacific IPM Pheromone Products Industry Revenue Share (%), by Import Market Analysis (Value & Volume) 2025 & 2033
- Figure 56: Asia Pacific IPM Pheromone Products Industry Revenue (Million), by Export Market Analysis (Value & Volume) 2025 & 2033
- Figure 57: Asia Pacific IPM Pheromone Products Industry Revenue Share (%), by Export Market Analysis (Value & Volume) 2025 & 2033
- Figure 58: Asia Pacific IPM Pheromone Products Industry Revenue (Million), by Price Trend Analysis 2025 & 2033
- Figure 59: Asia Pacific IPM Pheromone Products Industry Revenue Share (%), by Price Trend Analysis 2025 & 2033
- Figure 60: Asia Pacific IPM Pheromone Products Industry Revenue (Million), by Country 2025 & 2033
- Figure 61: Asia Pacific IPM Pheromone Products Industry Revenue Share (%), by Country 2025 & 2033
List of Tables
- Table 1: Global IPM Pheromone Products Industry Revenue Million Forecast, by Production Analysis 2020 & 2033
- Table 2: Global IPM Pheromone Products Industry Revenue Million Forecast, by Consumption Analysis 2020 & 2033
- Table 3: Global IPM Pheromone Products Industry Revenue Million Forecast, by Import Market Analysis (Value & Volume) 2020 & 2033
- Table 4: Global IPM Pheromone Products Industry Revenue Million Forecast, by Export Market Analysis (Value & Volume) 2020 & 2033
- Table 5: Global IPM Pheromone Products Industry Revenue Million Forecast, by Price Trend Analysis 2020 & 2033
- Table 6: Global IPM Pheromone Products Industry Revenue Million Forecast, by Region 2020 & 2033
- Table 7: Global IPM Pheromone Products Industry Revenue Million Forecast, by Production Analysis 2020 & 2033
- Table 8: Global IPM Pheromone Products Industry Revenue Million Forecast, by Consumption Analysis 2020 & 2033
- Table 9: Global IPM Pheromone Products Industry Revenue Million Forecast, by Import Market Analysis (Value & Volume) 2020 & 2033
- Table 10: Global IPM Pheromone Products Industry Revenue Million Forecast, by Export Market Analysis (Value & Volume) 2020 & 2033
- Table 11: Global IPM Pheromone Products Industry Revenue Million Forecast, by Price Trend Analysis 2020 & 2033
- Table 12: Global IPM Pheromone Products Industry Revenue Million Forecast, by Country 2020 & 2033
- Table 13: United States IPM Pheromone Products Industry Revenue (Million) Forecast, by Application 2020 & 2033
- Table 14: Canada IPM Pheromone Products Industry Revenue (Million) Forecast, by Application 2020 & 2033
- Table 15: Mexico IPM Pheromone Products Industry Revenue (Million) Forecast, by Application 2020 & 2033
- Table 16: Global IPM Pheromone Products Industry Revenue Million Forecast, by Production Analysis 2020 & 2033
- Table 17: Global IPM Pheromone Products Industry Revenue Million Forecast, by Consumption Analysis 2020 & 2033
- Table 18: Global IPM Pheromone Products Industry Revenue Million Forecast, by Import Market Analysis (Value & Volume) 2020 & 2033
- Table 19: Global IPM Pheromone Products Industry Revenue Million Forecast, by Export Market Analysis (Value & Volume) 2020 & 2033
- Table 20: Global IPM Pheromone Products Industry Revenue Million Forecast, by Price Trend Analysis 2020 & 2033
- Table 21: Global IPM Pheromone Products Industry Revenue Million Forecast, by Country 2020 & 2033
- Table 22: Brazil IPM Pheromone Products Industry Revenue (Million) Forecast, by Application 2020 & 2033
- Table 23: Argentina IPM Pheromone Products Industry Revenue (Million) Forecast, by Application 2020 & 2033
- Table 24: Rest of South America IPM Pheromone Products Industry Revenue (Million) Forecast, by Application 2020 & 2033
- Table 25: Global IPM Pheromone Products Industry Revenue Million Forecast, by Production Analysis 2020 & 2033
- Table 26: Global IPM Pheromone Products Industry Revenue Million Forecast, by Consumption Analysis 2020 & 2033
- Table 27: Global IPM Pheromone Products Industry Revenue Million Forecast, by Import Market Analysis (Value & Volume) 2020 & 2033
- Table 28: Global IPM Pheromone Products Industry Revenue Million Forecast, by Export Market Analysis (Value & Volume) 2020 & 2033
- Table 29: Global IPM Pheromone Products Industry Revenue Million Forecast, by Price Trend Analysis 2020 & 2033
- Table 30: Global IPM Pheromone Products Industry Revenue Million Forecast, by Country 2020 & 2033
- Table 31: United Kingdom IPM Pheromone Products Industry Revenue (Million) Forecast, by Application 2020 & 2033
- Table 32: Germany IPM Pheromone Products Industry Revenue (Million) Forecast, by Application 2020 & 2033
- Table 33: France IPM Pheromone Products Industry Revenue (Million) Forecast, by Application 2020 & 2033
- Table 34: Italy IPM Pheromone Products Industry Revenue (Million) Forecast, by Application 2020 & 2033
- Table 35: Spain IPM Pheromone Products Industry Revenue (Million) Forecast, by Application 2020 & 2033
- Table 36: Russia IPM Pheromone Products Industry Revenue (Million) Forecast, by Application 2020 & 2033
- Table 37: Benelux IPM Pheromone Products Industry Revenue (Million) Forecast, by Application 2020 & 2033
- Table 38: Nordics IPM Pheromone Products Industry Revenue (Million) Forecast, by Application 2020 & 2033
- Table 39: Rest of Europe IPM Pheromone Products Industry Revenue (Million) Forecast, by Application 2020 & 2033
- Table 40: Global IPM Pheromone Products Industry Revenue Million Forecast, by Production Analysis 2020 & 2033
- Table 41: Global IPM Pheromone Products Industry Revenue Million Forecast, by Consumption Analysis 2020 & 2033
- Table 42: Global IPM Pheromone Products Industry Revenue Million Forecast, by Import Market Analysis (Value & Volume) 2020 & 2033
- Table 43: Global IPM Pheromone Products Industry Revenue Million Forecast, by Export Market Analysis (Value & Volume) 2020 & 2033
- Table 44: Global IPM Pheromone Products Industry Revenue Million Forecast, by Price Trend Analysis 2020 & 2033
- Table 45: Global IPM Pheromone Products Industry Revenue Million Forecast, by Country 2020 & 2033
- Table 46: Turkey IPM Pheromone Products Industry Revenue (Million) Forecast, by Application 2020 & 2033
- Table 47: Israel IPM Pheromone Products Industry Revenue (Million) Forecast, by Application 2020 & 2033
- Table 48: GCC IPM Pheromone Products Industry Revenue (Million) Forecast, by Application 2020 & 2033
- Table 49: North Africa IPM Pheromone Products Industry Revenue (Million) Forecast, by Application 2020 & 2033
- Table 50: South Africa IPM Pheromone Products Industry Revenue (Million) Forecast, by Application 2020 & 2033
- Table 51: Rest of Middle East & Africa IPM Pheromone Products Industry Revenue (Million) Forecast, by Application 2020 & 2033
- Table 52: Global IPM Pheromone Products Industry Revenue Million Forecast, by Production Analysis 2020 & 2033
- Table 53: Global IPM Pheromone Products Industry Revenue Million Forecast, by Consumption Analysis 2020 & 2033
- Table 54: Global IPM Pheromone Products Industry Revenue Million Forecast, by Import Market Analysis (Value & Volume) 2020 & 2033
- Table 55: Global IPM Pheromone Products Industry Revenue Million Forecast, by Export Market Analysis (Value & Volume) 2020 & 2033
- Table 56: Global IPM Pheromone Products Industry Revenue Million Forecast, by Price Trend Analysis 2020 & 2033
- Table 57: Global IPM Pheromone Products Industry Revenue Million Forecast, by Country 2020 & 2033
- Table 58: China IPM Pheromone Products Industry Revenue (Million) Forecast, by Application 2020 & 2033
- Table 59: India IPM Pheromone Products Industry Revenue (Million) Forecast, by Application 2020 & 2033
- Table 60: Japan IPM Pheromone Products Industry Revenue (Million) Forecast, by Application 2020 & 2033
- Table 61: South Korea IPM Pheromone Products Industry Revenue (Million) Forecast, by Application 2020 & 2033
- Table 62: ASEAN IPM Pheromone Products Industry Revenue (Million) Forecast, by Application 2020 & 2033
- Table 63: Oceania IPM Pheromone Products Industry Revenue (Million) Forecast, by Application 2020 & 2033
- Table 64: Rest of Asia Pacific IPM Pheromone Products Industry Revenue (Million) Forecast, by Application 2020 & 2033
Frequently Asked Questions
1. What is the projected Compound Annual Growth Rate (CAGR) of the IPM Pheromone Products Industry?
The projected CAGR is approximately 10.50%.
2. Which companies are prominent players in the IPM Pheromone Products Industry?
Key companies in the market include Russell IPM, Suterr, Syngenta Bioline, Pacific Biocontrol Corporation, ISCA Technologies, Shin-Etsu, Hercon Environmental, Sumi Agro France, Isagro, BASF SE.
3. What are the main segments of the IPM Pheromone Products Industry?
The market segments include Production Analysis, Consumption Analysis, Import Market Analysis (Value & Volume), Export Market Analysis (Value & Volume), Price Trend Analysis.
4. Can you provide details about the market size?
The market size is estimated to be USD 1.02 Million as of 2022.
5. What are some drivers contributing to market growth?
Decreasing Per Capita Arable Land; Increased Demand for Food.
6. What are the notable trends driving market growth?
Strong Demand for High-Value Crops.
7. Are there any restraints impacting market growth?
High Initial Investments; Requirement of Precision Agriculture.
8. Can you provide examples of recent developments in the market?
N/A
9. What pricing options are available for accessing the report?
Pricing options include single-user, multi-user, and enterprise licenses priced at USD 3800, USD 4500, and USD 5800 respectively.
10. Is the market size provided in terms of value or volume?
The market size is provided in terms of value, measured in Million.
11. Are there any specific market keywords associated with the report?
Yes, the market keyword associated with the report is "IPM Pheromone Products Industry," which aids in identifying and referencing the specific market segment covered.
12. How do I determine which pricing option suits my needs best?
The pricing options vary based on user requirements and access needs. Individual users may opt for single-user licenses, while businesses requiring broader access may choose multi-user or enterprise licenses for cost-effective access to the report.
13. Are there any additional resources or data provided in the IPM Pheromone Products Industry report?
While the report offers comprehensive insights, it's advisable to review the specific contents or supplementary materials provided to ascertain if additional resources or data are available.
14. How can I stay updated on further developments or reports in the IPM Pheromone Products Industry?
To stay informed about further developments, trends, and reports in the IPM Pheromone Products Industry, consider subscribing to industry newsletters, following relevant companies and organizations, or regularly checking reputable industry news sources and publications.
Methodology
Step 1 - Identification of Relevant Samples Size from Population Database


Step 2 - Approaches for Defining Global Market Size (Value, Volume* & Price*)

Note*: In applicable scenarios
Step 3 - Data Sources
Primary Research
- Web Analytics
- Survey Reports
- Research Institute
- Latest Research Reports
- Opinion Leaders
Secondary Research
- Annual Reports
- White Paper
- Latest Press Release
- Industry Association
- Paid Database
- Investor Presentations

Step 4 - Data Triangulation
Involves using different sources of information in order to increase the validity of a study
These sources are likely to be stakeholders in a program - participants, other researchers, program staff, other community members, and so on.
Then we put all data in single framework & apply various statistical tools to find out the dynamic on the market.
During the analysis stage, feedback from the stakeholder groups would be compared to determine areas of agreement as well as areas of divergence