

Key Insights
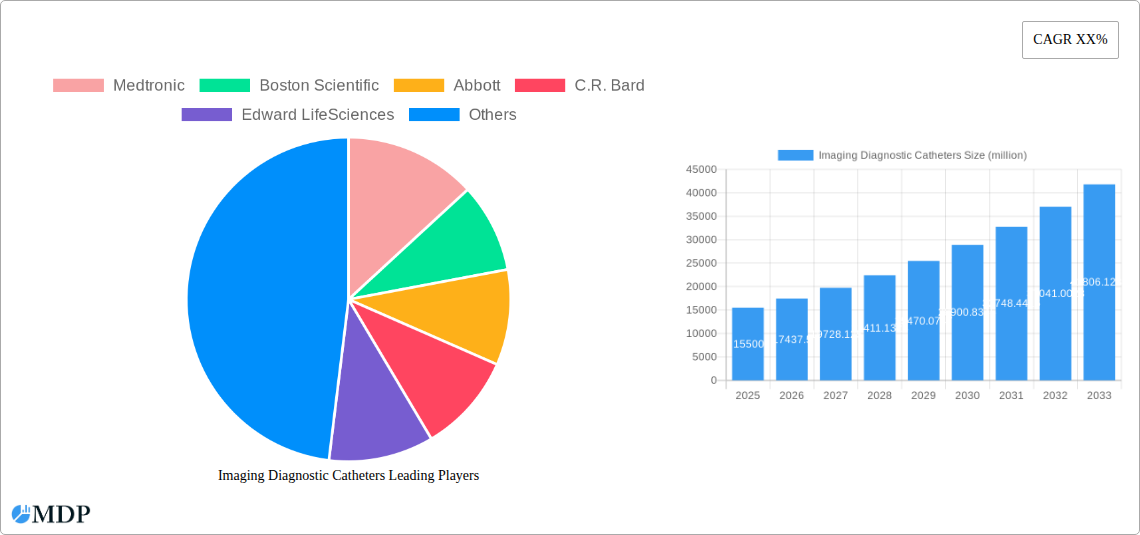
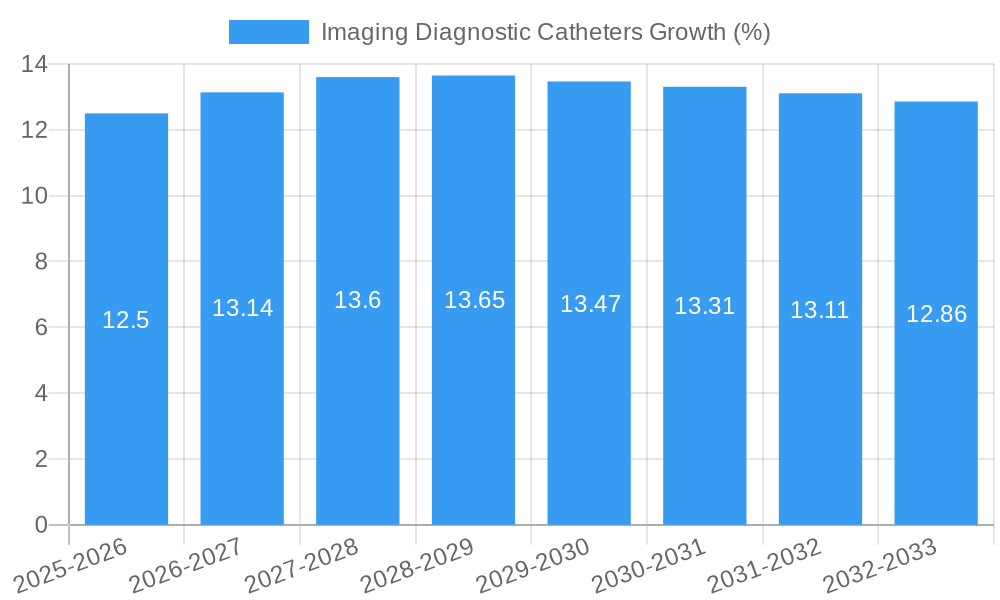
The Imaging Diagnostic Catheters market is poised for substantial growth, projected to reach an estimated USD 15,500 million by 2025, with a robust Compound Annual Growth Rate (CAGR) of 12.5% forecasted from 2025 to 2033. This expansion is primarily driven by the increasing prevalence of chronic diseases, a growing aging population with a higher susceptibility to cardiovascular and neurological conditions, and the continuous technological advancements in catheter design and imaging modalities. Innovations such as miniaturized sensors, enhanced flexibility, and improved biocompatibility are enabling less invasive diagnostic procedures, leading to better patient outcomes and reduced recovery times. The rising demand for early and accurate diagnosis of conditions like coronary artery disease, cerebrovascular disorders, and cardiac arrhythmias further fuels market penetration. Furthermore, the expanding healthcare infrastructure, particularly in emerging economies, and increased healthcare expenditure are creating new opportunities for market players. The competitive landscape is characterized by key players like Medtronic, Boston Scientific, and Abbott, who are actively engaged in research and development, strategic partnerships, and product launches to capture a larger market share.
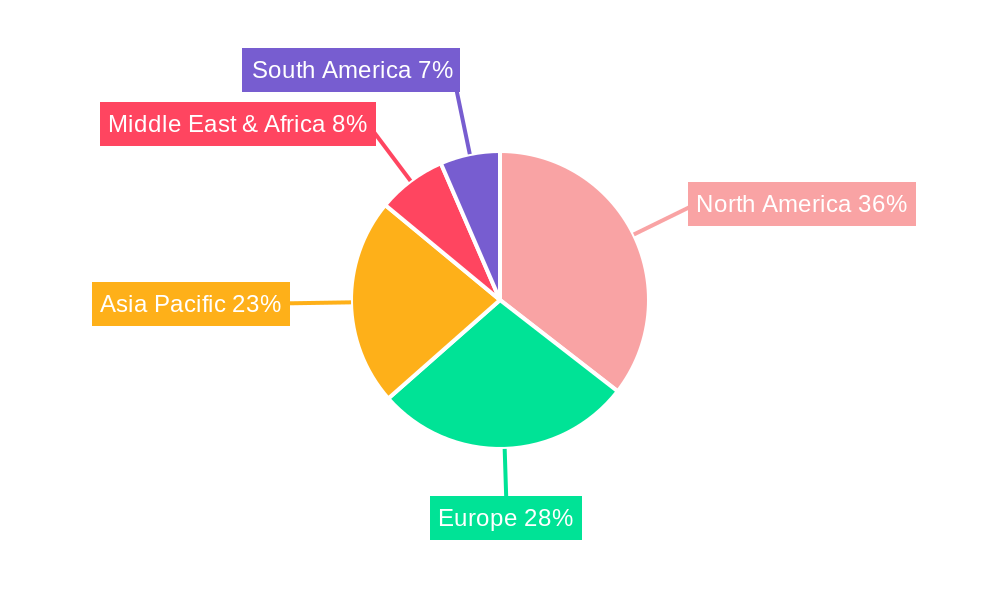
The market is segmented into various applications, with Hospitals accounting for the largest share due to their comprehensive diagnostic capabilities and infrastructure. Imaging & Diagnostic Centers are also significant contributors, driven by specialized imaging services. The "Other" application segment, encompassing research institutions and specialized clinics, is expected to witness steady growth. In terms of types, Angiography Catheters are currently the dominant segment, owing to their widespread use in visualizing blood vessels. However, Ultrasound Catheters and OCT (Optical Coherence Tomography) Catheters are gaining traction due to their superior resolution and ability to provide detailed tissue characterization. Electrophysiology (EP) Catheters are also witnessing steady demand for diagnosing and treating complex heart rhythm disorders. Geographically, North America currently leads the market, driven by advanced healthcare systems and high adoption rates of new technologies. Asia Pacific is anticipated to exhibit the fastest growth, fueled by increasing healthcare investments, a large patient pool, and a growing focus on diagnostic imaging. Restraints include the high cost of advanced imaging diagnostic catheters and the need for specialized training for their effective use, alongside stringent regulatory approvals.
Here is an SEO-optimized and engaging report description for Imaging Diagnostic Catheters, ready for immediate use:
Imaging Diagnostic Catheters Market Dynamics & Concentration
The global Imaging Diagnostic Catheters market is experiencing a moderate level of concentration, with key players such as Medtronic, Boston Scientific, Abbott, C.R. Bard, Edward Life Sciences, Johnson & Johnson, Cardinal Health, Terumo Corporation, Koninklijke Philips, and B. Braun Melsungen holding significant market share. Innovation is a primary driver, fueled by advancements in imaging technologies and minimally invasive procedures. The market is shaped by stringent regulatory frameworks, requiring extensive testing and approval processes for new catheter designs. Product substitutes, while present in some diagnostic areas, are largely outcompeted by the specificity and efficacy of advanced imaging catheters. End-user trends are leaning towards smaller, more steerable, and higher-resolution catheters, driven by the increasing demand for precision in cardiovascular, neurological, and interventional radiology procedures. Mergers and acquisitions (M&A) are active, with approximately 15 significant deals anticipated throughout the forecast period, aimed at consolidating portfolios and expanding technological capabilities. The market share of the top five players is estimated to be around 65 million.
Imaging Diagnostic Catheters Industry Trends & Analysis
The Imaging Diagnostic Catheters market is poised for robust expansion, driven by an escalating prevalence of chronic diseases and an increasing preference for minimally invasive diagnostic and therapeutic interventions. The estimated Compound Annual Growth Rate (CAGR) for the forecast period (2025-2033) stands at an impressive 7.8%, projecting the market value to reach approximately 25,000 million by 2033. This growth is underpinned by significant technological disruptions, including the integration of artificial intelligence (AI) for enhanced image analysis and catheter navigation, the development of smaller and more flexible catheter designs for improved patient comfort and access to challenging anatomical regions, and the increasing use of advanced materials that offer superior biocompatibility and radiopacity. Consumer preferences are increasingly dictating product development, with a strong emphasis on patient safety, reduced procedure times, and faster recovery. The competitive dynamics are characterized by continuous innovation, strategic collaborations between catheter manufacturers and imaging equipment providers, and a growing emphasis on cost-effectiveness within healthcare systems. Market penetration is expected to rise significantly, particularly in emerging economies, as healthcare infrastructure improves and access to advanced diagnostic tools becomes more widespread.
Leading Markets & Segments in Imaging Diagnostic Catheters
The Hospitals segment is projected to dominate the Imaging Diagnostic Catheters market throughout the forecast period, driven by the high volume of diagnostic and interventional procedures performed within these institutions. This dominance is further supported by the increasing adoption of advanced medical technologies and a greater focus on interventional cardiology and radiology. Within the Application segmentation, Hospitals are expected to capture a market share of approximately 70 million.
- Key Drivers for Hospital Dominance:
- Technological Integration: Hospitals are early adopters of new imaging technologies and minimally invasive devices.
- Reimbursement Policies: Favorable reimbursement structures for diagnostic and interventional procedures encourage the use of advanced catheters.
- Skilled Workforce: The presence of specialized medical professionals trained in catheter-based interventions.
- Comprehensive Healthcare Infrastructure: Hospitals offer a complete ecosystem for patient care, from diagnosis to treatment and recovery.
In terms of Types, Angiography Catheters are anticipated to maintain their leading position due to their widespread use in diagnosing and treating cardiovascular diseases, a major global health concern. The estimated market share for Angiography Catheters is approximately 60 million.
- Key Drivers for Angiography Catheter Dominance:
- High Prevalence of Cardiovascular Diseases: A persistent and growing global burden of heart conditions necessitates regular diagnostic angiography.
- Advancements in PCI and Stenting: Innovations in percutaneous coronary intervention (PCI) and stenting procedures rely heavily on advanced angiography catheters.
- Minimally Invasive Nature: Angiography offers a less invasive alternative to open surgery, leading to faster patient recovery.
- Increasing Demand for Diagnostic Imaging: Growing awareness and early diagnosis of vascular issues contribute to sustained demand.
Geographically, North America is expected to lead the Imaging Diagnostic Catheters market, followed closely by Europe. This regional dominance is attributed to a well-established healthcare infrastructure, high per capita healthcare spending, strong research and development initiatives, and the early adoption of advanced medical technologies.
Imaging Diagnostic Catheters Product Developments
Ongoing product developments in Imaging Diagnostic Catheters are focused on enhancing imaging resolution, improving navigability in complex anatomies, and increasing patient safety. Innovations include the integration of micro-catheters with advanced imaging modalities like optical coherence tomography (OCT) and intravascular ultrasound (IVUS) for real-time visualization during interventions. Furthermore, the development of advanced materials for better biocompatibility and reduced thrombogenicity, alongside user-friendly designs for enhanced procedural efficiency, are key trends. These advancements contribute significantly to the competitive advantage of manufacturers by enabling more precise diagnoses and less invasive treatments, ultimately improving patient outcomes. The market is witnessing a steady stream of product launches, with an estimated 50 new product introductions planned over the forecast period.
Key Drivers of Imaging Diagnostic Catheters Growth
The growth of the Imaging Diagnostic Catheters market is propelled by several key factors. Technologically, advancements in miniaturization and imaging resolution are enabling more precise diagnoses in complex anatomies. Economically, rising healthcare expenditure globally and a growing demand for minimally invasive procedures, which often utilize diagnostic catheters, are significant drivers. Regulatory bodies, while stringent, are also facilitating the approval of innovative devices that demonstrate clear clinical benefits. The increasing prevalence of chronic diseases, particularly cardiovascular and neurological conditions, further fuels the demand for advanced diagnostic tools. The market is also benefiting from expanded reimbursement coverage for interventional procedures across various regions, making these technologies more accessible to a wider patient population. The market value is projected to increase by approximately 8,000 million during the forecast period due to these drivers.
Challenges in the Imaging Diagnostic Catheters Market
Despite the promising growth trajectory, the Imaging Diagnostic Catheters market faces several challenges. Stringent regulatory hurdles and lengthy approval processes for new devices can impede market entry and innovation speed, impacting the time-to-market for novel products. High manufacturing costs associated with advanced materials and sophisticated imaging components can lead to increased product pricing, potentially limiting accessibility in price-sensitive markets. Intense competition among established players and emerging manufacturers can create pricing pressures and necessitate continuous investment in R&D to maintain a competitive edge. Furthermore, supply chain disruptions, as witnessed in recent global events, can impact the availability of raw materials and finished products, potentially leading to delays and increased costs. These challenges collectively create a complex operating environment for market participants.
Emerging Opportunities in Imaging Diagnostic Catheters
Emerging opportunities in the Imaging Diagnostic Catheters market are centered around significant technological breakthroughs and strategic market expansion. The integration of AI and machine learning for real-time image analysis and predictive diagnostics presents a substantial avenue for growth, offering enhanced accuracy and efficiency. The development of biodegradable and smart catheters that can deliver therapies or monitor physiological parameters post-procedure opens new frontiers. Furthermore, strategic partnerships between catheter manufacturers, imaging equipment providers, and research institutions can accelerate innovation and market penetration. Expansion into emerging economies with growing healthcare infrastructure and increasing patient awareness offers untapped market potential. The focus on personalized medicine and minimally invasive interventions will continue to drive the demand for highly specialized and advanced diagnostic catheters, creating sustained growth catalysts.
Leading Players in the Imaging Diagnostic Catheters Sector
- Medtronic
- Boston Scientific
- Abbott
- C.R. Bard
- Edward LifeSciences
- Johnson & Johnson
- Cardinal Health
- Terumo Corporation
- Koninklijke Philips
- B. Braun Melsungen
Key Milestones in Imaging Diagnostic Catheters Industry
- 2019: Launch of next-generation angiography catheters with enhanced steerability and torque control.
- 2020: Significant advancements in micro-catheter technology enabling access to smaller and more tortuous vessels.
- 2021: Increased focus on the development of AI-powered imaging catheters for improved diagnostic accuracy.
- 2022: Regulatory approvals for novel OCT catheters, enhancing visualization for interventional procedures.
- 2023: Strategic acquisitions aimed at consolidating market share and expanding product portfolios in electrophysiology.
- 2024: Introduction of biodegradable catheter materials for reduced environmental impact and improved patient outcomes.
- 2025 (Estimated): Expected launch of fully integrated ultrasound and angiography catheters for comprehensive intra-vascular assessment.
Strategic Outlook for Imaging Diagnostic Catheters Market
The strategic outlook for the Imaging Diagnostic Catheters market remains exceptionally positive, driven by a confluence of innovation, increasing healthcare investments, and a global shift towards minimally invasive procedures. Future growth will be accelerated by the deeper integration of AI and machine learning for enhanced diagnostic precision and procedural efficiency. The development of specialized catheters for emerging therapeutic areas and complex anatomies will open new market segments. Strategic collaborations between key industry players and a focus on expanding access to advanced diagnostics in underserved regions will be crucial. The market is well-positioned to capitalize on the persistent demand for effective cardiovascular, neurological, and interventional radiology tools, ensuring sustained expansion and value creation throughout the forecast period, with an estimated market value of 25,000 million by 2033.
Imaging Diagnostic Catheters Segmentation
-
1. Application
- 1.1. Hospitals
- 1.2. Imaging & Diagnostic Centers
- 1.3. Other
-
2. Types
- 2.1. Angiography Catheters
- 2.2. Ultrasound Catheters
- 2.3. OCT Catheters
- 2.4. Electrophysiology (EP) Catheters
- 2.5. Other
Imaging Diagnostic Catheters Segmentation By Geography
-
1. North America
- 1.1. United States
- 1.2. Canada
- 1.3. Mexico
-
2. South America
- 2.1. Brazil
- 2.2. Argentina
- 2.3. Rest of South America
-
3. Europe
- 3.1. United Kingdom
- 3.2. Germany
- 3.3. France
- 3.4. Italy
- 3.5. Spain
- 3.6. Russia
- 3.7. Benelux
- 3.8. Nordics
- 3.9. Rest of Europe
-
4. Middle East & Africa
- 4.1. Turkey
- 4.2. Israel
- 4.3. GCC
- 4.4. North Africa
- 4.5. South Africa
- 4.6. Rest of Middle East & Africa
-
5. Asia Pacific
- 5.1. China
- 5.2. India
- 5.3. Japan
- 5.4. South Korea
- 5.5. ASEAN
- 5.6. Oceania
- 5.7. Rest of Asia Pacific
Imaging Diagnostic Catheters REPORT HIGHLIGHTS
| Aspects | Details |
|---|---|
| Study Period | 2019-2033 |
| Base Year | 2024 |
| Estimated Year | 2025 |
| Forecast Period | 2025-2033 |
| Historical Period | 2019-2024 |
| Growth Rate | CAGR of XX% from 2019-2033 |
| Segmentation |
|
Table of Contents
- 1. Introduction
- 1.1. Research Scope
- 1.2. Market Segmentation
- 1.3. Research Methodology
- 1.4. Definitions and Assumptions
- 2. Executive Summary
- 2.1. Introduction
- 3. Market Dynamics
- 3.1. Introduction
- 3.2. Market Drivers
- 3.3. Market Restrains
- 3.4. Market Trends
- 4. Market Factor Analysis
- 4.1. Porters Five Forces
- 4.2. Supply/Value Chain
- 4.3. PESTEL analysis
- 4.4. Market Entropy
- 4.5. Patent/Trademark Analysis
- 5. Global Imaging Diagnostic Catheters Analysis, Insights and Forecast, 2019-2031
- 5.1. Market Analysis, Insights and Forecast - by Application
- 5.1.1. Hospitals
- 5.1.2. Imaging & Diagnostic Centers
- 5.1.3. Other
- 5.2. Market Analysis, Insights and Forecast - by Types
- 5.2.1. Angiography Catheters
- 5.2.2. Ultrasound Catheters
- 5.2.3. OCT Catheters
- 5.2.4. Electrophysiology (EP) Catheters
- 5.2.5. Other
- 5.3. Market Analysis, Insights and Forecast - by Region
- 5.3.1. North America
- 5.3.2. South America
- 5.3.3. Europe
- 5.3.4. Middle East & Africa
- 5.3.5. Asia Pacific
- 5.1. Market Analysis, Insights and Forecast - by Application
- 6. North America Imaging Diagnostic Catheters Analysis, Insights and Forecast, 2019-2031
- 6.1. Market Analysis, Insights and Forecast - by Application
- 6.1.1. Hospitals
- 6.1.2. Imaging & Diagnostic Centers
- 6.1.3. Other
- 6.2. Market Analysis, Insights and Forecast - by Types
- 6.2.1. Angiography Catheters
- 6.2.2. Ultrasound Catheters
- 6.2.3. OCT Catheters
- 6.2.4. Electrophysiology (EP) Catheters
- 6.2.5. Other
- 6.1. Market Analysis, Insights and Forecast - by Application
- 7. South America Imaging Diagnostic Catheters Analysis, Insights and Forecast, 2019-2031
- 7.1. Market Analysis, Insights and Forecast - by Application
- 7.1.1. Hospitals
- 7.1.2. Imaging & Diagnostic Centers
- 7.1.3. Other
- 7.2. Market Analysis, Insights and Forecast - by Types
- 7.2.1. Angiography Catheters
- 7.2.2. Ultrasound Catheters
- 7.2.3. OCT Catheters
- 7.2.4. Electrophysiology (EP) Catheters
- 7.2.5. Other
- 7.1. Market Analysis, Insights and Forecast - by Application
- 8. Europe Imaging Diagnostic Catheters Analysis, Insights and Forecast, 2019-2031
- 8.1. Market Analysis, Insights and Forecast - by Application
- 8.1.1. Hospitals
- 8.1.2. Imaging & Diagnostic Centers
- 8.1.3. Other
- 8.2. Market Analysis, Insights and Forecast - by Types
- 8.2.1. Angiography Catheters
- 8.2.2. Ultrasound Catheters
- 8.2.3. OCT Catheters
- 8.2.4. Electrophysiology (EP) Catheters
- 8.2.5. Other
- 8.1. Market Analysis, Insights and Forecast - by Application
- 9. Middle East & Africa Imaging Diagnostic Catheters Analysis, Insights and Forecast, 2019-2031
- 9.1. Market Analysis, Insights and Forecast - by Application
- 9.1.1. Hospitals
- 9.1.2. Imaging & Diagnostic Centers
- 9.1.3. Other
- 9.2. Market Analysis, Insights and Forecast - by Types
- 9.2.1. Angiography Catheters
- 9.2.2. Ultrasound Catheters
- 9.2.3. OCT Catheters
- 9.2.4. Electrophysiology (EP) Catheters
- 9.2.5. Other
- 9.1. Market Analysis, Insights and Forecast - by Application
- 10. Asia Pacific Imaging Diagnostic Catheters Analysis, Insights and Forecast, 2019-2031
- 10.1. Market Analysis, Insights and Forecast - by Application
- 10.1.1. Hospitals
- 10.1.2. Imaging & Diagnostic Centers
- 10.1.3. Other
- 10.2. Market Analysis, Insights and Forecast - by Types
- 10.2.1. Angiography Catheters
- 10.2.2. Ultrasound Catheters
- 10.2.3. OCT Catheters
- 10.2.4. Electrophysiology (EP) Catheters
- 10.2.5. Other
- 10.1. Market Analysis, Insights and Forecast - by Application
- 11. Competitive Analysis
- 11.1. Global Market Share Analysis 2024
- 11.2. Company Profiles
- 11.2.1 Medtronic
- 11.2.1.1. Overview
- 11.2.1.2. Products
- 11.2.1.3. SWOT Analysis
- 11.2.1.4. Recent Developments
- 11.2.1.5. Financials (Based on Availability)
- 11.2.2 Boston Scientific
- 11.2.2.1. Overview
- 11.2.2.2. Products
- 11.2.2.3. SWOT Analysis
- 11.2.2.4. Recent Developments
- 11.2.2.5. Financials (Based on Availability)
- 11.2.3 Abbott
- 11.2.3.1. Overview
- 11.2.3.2. Products
- 11.2.3.3. SWOT Analysis
- 11.2.3.4. Recent Developments
- 11.2.3.5. Financials (Based on Availability)
- 11.2.4 C.R. Bard
- 11.2.4.1. Overview
- 11.2.4.2. Products
- 11.2.4.3. SWOT Analysis
- 11.2.4.4. Recent Developments
- 11.2.4.5. Financials (Based on Availability)
- 11.2.5 Edward LifeSciences
- 11.2.5.1. Overview
- 11.2.5.2. Products
- 11.2.5.3. SWOT Analysis
- 11.2.5.4. Recent Developments
- 11.2.5.5. Financials (Based on Availability)
- 11.2.6 Johnson & Johnson
- 11.2.6.1. Overview
- 11.2.6.2. Products
- 11.2.6.3. SWOT Analysis
- 11.2.6.4. Recent Developments
- 11.2.6.5. Financials (Based on Availability)
- 11.2.7 Cardinal Health
- 11.2.7.1. Overview
- 11.2.7.2. Products
- 11.2.7.3. SWOT Analysis
- 11.2.7.4. Recent Developments
- 11.2.7.5. Financials (Based on Availability)
- 11.2.8 Terumo Corporation
- 11.2.8.1. Overview
- 11.2.8.2. Products
- 11.2.8.3. SWOT Analysis
- 11.2.8.4. Recent Developments
- 11.2.8.5. Financials (Based on Availability)
- 11.2.9 Koninklijke Philips
- 11.2.9.1. Overview
- 11.2.9.2. Products
- 11.2.9.3. SWOT Analysis
- 11.2.9.4. Recent Developments
- 11.2.9.5. Financials (Based on Availability)
- 11.2.10 B. Braun Melsungen
- 11.2.10.1. Overview
- 11.2.10.2. Products
- 11.2.10.3. SWOT Analysis
- 11.2.10.4. Recent Developments
- 11.2.10.5. Financials (Based on Availability)
- 11.2.1 Medtronic
List of Figures
- Figure 1: Global Imaging Diagnostic Catheters Revenue Breakdown (million, %) by Region 2024 & 2032
- Figure 2: Global Imaging Diagnostic Catheters Volume Breakdown (K, %) by Region 2024 & 2032
- Figure 3: North America Imaging Diagnostic Catheters Revenue (million), by Application 2024 & 2032
- Figure 4: North America Imaging Diagnostic Catheters Volume (K), by Application 2024 & 2032
- Figure 5: North America Imaging Diagnostic Catheters Revenue Share (%), by Application 2024 & 2032
- Figure 6: North America Imaging Diagnostic Catheters Volume Share (%), by Application 2024 & 2032
- Figure 7: North America Imaging Diagnostic Catheters Revenue (million), by Types 2024 & 2032
- Figure 8: North America Imaging Diagnostic Catheters Volume (K), by Types 2024 & 2032
- Figure 9: North America Imaging Diagnostic Catheters Revenue Share (%), by Types 2024 & 2032
- Figure 10: North America Imaging Diagnostic Catheters Volume Share (%), by Types 2024 & 2032
- Figure 11: North America Imaging Diagnostic Catheters Revenue (million), by Country 2024 & 2032
- Figure 12: North America Imaging Diagnostic Catheters Volume (K), by Country 2024 & 2032
- Figure 13: North America Imaging Diagnostic Catheters Revenue Share (%), by Country 2024 & 2032
- Figure 14: North America Imaging Diagnostic Catheters Volume Share (%), by Country 2024 & 2032
- Figure 15: South America Imaging Diagnostic Catheters Revenue (million), by Application 2024 & 2032
- Figure 16: South America Imaging Diagnostic Catheters Volume (K), by Application 2024 & 2032
- Figure 17: South America Imaging Diagnostic Catheters Revenue Share (%), by Application 2024 & 2032
- Figure 18: South America Imaging Diagnostic Catheters Volume Share (%), by Application 2024 & 2032
- Figure 19: South America Imaging Diagnostic Catheters Revenue (million), by Types 2024 & 2032
- Figure 20: South America Imaging Diagnostic Catheters Volume (K), by Types 2024 & 2032
- Figure 21: South America Imaging Diagnostic Catheters Revenue Share (%), by Types 2024 & 2032
- Figure 22: South America Imaging Diagnostic Catheters Volume Share (%), by Types 2024 & 2032
- Figure 23: South America Imaging Diagnostic Catheters Revenue (million), by Country 2024 & 2032
- Figure 24: South America Imaging Diagnostic Catheters Volume (K), by Country 2024 & 2032
- Figure 25: South America Imaging Diagnostic Catheters Revenue Share (%), by Country 2024 & 2032
- Figure 26: South America Imaging Diagnostic Catheters Volume Share (%), by Country 2024 & 2032
- Figure 27: Europe Imaging Diagnostic Catheters Revenue (million), by Application 2024 & 2032
- Figure 28: Europe Imaging Diagnostic Catheters Volume (K), by Application 2024 & 2032
- Figure 29: Europe Imaging Diagnostic Catheters Revenue Share (%), by Application 2024 & 2032
- Figure 30: Europe Imaging Diagnostic Catheters Volume Share (%), by Application 2024 & 2032
- Figure 31: Europe Imaging Diagnostic Catheters Revenue (million), by Types 2024 & 2032
- Figure 32: Europe Imaging Diagnostic Catheters Volume (K), by Types 2024 & 2032
- Figure 33: Europe Imaging Diagnostic Catheters Revenue Share (%), by Types 2024 & 2032
- Figure 34: Europe Imaging Diagnostic Catheters Volume Share (%), by Types 2024 & 2032
- Figure 35: Europe Imaging Diagnostic Catheters Revenue (million), by Country 2024 & 2032
- Figure 36: Europe Imaging Diagnostic Catheters Volume (K), by Country 2024 & 2032
- Figure 37: Europe Imaging Diagnostic Catheters Revenue Share (%), by Country 2024 & 2032
- Figure 38: Europe Imaging Diagnostic Catheters Volume Share (%), by Country 2024 & 2032
- Figure 39: Middle East & Africa Imaging Diagnostic Catheters Revenue (million), by Application 2024 & 2032
- Figure 40: Middle East & Africa Imaging Diagnostic Catheters Volume (K), by Application 2024 & 2032
- Figure 41: Middle East & Africa Imaging Diagnostic Catheters Revenue Share (%), by Application 2024 & 2032
- Figure 42: Middle East & Africa Imaging Diagnostic Catheters Volume Share (%), by Application 2024 & 2032
- Figure 43: Middle East & Africa Imaging Diagnostic Catheters Revenue (million), by Types 2024 & 2032
- Figure 44: Middle East & Africa Imaging Diagnostic Catheters Volume (K), by Types 2024 & 2032
- Figure 45: Middle East & Africa Imaging Diagnostic Catheters Revenue Share (%), by Types 2024 & 2032
- Figure 46: Middle East & Africa Imaging Diagnostic Catheters Volume Share (%), by Types 2024 & 2032
- Figure 47: Middle East & Africa Imaging Diagnostic Catheters Revenue (million), by Country 2024 & 2032
- Figure 48: Middle East & Africa Imaging Diagnostic Catheters Volume (K), by Country 2024 & 2032
- Figure 49: Middle East & Africa Imaging Diagnostic Catheters Revenue Share (%), by Country 2024 & 2032
- Figure 50: Middle East & Africa Imaging Diagnostic Catheters Volume Share (%), by Country 2024 & 2032
- Figure 51: Asia Pacific Imaging Diagnostic Catheters Revenue (million), by Application 2024 & 2032
- Figure 52: Asia Pacific Imaging Diagnostic Catheters Volume (K), by Application 2024 & 2032
- Figure 53: Asia Pacific Imaging Diagnostic Catheters Revenue Share (%), by Application 2024 & 2032
- Figure 54: Asia Pacific Imaging Diagnostic Catheters Volume Share (%), by Application 2024 & 2032
- Figure 55: Asia Pacific Imaging Diagnostic Catheters Revenue (million), by Types 2024 & 2032
- Figure 56: Asia Pacific Imaging Diagnostic Catheters Volume (K), by Types 2024 & 2032
- Figure 57: Asia Pacific Imaging Diagnostic Catheters Revenue Share (%), by Types 2024 & 2032
- Figure 58: Asia Pacific Imaging Diagnostic Catheters Volume Share (%), by Types 2024 & 2032
- Figure 59: Asia Pacific Imaging Diagnostic Catheters Revenue (million), by Country 2024 & 2032
- Figure 60: Asia Pacific Imaging Diagnostic Catheters Volume (K), by Country 2024 & 2032
- Figure 61: Asia Pacific Imaging Diagnostic Catheters Revenue Share (%), by Country 2024 & 2032
- Figure 62: Asia Pacific Imaging Diagnostic Catheters Volume Share (%), by Country 2024 & 2032
List of Tables
- Table 1: Global Imaging Diagnostic Catheters Revenue million Forecast, by Region 2019 & 2032
- Table 2: Global Imaging Diagnostic Catheters Volume K Forecast, by Region 2019 & 2032
- Table 3: Global Imaging Diagnostic Catheters Revenue million Forecast, by Application 2019 & 2032
- Table 4: Global Imaging Diagnostic Catheters Volume K Forecast, by Application 2019 & 2032
- Table 5: Global Imaging Diagnostic Catheters Revenue million Forecast, by Types 2019 & 2032
- Table 6: Global Imaging Diagnostic Catheters Volume K Forecast, by Types 2019 & 2032
- Table 7: Global Imaging Diagnostic Catheters Revenue million Forecast, by Region 2019 & 2032
- Table 8: Global Imaging Diagnostic Catheters Volume K Forecast, by Region 2019 & 2032
- Table 9: Global Imaging Diagnostic Catheters Revenue million Forecast, by Application 2019 & 2032
- Table 10: Global Imaging Diagnostic Catheters Volume K Forecast, by Application 2019 & 2032
- Table 11: Global Imaging Diagnostic Catheters Revenue million Forecast, by Types 2019 & 2032
- Table 12: Global Imaging Diagnostic Catheters Volume K Forecast, by Types 2019 & 2032
- Table 13: Global Imaging Diagnostic Catheters Revenue million Forecast, by Country 2019 & 2032
- Table 14: Global Imaging Diagnostic Catheters Volume K Forecast, by Country 2019 & 2032
- Table 15: United States Imaging Diagnostic Catheters Revenue (million) Forecast, by Application 2019 & 2032
- Table 16: United States Imaging Diagnostic Catheters Volume (K) Forecast, by Application 2019 & 2032
- Table 17: Canada Imaging Diagnostic Catheters Revenue (million) Forecast, by Application 2019 & 2032
- Table 18: Canada Imaging Diagnostic Catheters Volume (K) Forecast, by Application 2019 & 2032
- Table 19: Mexico Imaging Diagnostic Catheters Revenue (million) Forecast, by Application 2019 & 2032
- Table 20: Mexico Imaging Diagnostic Catheters Volume (K) Forecast, by Application 2019 & 2032
- Table 21: Global Imaging Diagnostic Catheters Revenue million Forecast, by Application 2019 & 2032
- Table 22: Global Imaging Diagnostic Catheters Volume K Forecast, by Application 2019 & 2032
- Table 23: Global Imaging Diagnostic Catheters Revenue million Forecast, by Types 2019 & 2032
- Table 24: Global Imaging Diagnostic Catheters Volume K Forecast, by Types 2019 & 2032
- Table 25: Global Imaging Diagnostic Catheters Revenue million Forecast, by Country 2019 & 2032
- Table 26: Global Imaging Diagnostic Catheters Volume K Forecast, by Country 2019 & 2032
- Table 27: Brazil Imaging Diagnostic Catheters Revenue (million) Forecast, by Application 2019 & 2032
- Table 28: Brazil Imaging Diagnostic Catheters Volume (K) Forecast, by Application 2019 & 2032
- Table 29: Argentina Imaging Diagnostic Catheters Revenue (million) Forecast, by Application 2019 & 2032
- Table 30: Argentina Imaging Diagnostic Catheters Volume (K) Forecast, by Application 2019 & 2032
- Table 31: Rest of South America Imaging Diagnostic Catheters Revenue (million) Forecast, by Application 2019 & 2032
- Table 32: Rest of South America Imaging Diagnostic Catheters Volume (K) Forecast, by Application 2019 & 2032
- Table 33: Global Imaging Diagnostic Catheters Revenue million Forecast, by Application 2019 & 2032
- Table 34: Global Imaging Diagnostic Catheters Volume K Forecast, by Application 2019 & 2032
- Table 35: Global Imaging Diagnostic Catheters Revenue million Forecast, by Types 2019 & 2032
- Table 36: Global Imaging Diagnostic Catheters Volume K Forecast, by Types 2019 & 2032
- Table 37: Global Imaging Diagnostic Catheters Revenue million Forecast, by Country 2019 & 2032
- Table 38: Global Imaging Diagnostic Catheters Volume K Forecast, by Country 2019 & 2032
- Table 39: United Kingdom Imaging Diagnostic Catheters Revenue (million) Forecast, by Application 2019 & 2032
- Table 40: United Kingdom Imaging Diagnostic Catheters Volume (K) Forecast, by Application 2019 & 2032
- Table 41: Germany Imaging Diagnostic Catheters Revenue (million) Forecast, by Application 2019 & 2032
- Table 42: Germany Imaging Diagnostic Catheters Volume (K) Forecast, by Application 2019 & 2032
- Table 43: France Imaging Diagnostic Catheters Revenue (million) Forecast, by Application 2019 & 2032
- Table 44: France Imaging Diagnostic Catheters Volume (K) Forecast, by Application 2019 & 2032
- Table 45: Italy Imaging Diagnostic Catheters Revenue (million) Forecast, by Application 2019 & 2032
- Table 46: Italy Imaging Diagnostic Catheters Volume (K) Forecast, by Application 2019 & 2032
- Table 47: Spain Imaging Diagnostic Catheters Revenue (million) Forecast, by Application 2019 & 2032
- Table 48: Spain Imaging Diagnostic Catheters Volume (K) Forecast, by Application 2019 & 2032
- Table 49: Russia Imaging Diagnostic Catheters Revenue (million) Forecast, by Application 2019 & 2032
- Table 50: Russia Imaging Diagnostic Catheters Volume (K) Forecast, by Application 2019 & 2032
- Table 51: Benelux Imaging Diagnostic Catheters Revenue (million) Forecast, by Application 2019 & 2032
- Table 52: Benelux Imaging Diagnostic Catheters Volume (K) Forecast, by Application 2019 & 2032
- Table 53: Nordics Imaging Diagnostic Catheters Revenue (million) Forecast, by Application 2019 & 2032
- Table 54: Nordics Imaging Diagnostic Catheters Volume (K) Forecast, by Application 2019 & 2032
- Table 55: Rest of Europe Imaging Diagnostic Catheters Revenue (million) Forecast, by Application 2019 & 2032
- Table 56: Rest of Europe Imaging Diagnostic Catheters Volume (K) Forecast, by Application 2019 & 2032
- Table 57: Global Imaging Diagnostic Catheters Revenue million Forecast, by Application 2019 & 2032
- Table 58: Global Imaging Diagnostic Catheters Volume K Forecast, by Application 2019 & 2032
- Table 59: Global Imaging Diagnostic Catheters Revenue million Forecast, by Types 2019 & 2032
- Table 60: Global Imaging Diagnostic Catheters Volume K Forecast, by Types 2019 & 2032
- Table 61: Global Imaging Diagnostic Catheters Revenue million Forecast, by Country 2019 & 2032
- Table 62: Global Imaging Diagnostic Catheters Volume K Forecast, by Country 2019 & 2032
- Table 63: Turkey Imaging Diagnostic Catheters Revenue (million) Forecast, by Application 2019 & 2032
- Table 64: Turkey Imaging Diagnostic Catheters Volume (K) Forecast, by Application 2019 & 2032
- Table 65: Israel Imaging Diagnostic Catheters Revenue (million) Forecast, by Application 2019 & 2032
- Table 66: Israel Imaging Diagnostic Catheters Volume (K) Forecast, by Application 2019 & 2032
- Table 67: GCC Imaging Diagnostic Catheters Revenue (million) Forecast, by Application 2019 & 2032
- Table 68: GCC Imaging Diagnostic Catheters Volume (K) Forecast, by Application 2019 & 2032
- Table 69: North Africa Imaging Diagnostic Catheters Revenue (million) Forecast, by Application 2019 & 2032
- Table 70: North Africa Imaging Diagnostic Catheters Volume (K) Forecast, by Application 2019 & 2032
- Table 71: South Africa Imaging Diagnostic Catheters Revenue (million) Forecast, by Application 2019 & 2032
- Table 72: South Africa Imaging Diagnostic Catheters Volume (K) Forecast, by Application 2019 & 2032
- Table 73: Rest of Middle East & Africa Imaging Diagnostic Catheters Revenue (million) Forecast, by Application 2019 & 2032
- Table 74: Rest of Middle East & Africa Imaging Diagnostic Catheters Volume (K) Forecast, by Application 2019 & 2032
- Table 75: Global Imaging Diagnostic Catheters Revenue million Forecast, by Application 2019 & 2032
- Table 76: Global Imaging Diagnostic Catheters Volume K Forecast, by Application 2019 & 2032
- Table 77: Global Imaging Diagnostic Catheters Revenue million Forecast, by Types 2019 & 2032
- Table 78: Global Imaging Diagnostic Catheters Volume K Forecast, by Types 2019 & 2032
- Table 79: Global Imaging Diagnostic Catheters Revenue million Forecast, by Country 2019 & 2032
- Table 80: Global Imaging Diagnostic Catheters Volume K Forecast, by Country 2019 & 2032
- Table 81: China Imaging Diagnostic Catheters Revenue (million) Forecast, by Application 2019 & 2032
- Table 82: China Imaging Diagnostic Catheters Volume (K) Forecast, by Application 2019 & 2032
- Table 83: India Imaging Diagnostic Catheters Revenue (million) Forecast, by Application 2019 & 2032
- Table 84: India Imaging Diagnostic Catheters Volume (K) Forecast, by Application 2019 & 2032
- Table 85: Japan Imaging Diagnostic Catheters Revenue (million) Forecast, by Application 2019 & 2032
- Table 86: Japan Imaging Diagnostic Catheters Volume (K) Forecast, by Application 2019 & 2032
- Table 87: South Korea Imaging Diagnostic Catheters Revenue (million) Forecast, by Application 2019 & 2032
- Table 88: South Korea Imaging Diagnostic Catheters Volume (K) Forecast, by Application 2019 & 2032
- Table 89: ASEAN Imaging Diagnostic Catheters Revenue (million) Forecast, by Application 2019 & 2032
- Table 90: ASEAN Imaging Diagnostic Catheters Volume (K) Forecast, by Application 2019 & 2032
- Table 91: Oceania Imaging Diagnostic Catheters Revenue (million) Forecast, by Application 2019 & 2032
- Table 92: Oceania Imaging Diagnostic Catheters Volume (K) Forecast, by Application 2019 & 2032
- Table 93: Rest of Asia Pacific Imaging Diagnostic Catheters Revenue (million) Forecast, by Application 2019 & 2032
- Table 94: Rest of Asia Pacific Imaging Diagnostic Catheters Volume (K) Forecast, by Application 2019 & 2032
Frequently Asked Questions
1. What is the projected Compound Annual Growth Rate (CAGR) of the Imaging Diagnostic Catheters?
The projected CAGR is approximately XX%.
2. Which companies are prominent players in the Imaging Diagnostic Catheters?
Key companies in the market include Medtronic, Boston Scientific, Abbott, C.R. Bard, Edward LifeSciences, Johnson & Johnson, Cardinal Health, Terumo Corporation, Koninklijke Philips, B. Braun Melsungen.
3. What are the main segments of the Imaging Diagnostic Catheters?
The market segments include Application, Types.
4. Can you provide details about the market size?
The market size is estimated to be USD XXX million as of 2022.
5. What are some drivers contributing to market growth?
N/A
6. What are the notable trends driving market growth?
N/A
7. Are there any restraints impacting market growth?
N/A
8. Can you provide examples of recent developments in the market?
N/A
9. What pricing options are available for accessing the report?
Pricing options include single-user, multi-user, and enterprise licenses priced at USD 3950.00, USD 5925.00, and USD 7900.00 respectively.
10. Is the market size provided in terms of value or volume?
The market size is provided in terms of value, measured in million and volume, measured in K.
11. Are there any specific market keywords associated with the report?
Yes, the market keyword associated with the report is "Imaging Diagnostic Catheters," which aids in identifying and referencing the specific market segment covered.
12. How do I determine which pricing option suits my needs best?
The pricing options vary based on user requirements and access needs. Individual users may opt for single-user licenses, while businesses requiring broader access may choose multi-user or enterprise licenses for cost-effective access to the report.
13. Are there any additional resources or data provided in the Imaging Diagnostic Catheters report?
While the report offers comprehensive insights, it's advisable to review the specific contents or supplementary materials provided to ascertain if additional resources or data are available.
14. How can I stay updated on further developments or reports in the Imaging Diagnostic Catheters?
To stay informed about further developments, trends, and reports in the Imaging Diagnostic Catheters, consider subscribing to industry newsletters, following relevant companies and organizations, or regularly checking reputable industry news sources and publications.
Methodology
Step 1 - Identification of Relevant Samples Size from Population Database


Step 2 - Approaches for Defining Global Market Size (Value, Volume* & Price*)

Note*: In applicable scenarios
Step 3 - Data Sources
Primary Research
- Web Analytics
- Survey Reports
- Research Institute
- Latest Research Reports
- Opinion Leaders
Secondary Research
- Annual Reports
- White Paper
- Latest Press Release
- Industry Association
- Paid Database
- Investor Presentations

Step 4 - Data Triangulation
Involves using different sources of information in order to increase the validity of a study
These sources are likely to be stakeholders in a program - participants, other researchers, program staff, other community members, and so on.
Then we put all data in single framework & apply various statistical tools to find out the dynamic on the market.
During the analysis stage, feedback from the stakeholder groups would be compared to determine areas of agreement as well as areas of divergence
