

Key Insights
The European e-brokerage market, projected to reach $14.1 billion by 2024, is set for significant expansion. Driven by widespread digital adoption, increasing retail investor engagement, and the proliferation of mobile trading, the market is forecast to grow at a Compound Annual Growth Rate (CAGR) of 9.4% from 2024 to 2033. Key growth catalysts include the tech-savvy younger demographic's preference for online platforms, regulatory enhancements fostering investor confidence and transparency, and the introduction of innovative trading tools like fractional shares and advanced charting capabilities. Potential headwinds include intensified competition, rigorous regulatory oversight, and macroeconomic volatility. The market is segmented by brokerage type, trading platform, investor profile, and geography. Leading entities such as Interactive Brokers, eToro, and Saxo Bank are actively pursuing market share through technological innovation, competitive pricing strategies, and targeted outreach. Sustained success hinges on their adaptability to market shifts and their capacity to serve a discerning and evolving investor base.
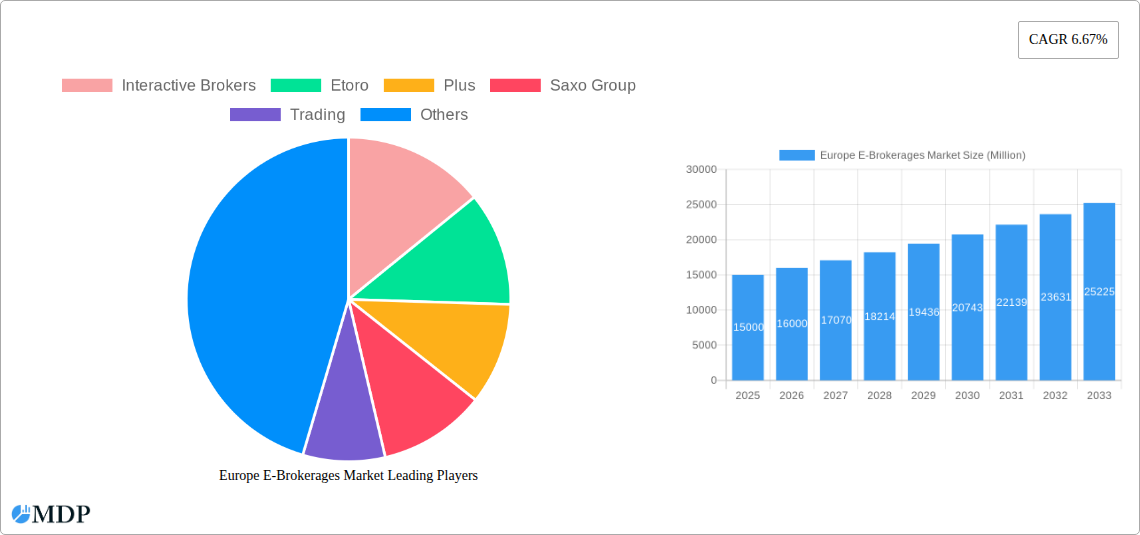
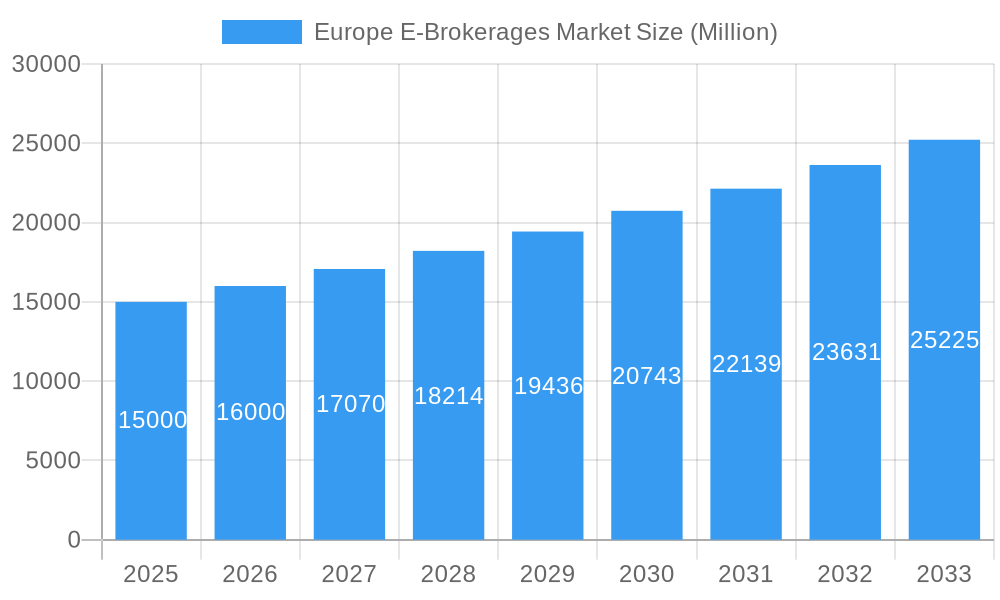
Europe E-Brokerages Market Market Size (In Billion)
The competitive environment is characterized by robust dynamism, with established firms confronting challenges from agile fintech startups offering novel trading solutions and cost-effective fee structures. Future market development will be shaped by the convergence of technological progress, regulatory frameworks, macroeconomic forces, and evolving investor preferences. Companies are prioritizing enhanced user experience, sophisticated analytics integration, and expanded product portfolios to secure a competitive advantage. Regional growth trajectories will be influenced by financial literacy levels, technological infrastructure, mobile device penetration, and the success of both domestic and international e-brokerage firms. Continuous analysis of these elements is vital for precise market forecasting and informed strategic planning.
Europe E-Brokerages Market Company Market Share
Europe E-Brokerages Market Report: 2019-2033
This comprehensive report provides an in-depth analysis of the Europe E-brokerages market, offering actionable insights for industry stakeholders. Covering the period 2019-2033, with a focus on 2025, this report meticulously examines market dynamics, key players, emerging trends, and future growth prospects. Maximize your understanding of this rapidly evolving sector and make informed strategic decisions.
Europe E-Brokerages Market Market Dynamics & Concentration
The European e-brokerage market, valued at xx Million in 2025, is characterized by a dynamic interplay of factors influencing its concentration and growth. Market leaders like Interactive Brokers, eToro, and Saxo Bank hold significant market share, but a fragmented landscape also includes numerous smaller players vying for market position. Innovation, driven by advancements in technology and evolving investor preferences, is a key driver. Stringent regulatory frameworks, particularly concerning client protection and data privacy (like GDPR), significantly shape market practices. The emergence of robo-advisors and sophisticated trading platforms serves as a substitute for traditional brokerage services, increasing competition. Furthermore, shifting end-user trends toward mobile trading and algorithmic investing are reshaping the competitive landscape. M&A activity has been moderate (xx deals in the past 5 years), with larger players potentially consolidating market share.
- Market Concentration: High concentration at the top, with top 5 players holding xx% market share in 2025.
- Innovation Drivers: Algorithmic trading, AI-powered investment tools, mobile-first platforms.
- Regulatory Landscape: Stringent regulations focusing on data security and investor protection.
- M&A Activity: Moderate level of mergers and acquisitions (xx deals in 2019-2024).
Europe E-Brokerages Market Industry Trends & Analysis
The European e-brokerage market exhibits robust growth, projected at a CAGR of xx% during 2025-2033. Several factors contribute to this expansion. The increasing adoption of online trading platforms, fueled by technological advancements and improved internet penetration across Europe, is a primary driver. A growing retail investor base, particularly among millennials and Gen Z, further contributes to market expansion. Consumer preferences are shifting towards user-friendly interfaces, low-cost trading options, and access to diverse investment products. Intense competition drives innovation, with companies constantly seeking to enhance their platforms and offer competitive pricing structures. The market penetration of e-brokerage services is projected to reach xx% by 2033. Technological disruptions, such as the rise of crypto trading and the integration of blockchain technology, are also reshaping the industry.
Leading Markets & Segments in Europe E-Brokerages Market
The UK, Germany, and France represent the leading markets within the European e-brokerage sector. Their dominance stems from a combination of factors:
- UK: Large retail investor base, sophisticated financial infrastructure, and a pro-business regulatory environment.
- Germany: Strong economic growth, high savings rates, and increasing awareness of online investment options.
- France: Growing adoption of fintech solutions and a supportive regulatory landscape encouraging innovation.
Other significant markets include the Nordics, Switzerland, and the Netherlands, which exhibit considerable potential for future growth due to their highly digitalized economies and financially literate populations. The retail segment currently dominates the market, with institutional investors representing a smaller yet rapidly growing segment.
Europe E-Brokerages Market Product Developments
Recent product developments focus on enhanced user experience, improved mobile accessibility, and sophisticated trading tools. This includes advanced charting packages, personalized investment recommendations driven by AI, and seamless integration with various payment gateways. The focus is on enhancing ease-of-use and attracting a wider range of investors through a combination of technological advancements and tailored offerings. The competitive advantage lies in offering a unique combination of low costs, advanced features, and exceptional customer service.
Key Drivers of Europe E-Brokerages Market Growth
Several key factors fuel the growth of the European e-brokerage market:
- Technological Advancements: Increased accessibility through mobile apps and user-friendly interfaces.
- Economic Growth: Rising disposable incomes and increased participation in financial markets.
- Favorable Regulatory Environment: Supportive policies that encourage innovation and competition within the fintech sector.
Challenges in the Europe E-Brokerages Market Market
The European e-brokerage market faces several challenges:
- Regulatory Scrutiny: Stringent regulations and compliance requirements.
- Cybersecurity Threats: Protecting sensitive customer data from cyberattacks.
- Intense Competition: The market is highly competitive, with constant pressure to differentiate offerings and maintain profitability.
Emerging Opportunities in Europe E-Brokerages Market
Significant opportunities exist for expansion into underserved markets, strategic partnerships with fintech companies, and the development of innovative products catering to niche investment preferences. Leveraging blockchain technology, offering personalized wealth management services, and expanding into new asset classes such as cryptocurrencies present significant avenues for long-term growth.
Leading Players in the Europe E-Brokerages Market Sector
- Interactive Brokers
- Etoro
- Plus500
- Saxo Group
- Trading 212
- Degiro
- Exante
- X-Trade Brokers
- Robinhood
- SwissQuote
- BUX
- Vanguard
- Capital Com
- Tradestation
- Freetrade
- Hargreaves Lansdown
- IC Markets
- Other Key Players (List Not Exhaustive)
Key Milestones in Europe E-Brokerages Market Industry
- February 2023: Interactive Brokers launched its new IBUSOPT order destination, improving options trade execution.
- January 2023: eToro launched ValueGurus, offering retail investors long-term exposure to value-investing strategies.
Strategic Outlook for Europe E-Brokerages Market Market
The European e-brokerage market is poised for continued growth, driven by technological innovation, increasing retail investor participation, and a supportive regulatory environment. Strategic partnerships, product diversification, and expansion into new markets offer significant opportunities for market leaders and emerging players to capture substantial market share and deliver significant returns.
Europe E-Brokerages Market Segmentation
-
1. Investor Type
- 1.1. Retail
- 1.2. Institutional
-
2. Services Offered
- 2.1. Full Time Brokers
- 2.2. Discount Brokers
-
3. Operation
- 3.1. Domestic
- 3.2. Foreign
Europe E-Brokerages Market Segmentation By Geography
- 1. Germany
- 2. United Kingdom
- 3. Russia
- 4. Spain
- 5. Netherlands
- 6. Denmark
- 7. Sweden
- 8. Finland
- 9. Norway
- 10. Rest of Europe
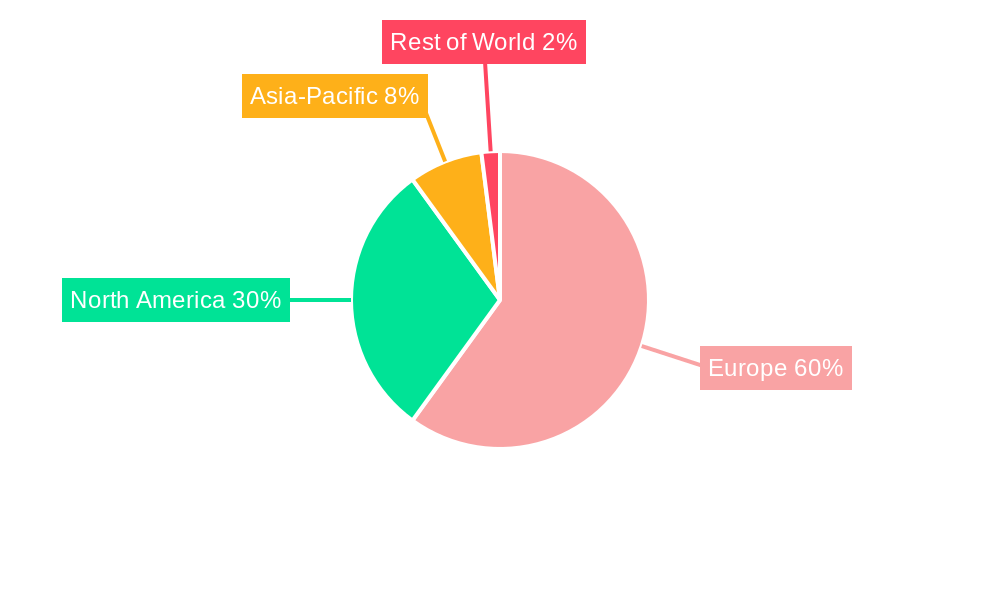
Europe E-Brokerages Market Regional Market Share
Geographic Coverage of Europe E-Brokerages Market
Europe E-Brokerages Market REPORT HIGHLIGHTS
| Aspects | Details |
|---|---|
| Study Period | 2020-2034 |
| Base Year | 2025 |
| Estimated Year | 2026 |
| Forecast Period | 2026-2034 |
| Historical Period | 2020-2025 |
| Growth Rate | CAGR of 9.4% from 2020-2034 |
| Segmentation |
|
Table of Contents
- 1. Introduction
- 1.1. Research Scope
- 1.2. Market Segmentation
- 1.3. Research Objective
- 1.4. Definitions and Assumptions
- 2. Executive Summary
- 2.1. Market Snapshot
- 3. Market Dynamics
- 3.1. Market Drivers
- 3.2. Market Restrains
- 3.3. Market Trends
- 3.4. Market Opportunities
- 4. Market Factor Analysis
- 4.1. Porters Five Forces
- 4.1.1. Bargaining Power of Suppliers
- 4.1.2. Bargaining Power of Buyers
- 4.1.3. Threat of New Entrants
- 4.1.4. Threat of Substitutes
- 4.1.5. Competitive Rivalry
- 4.2. PESTEL analysis
- 4.3. BCG Analysis
- 4.3.1. Stars (High Growth, High Market Share)
- 4.3.2. Cash Cows (Low Growth, High Market Share)
- 4.3.3. Question Mark (High Growth, Low Market Share)
- 4.3.4. Dogs (Low Growth, Low Market Share)
- 4.4. Ansoff Matrix Analysis
- 4.5. Supply Chain Analysis
- 4.6. Regulatory Landscape
- 4.7. Current Market Potential and Opportunity Assessment (TAM–SAM–SOM Framework)
- 4.8. MDP Analyst Note
- 4.1. Porters Five Forces
- 5. Market Analysis, Insights and Forecast 2021-2033
- 5.1. Market Analysis, Insights and Forecast - by Investor Type
- 5.1.1. Retail
- 5.1.2. Institutional
- 5.2. Market Analysis, Insights and Forecast - by Services Offered
- 5.2.1. Full Time Brokers
- 5.2.2. Discount Brokers
- 5.3. Market Analysis, Insights and Forecast - by Operation
- 5.3.1. Domestic
- 5.3.2. Foreign
- 5.4. Market Analysis, Insights and Forecast - by Region
- 5.4.1. Germany
- 5.4.2. United Kingdom
- 5.4.3. Russia
- 5.4.4. Spain
- 5.4.5. Netherlands
- 5.4.6. Denmark
- 5.4.7. Sweden
- 5.4.8. Finland
- 5.4.9. Norway
- 5.4.10. Rest of Europe
- 5.1. Market Analysis, Insights and Forecast - by Investor Type
- 6. Global Europe E-Brokerages Market Analysis, Insights and Forecast, 2021-2033
- 6.1. Market Analysis, Insights and Forecast - by Investor Type
- 6.1.1. Retail
- 6.1.2. Institutional
- 6.2. Market Analysis, Insights and Forecast - by Services Offered
- 6.2.1. Full Time Brokers
- 6.2.2. Discount Brokers
- 6.3. Market Analysis, Insights and Forecast - by Operation
- 6.3.1. Domestic
- 6.3.2. Foreign
- 6.1. Market Analysis, Insights and Forecast - by Investor Type
- 7. Germany Europe E-Brokerages Market Analysis, Insights and Forecast, 2020-2032
- 7.1. Market Analysis, Insights and Forecast - by Investor Type
- 7.1.1. Retail
- 7.1.2. Institutional
- 7.2. Market Analysis, Insights and Forecast - by Services Offered
- 7.2.1. Full Time Brokers
- 7.2.2. Discount Brokers
- 7.3. Market Analysis, Insights and Forecast - by Operation
- 7.3.1. Domestic
- 7.3.2. Foreign
- 7.1. Market Analysis, Insights and Forecast - by Investor Type
- 8. United Kingdom Europe E-Brokerages Market Analysis, Insights and Forecast, 2020-2032
- 8.1. Market Analysis, Insights and Forecast - by Investor Type
- 8.1.1. Retail
- 8.1.2. Institutional
- 8.2. Market Analysis, Insights and Forecast - by Services Offered
- 8.2.1. Full Time Brokers
- 8.2.2. Discount Brokers
- 8.3. Market Analysis, Insights and Forecast - by Operation
- 8.3.1. Domestic
- 8.3.2. Foreign
- 8.1. Market Analysis, Insights and Forecast - by Investor Type
- 9. Russia Europe E-Brokerages Market Analysis, Insights and Forecast, 2020-2032
- 9.1. Market Analysis, Insights and Forecast - by Investor Type
- 9.1.1. Retail
- 9.1.2. Institutional
- 9.2. Market Analysis, Insights and Forecast - by Services Offered
- 9.2.1. Full Time Brokers
- 9.2.2. Discount Brokers
- 9.3. Market Analysis, Insights and Forecast - by Operation
- 9.3.1. Domestic
- 9.3.2. Foreign
- 9.1. Market Analysis, Insights and Forecast - by Investor Type
- 10. Spain Europe E-Brokerages Market Analysis, Insights and Forecast, 2020-2032
- 10.1. Market Analysis, Insights and Forecast - by Investor Type
- 10.1.1. Retail
- 10.1.2. Institutional
- 10.2. Market Analysis, Insights and Forecast - by Services Offered
- 10.2.1. Full Time Brokers
- 10.2.2. Discount Brokers
- 10.3. Market Analysis, Insights and Forecast - by Operation
- 10.3.1. Domestic
- 10.3.2. Foreign
- 10.1. Market Analysis, Insights and Forecast - by Investor Type
- 11. Netherlands Europe E-Brokerages Market Analysis, Insights and Forecast, 2020-2032
- 11.1. Market Analysis, Insights and Forecast - by Investor Type
- 11.1.1. Retail
- 11.1.2. Institutional
- 11.2. Market Analysis, Insights and Forecast - by Services Offered
- 11.2.1. Full Time Brokers
- 11.2.2. Discount Brokers
- 11.3. Market Analysis, Insights and Forecast - by Operation
- 11.3.1. Domestic
- 11.3.2. Foreign
- 11.1. Market Analysis, Insights and Forecast - by Investor Type
- 12. Denmark Europe E-Brokerages Market Analysis, Insights and Forecast, 2020-2032
- 12.1. Market Analysis, Insights and Forecast - by Investor Type
- 12.1.1. Retail
- 12.1.2. Institutional
- 12.2. Market Analysis, Insights and Forecast - by Services Offered
- 12.2.1. Full Time Brokers
- 12.2.2. Discount Brokers
- 12.3. Market Analysis, Insights and Forecast - by Operation
- 12.3.1. Domestic
- 12.3.2. Foreign
- 12.1. Market Analysis, Insights and Forecast - by Investor Type
- 13. Sweden Europe E-Brokerages Market Analysis, Insights and Forecast, 2020-2032
- 13.1. Market Analysis, Insights and Forecast - by Investor Type
- 13.1.1. Retail
- 13.1.2. Institutional
- 13.2. Market Analysis, Insights and Forecast - by Services Offered
- 13.2.1. Full Time Brokers
- 13.2.2. Discount Brokers
- 13.3. Market Analysis, Insights and Forecast - by Operation
- 13.3.1. Domestic
- 13.3.2. Foreign
- 13.1. Market Analysis, Insights and Forecast - by Investor Type
- 14. Finland Europe E-Brokerages Market Analysis, Insights and Forecast, 2020-2032
- 14.1. Market Analysis, Insights and Forecast - by Investor Type
- 14.1.1. Retail
- 14.1.2. Institutional
- 14.2. Market Analysis, Insights and Forecast - by Services Offered
- 14.2.1. Full Time Brokers
- 14.2.2. Discount Brokers
- 14.3. Market Analysis, Insights and Forecast - by Operation
- 14.3.1. Domestic
- 14.3.2. Foreign
- 14.1. Market Analysis, Insights and Forecast - by Investor Type
- 15. Norway Europe E-Brokerages Market Analysis, Insights and Forecast, 2020-2032
- 15.1. Market Analysis, Insights and Forecast - by Investor Type
- 15.1.1. Retail
- 15.1.2. Institutional
- 15.2. Market Analysis, Insights and Forecast - by Services Offered
- 15.2.1. Full Time Brokers
- 15.2.2. Discount Brokers
- 15.3. Market Analysis, Insights and Forecast - by Operation
- 15.3.1. Domestic
- 15.3.2. Foreign
- 15.1. Market Analysis, Insights and Forecast - by Investor Type
- 16. Rest of Europe Europe E-Brokerages Market Analysis, Insights and Forecast, 2020-2032
- 16.1. Market Analysis, Insights and Forecast - by Investor Type
- 16.1.1. Retail
- 16.1.2. Institutional
- 16.2. Market Analysis, Insights and Forecast - by Services Offered
- 16.2.1. Full Time Brokers
- 16.2.2. Discount Brokers
- 16.3. Market Analysis, Insights and Forecast - by Operation
- 16.3.1. Domestic
- 16.3.2. Foreign
- 16.1. Market Analysis, Insights and Forecast - by Investor Type
- 17. Competitive Analysis
- 17.1. Company Profiles
- 17.1.1 Interactive Brokers
- 17.1.1.1. Company Overview
- 17.1.1.2. Products
- 17.1.1.3. Company Financials
- 17.1.1.4. SWOT Analysis
- 17.1.2 Etoro
- 17.1.2.1. Company Overview
- 17.1.2.2. Products
- 17.1.2.3. Company Financials
- 17.1.2.4. SWOT Analysis
- 17.1.3 Plus
- 17.1.3.1. Company Overview
- 17.1.3.2. Products
- 17.1.3.3. Company Financials
- 17.1.3.4. SWOT Analysis
- 17.1.4 Saxo Group
- 17.1.4.1. Company Overview
- 17.1.4.2. Products
- 17.1.4.3. Company Financials
- 17.1.4.4. SWOT Analysis
- 17.1.5 Trading
- 17.1.5.1. Company Overview
- 17.1.5.2. Products
- 17.1.5.3. Company Financials
- 17.1.5.4. SWOT Analysis
- 17.1.6 Degiro
- 17.1.6.1. Company Overview
- 17.1.6.2. Products
- 17.1.6.3. Company Financials
- 17.1.6.4. SWOT Analysis
- 17.1.7 Exante
- 17.1.7.1. Company Overview
- 17.1.7.2. Products
- 17.1.7.3. Company Financials
- 17.1.7.4. SWOT Analysis
- 17.1.8 X-Trade Brokers
- 17.1.8.1. Company Overview
- 17.1.8.2. Products
- 17.1.8.3. Company Financials
- 17.1.8.4. SWOT Analysis
- 17.1.9 Robinhood
- 17.1.9.1. Company Overview
- 17.1.9.2. Products
- 17.1.9.3. Company Financials
- 17.1.9.4. SWOT Analysis
- 17.1.10 SwissQuote
- 17.1.10.1. Company Overview
- 17.1.10.2. Products
- 17.1.10.3. Company Financials
- 17.1.10.4. SWOT Analysis
- 17.1.11 BUX
- 17.1.11.1. Company Overview
- 17.1.11.2. Products
- 17.1.11.3. Company Financials
- 17.1.11.4. SWOT Analysis
- 17.1.12 Vanguard
- 17.1.12.1. Company Overview
- 17.1.12.2. Products
- 17.1.12.3. Company Financials
- 17.1.12.4. SWOT Analysis
- 17.1.13 Capital Com
- 17.1.13.1. Company Overview
- 17.1.13.2. Products
- 17.1.13.3. Company Financials
- 17.1.13.4. SWOT Analysis
- 17.1.14 Tradestation
- 17.1.14.1. Company Overview
- 17.1.14.2. Products
- 17.1.14.3. Company Financials
- 17.1.14.4. SWOT Analysis
- 17.1.15 Freetrade
- 17.1.15.1. Company Overview
- 17.1.15.2. Products
- 17.1.15.3. Company Financials
- 17.1.15.4. SWOT Analysis
- 17.1.16 Hargreaves Lansdown
- 17.1.16.1. Company Overview
- 17.1.16.2. Products
- 17.1.16.3. Company Financials
- 17.1.16.4. SWOT Analysis
- 17.1.17 IC Market
- 17.1.17.1. Company Overview
- 17.1.17.2. Products
- 17.1.17.3. Company Financials
- 17.1.17.4. SWOT Analysis
- 17.1.18 Other Key Players**List Not Exhaustive
- 17.1.18.1. Company Overview
- 17.1.18.2. Products
- 17.1.18.3. Company Financials
- 17.1.18.4. SWOT Analysis
- 17.1.1 Interactive Brokers
- 17.2. Market Entropy
- 17.2.1 Company's Key Areas Served
- 17.2.2 Recent Developments
- 17.3. Company Market Share Analysis 2025
- 17.3.1 Top 5 Companies Market Share Analysis
- 17.3.2 Top 3 Companies Market Share Analysis
- 17.4. List of Potential Customers
- 18. Research Methodology
List of Figures
- Figure 1: Global Europe E-Brokerages Market Revenue Breakdown (billion, %) by Region 2025 & 2033
- Figure 2: Germany Europe E-Brokerages Market Revenue (billion), by Investor Type 2025 & 2033
- Figure 3: Germany Europe E-Brokerages Market Revenue Share (%), by Investor Type 2025 & 2033
- Figure 4: Germany Europe E-Brokerages Market Revenue (billion), by Services Offered 2025 & 2033
- Figure 5: Germany Europe E-Brokerages Market Revenue Share (%), by Services Offered 2025 & 2033
- Figure 6: Germany Europe E-Brokerages Market Revenue (billion), by Operation 2025 & 2033
- Figure 7: Germany Europe E-Brokerages Market Revenue Share (%), by Operation 2025 & 2033
- Figure 8: Germany Europe E-Brokerages Market Revenue (billion), by Country 2025 & 2033
- Figure 9: Germany Europe E-Brokerages Market Revenue Share (%), by Country 2025 & 2033
- Figure 10: United Kingdom Europe E-Brokerages Market Revenue (billion), by Investor Type 2025 & 2033
- Figure 11: United Kingdom Europe E-Brokerages Market Revenue Share (%), by Investor Type 2025 & 2033
- Figure 12: United Kingdom Europe E-Brokerages Market Revenue (billion), by Services Offered 2025 & 2033
- Figure 13: United Kingdom Europe E-Brokerages Market Revenue Share (%), by Services Offered 2025 & 2033
- Figure 14: United Kingdom Europe E-Brokerages Market Revenue (billion), by Operation 2025 & 2033
- Figure 15: United Kingdom Europe E-Brokerages Market Revenue Share (%), by Operation 2025 & 2033
- Figure 16: United Kingdom Europe E-Brokerages Market Revenue (billion), by Country 2025 & 2033
- Figure 17: United Kingdom Europe E-Brokerages Market Revenue Share (%), by Country 2025 & 2033
- Figure 18: Russia Europe E-Brokerages Market Revenue (billion), by Investor Type 2025 & 2033
- Figure 19: Russia Europe E-Brokerages Market Revenue Share (%), by Investor Type 2025 & 2033
- Figure 20: Russia Europe E-Brokerages Market Revenue (billion), by Services Offered 2025 & 2033
- Figure 21: Russia Europe E-Brokerages Market Revenue Share (%), by Services Offered 2025 & 2033
- Figure 22: Russia Europe E-Brokerages Market Revenue (billion), by Operation 2025 & 2033
- Figure 23: Russia Europe E-Brokerages Market Revenue Share (%), by Operation 2025 & 2033
- Figure 24: Russia Europe E-Brokerages Market Revenue (billion), by Country 2025 & 2033
- Figure 25: Russia Europe E-Brokerages Market Revenue Share (%), by Country 2025 & 2033
- Figure 26: Spain Europe E-Brokerages Market Revenue (billion), by Investor Type 2025 & 2033
- Figure 27: Spain Europe E-Brokerages Market Revenue Share (%), by Investor Type 2025 & 2033
- Figure 28: Spain Europe E-Brokerages Market Revenue (billion), by Services Offered 2025 & 2033
- Figure 29: Spain Europe E-Brokerages Market Revenue Share (%), by Services Offered 2025 & 2033
- Figure 30: Spain Europe E-Brokerages Market Revenue (billion), by Operation 2025 & 2033
- Figure 31: Spain Europe E-Brokerages Market Revenue Share (%), by Operation 2025 & 2033
- Figure 32: Spain Europe E-Brokerages Market Revenue (billion), by Country 2025 & 2033
- Figure 33: Spain Europe E-Brokerages Market Revenue Share (%), by Country 2025 & 2033
- Figure 34: Netherlands Europe E-Brokerages Market Revenue (billion), by Investor Type 2025 & 2033
- Figure 35: Netherlands Europe E-Brokerages Market Revenue Share (%), by Investor Type 2025 & 2033
- Figure 36: Netherlands Europe E-Brokerages Market Revenue (billion), by Services Offered 2025 & 2033
- Figure 37: Netherlands Europe E-Brokerages Market Revenue Share (%), by Services Offered 2025 & 2033
- Figure 38: Netherlands Europe E-Brokerages Market Revenue (billion), by Operation 2025 & 2033
- Figure 39: Netherlands Europe E-Brokerages Market Revenue Share (%), by Operation 2025 & 2033
- Figure 40: Netherlands Europe E-Brokerages Market Revenue (billion), by Country 2025 & 2033
- Figure 41: Netherlands Europe E-Brokerages Market Revenue Share (%), by Country 2025 & 2033
- Figure 42: Denmark Europe E-Brokerages Market Revenue (billion), by Investor Type 2025 & 2033
- Figure 43: Denmark Europe E-Brokerages Market Revenue Share (%), by Investor Type 2025 & 2033
- Figure 44: Denmark Europe E-Brokerages Market Revenue (billion), by Services Offered 2025 & 2033
- Figure 45: Denmark Europe E-Brokerages Market Revenue Share (%), by Services Offered 2025 & 2033
- Figure 46: Denmark Europe E-Brokerages Market Revenue (billion), by Operation 2025 & 2033
- Figure 47: Denmark Europe E-Brokerages Market Revenue Share (%), by Operation 2025 & 2033
- Figure 48: Denmark Europe E-Brokerages Market Revenue (billion), by Country 2025 & 2033
- Figure 49: Denmark Europe E-Brokerages Market Revenue Share (%), by Country 2025 & 2033
- Figure 50: Sweden Europe E-Brokerages Market Revenue (billion), by Investor Type 2025 & 2033
- Figure 51: Sweden Europe E-Brokerages Market Revenue Share (%), by Investor Type 2025 & 2033
- Figure 52: Sweden Europe E-Brokerages Market Revenue (billion), by Services Offered 2025 & 2033
- Figure 53: Sweden Europe E-Brokerages Market Revenue Share (%), by Services Offered 2025 & 2033
- Figure 54: Sweden Europe E-Brokerages Market Revenue (billion), by Operation 2025 & 2033
- Figure 55: Sweden Europe E-Brokerages Market Revenue Share (%), by Operation 2025 & 2033
- Figure 56: Sweden Europe E-Brokerages Market Revenue (billion), by Country 2025 & 2033
- Figure 57: Sweden Europe E-Brokerages Market Revenue Share (%), by Country 2025 & 2033
- Figure 58: Finland Europe E-Brokerages Market Revenue (billion), by Investor Type 2025 & 2033
- Figure 59: Finland Europe E-Brokerages Market Revenue Share (%), by Investor Type 2025 & 2033
- Figure 60: Finland Europe E-Brokerages Market Revenue (billion), by Services Offered 2025 & 2033
- Figure 61: Finland Europe E-Brokerages Market Revenue Share (%), by Services Offered 2025 & 2033
- Figure 62: Finland Europe E-Brokerages Market Revenue (billion), by Operation 2025 & 2033
- Figure 63: Finland Europe E-Brokerages Market Revenue Share (%), by Operation 2025 & 2033
- Figure 64: Finland Europe E-Brokerages Market Revenue (billion), by Country 2025 & 2033
- Figure 65: Finland Europe E-Brokerages Market Revenue Share (%), by Country 2025 & 2033
- Figure 66: Norway Europe E-Brokerages Market Revenue (billion), by Investor Type 2025 & 2033
- Figure 67: Norway Europe E-Brokerages Market Revenue Share (%), by Investor Type 2025 & 2033
- Figure 68: Norway Europe E-Brokerages Market Revenue (billion), by Services Offered 2025 & 2033
- Figure 69: Norway Europe E-Brokerages Market Revenue Share (%), by Services Offered 2025 & 2033
- Figure 70: Norway Europe E-Brokerages Market Revenue (billion), by Operation 2025 & 2033
- Figure 71: Norway Europe E-Brokerages Market Revenue Share (%), by Operation 2025 & 2033
- Figure 72: Norway Europe E-Brokerages Market Revenue (billion), by Country 2025 & 2033
- Figure 73: Norway Europe E-Brokerages Market Revenue Share (%), by Country 2025 & 2033
- Figure 74: Rest of Europe Europe E-Brokerages Market Revenue (billion), by Investor Type 2025 & 2033
- Figure 75: Rest of Europe Europe E-Brokerages Market Revenue Share (%), by Investor Type 2025 & 2033
- Figure 76: Rest of Europe Europe E-Brokerages Market Revenue (billion), by Services Offered 2025 & 2033
- Figure 77: Rest of Europe Europe E-Brokerages Market Revenue Share (%), by Services Offered 2025 & 2033
- Figure 78: Rest of Europe Europe E-Brokerages Market Revenue (billion), by Operation 2025 & 2033
- Figure 79: Rest of Europe Europe E-Brokerages Market Revenue Share (%), by Operation 2025 & 2033
- Figure 80: Rest of Europe Europe E-Brokerages Market Revenue (billion), by Country 2025 & 2033
- Figure 81: Rest of Europe Europe E-Brokerages Market Revenue Share (%), by Country 2025 & 2033
List of Tables
- Table 1: Global Europe E-Brokerages Market Revenue billion Forecast, by Investor Type 2020 & 2033
- Table 2: Global Europe E-Brokerages Market Revenue billion Forecast, by Services Offered 2020 & 2033
- Table 3: Global Europe E-Brokerages Market Revenue billion Forecast, by Operation 2020 & 2033
- Table 4: Global Europe E-Brokerages Market Revenue billion Forecast, by Region 2020 & 2033
- Table 5: Global Europe E-Brokerages Market Revenue billion Forecast, by Investor Type 2020 & 2033
- Table 6: Global Europe E-Brokerages Market Revenue billion Forecast, by Services Offered 2020 & 2033
- Table 7: Global Europe E-Brokerages Market Revenue billion Forecast, by Operation 2020 & 2033
- Table 8: Global Europe E-Brokerages Market Revenue billion Forecast, by Country 2020 & 2033
- Table 9: Global Europe E-Brokerages Market Revenue billion Forecast, by Investor Type 2020 & 2033
- Table 10: Global Europe E-Brokerages Market Revenue billion Forecast, by Services Offered 2020 & 2033
- Table 11: Global Europe E-Brokerages Market Revenue billion Forecast, by Operation 2020 & 2033
- Table 12: Global Europe E-Brokerages Market Revenue billion Forecast, by Country 2020 & 2033
- Table 13: Global Europe E-Brokerages Market Revenue billion Forecast, by Investor Type 2020 & 2033
- Table 14: Global Europe E-Brokerages Market Revenue billion Forecast, by Services Offered 2020 & 2033
- Table 15: Global Europe E-Brokerages Market Revenue billion Forecast, by Operation 2020 & 2033
- Table 16: Global Europe E-Brokerages Market Revenue billion Forecast, by Country 2020 & 2033
- Table 17: Global Europe E-Brokerages Market Revenue billion Forecast, by Investor Type 2020 & 2033
- Table 18: Global Europe E-Brokerages Market Revenue billion Forecast, by Services Offered 2020 & 2033
- Table 19: Global Europe E-Brokerages Market Revenue billion Forecast, by Operation 2020 & 2033
- Table 20: Global Europe E-Brokerages Market Revenue billion Forecast, by Country 2020 & 2033
- Table 21: Global Europe E-Brokerages Market Revenue billion Forecast, by Investor Type 2020 & 2033
- Table 22: Global Europe E-Brokerages Market Revenue billion Forecast, by Services Offered 2020 & 2033
- Table 23: Global Europe E-Brokerages Market Revenue billion Forecast, by Operation 2020 & 2033
- Table 24: Global Europe E-Brokerages Market Revenue billion Forecast, by Country 2020 & 2033
- Table 25: Global Europe E-Brokerages Market Revenue billion Forecast, by Investor Type 2020 & 2033
- Table 26: Global Europe E-Brokerages Market Revenue billion Forecast, by Services Offered 2020 & 2033
- Table 27: Global Europe E-Brokerages Market Revenue billion Forecast, by Operation 2020 & 2033
- Table 28: Global Europe E-Brokerages Market Revenue billion Forecast, by Country 2020 & 2033
- Table 29: Global Europe E-Brokerages Market Revenue billion Forecast, by Investor Type 2020 & 2033
- Table 30: Global Europe E-Brokerages Market Revenue billion Forecast, by Services Offered 2020 & 2033
- Table 31: Global Europe E-Brokerages Market Revenue billion Forecast, by Operation 2020 & 2033
- Table 32: Global Europe E-Brokerages Market Revenue billion Forecast, by Country 2020 & 2033
- Table 33: Global Europe E-Brokerages Market Revenue billion Forecast, by Investor Type 2020 & 2033
- Table 34: Global Europe E-Brokerages Market Revenue billion Forecast, by Services Offered 2020 & 2033
- Table 35: Global Europe E-Brokerages Market Revenue billion Forecast, by Operation 2020 & 2033
- Table 36: Global Europe E-Brokerages Market Revenue billion Forecast, by Country 2020 & 2033
- Table 37: Global Europe E-Brokerages Market Revenue billion Forecast, by Investor Type 2020 & 2033
- Table 38: Global Europe E-Brokerages Market Revenue billion Forecast, by Services Offered 2020 & 2033
- Table 39: Global Europe E-Brokerages Market Revenue billion Forecast, by Operation 2020 & 2033
- Table 40: Global Europe E-Brokerages Market Revenue billion Forecast, by Country 2020 & 2033
- Table 41: Global Europe E-Brokerages Market Revenue billion Forecast, by Investor Type 2020 & 2033
- Table 42: Global Europe E-Brokerages Market Revenue billion Forecast, by Services Offered 2020 & 2033
- Table 43: Global Europe E-Brokerages Market Revenue billion Forecast, by Operation 2020 & 2033
- Table 44: Global Europe E-Brokerages Market Revenue billion Forecast, by Country 2020 & 2033
Frequently Asked Questions
1. What is the projected Compound Annual Growth Rate (CAGR) of the Europe E-Brokerages Market?
The projected CAGR is approximately 9.4%.
2. Which companies are prominent players in the Europe E-Brokerages Market?
Key companies in the market include Interactive Brokers, Etoro, Plus, Saxo Group, Trading, Degiro, Exante, X-Trade Brokers, Robinhood, SwissQuote, BUX, Vanguard, Capital Com, Tradestation, Freetrade, Hargreaves Lansdown, IC Market, Other Key Players**List Not Exhaustive.
3. What are the main segments of the Europe E-Brokerages Market?
The market segments include Investor Type, Services Offered, Operation.
4. Can you provide details about the market size?
The market size is estimated to be USD 14.1 billion as of 2022.
5. What are some drivers contributing to market growth?
N/A
6. What are the notable trends driving market growth?
Growing Retail Investors in The Region is Driving The E-Brokerages Market.
7. Are there any restraints impacting market growth?
N/A
8. Can you provide examples of recent developments in the market?
February 2023: Interactive Brokers announced the launch of its new IBUSOPT order destination. With the dramatic increase in retail options trading, Interactive Brokers has launched this new order destination to help its retail and institutional clients achieve better price execution on their options trades.
9. What pricing options are available for accessing the report?
Pricing options include single-user, multi-user, and enterprise licenses priced at USD 4750, USD 5250, and USD 8750 respectively.
10. Is the market size provided in terms of value or volume?
The market size is provided in terms of value, measured in billion.
11. Are there any specific market keywords associated with the report?
Yes, the market keyword associated with the report is "Europe E-Brokerages Market," which aids in identifying and referencing the specific market segment covered.
12. How do I determine which pricing option suits my needs best?
The pricing options vary based on user requirements and access needs. Individual users may opt for single-user licenses, while businesses requiring broader access may choose multi-user or enterprise licenses for cost-effective access to the report.
13. Are there any additional resources or data provided in the Europe E-Brokerages Market report?
While the report offers comprehensive insights, it's advisable to review the specific contents or supplementary materials provided to ascertain if additional resources or data are available.
14. How can I stay updated on further developments or reports in the Europe E-Brokerages Market?
To stay informed about further developments, trends, and reports in the Europe E-Brokerages Market, consider subscribing to industry newsletters, following relevant companies and organizations, or regularly checking reputable industry news sources and publications.
Methodology
Step 1 - Identification of Relevant Samples Size from Population Database


Step 2 - Approaches for Defining Global Market Size (Value, Volume* & Price*)

Note*: In applicable scenarios
Step 3 - Data Sources
Primary Research
- Web Analytics
- Survey Reports
- Research Institute
- Latest Research Reports
- Opinion Leaders
Secondary Research
- Annual Reports
- White Paper
- Latest Press Release
- Industry Association
- Paid Database
- Investor Presentations

Step 4 - Data Triangulation
Involves using different sources of information in order to increase the validity of a study
These sources are likely to be stakeholders in a program - participants, other researchers, program staff, other community members, and so on.
Then we put all data in single framework & apply various statistical tools to find out the dynamic on the market.
During the analysis stage, feedback from the stakeholder groups would be compared to determine areas of agreement as well as areas of divergence