

Key Insights
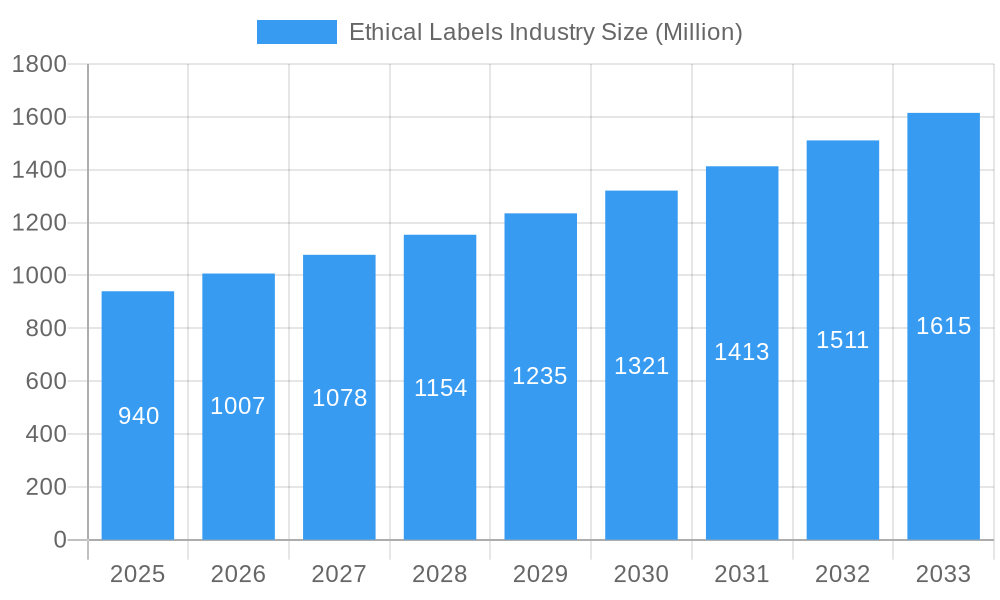
The ethical labels market, valued at $0.94 billion in 2025, is projected to experience robust growth, driven by increasing consumer awareness of sustainability, ethical sourcing, and social responsibility. A Compound Annual Growth Rate (CAGR) of 7.10% from 2025 to 2033 indicates a significant expansion in market size. This growth is fueled by several key factors. The rising demand for organic and sustainably produced food and beverages is a major driver, with consumers increasingly willing to pay a premium for products aligning with their values. Furthermore, the proliferation of stringent regulations and certifications related to ethical sourcing and fair trade practices is bolstering the adoption of ethical labels. The growing popularity of veganism and heightened concerns regarding animal welfare are also contributing to this market expansion. Segment-wise, the Halal and organic label types are anticipated to dominate, followed by clean and sustainable labels. Online distribution channels are experiencing faster growth compared to offline channels, reflecting the shift towards e-commerce and the convenience it offers consumers. Key players like PepsiCo, Ingredion, and DSM are actively shaping the market through product innovation and strategic partnerships. Geographic variations are expected, with North America and Europe maintaining significant market share due to established consumer awareness and regulatory frameworks. However, the Asia-Pacific region is poised for substantial growth, driven by rising disposable incomes and increasing adoption of ethical consumption patterns.
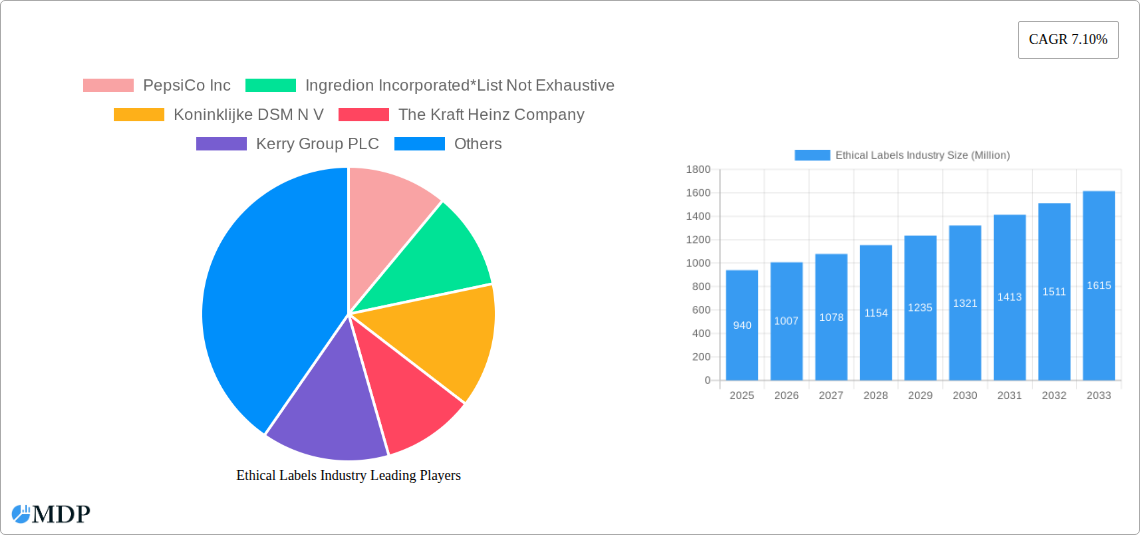
Ethical Labels Industry Market Size (In Million)
The market's growth trajectory, however, might face certain challenges. Fluctuations in raw material prices and supply chain disruptions can impact the overall market value. Moreover, the potential for "greenwashing" – where companies deceptively market products as ethical – could erode consumer trust and hinder market growth. To maintain sustainable growth, companies need to focus on transparency, verifiable certifications, and effective communication about their ethical sourcing practices. A successful strategy will involve building strong relationships with consumers and fostering trust through demonstrably authentic ethical practices, ultimately contributing to the market's long-term sustainable expansion.
Ethical Labels Industry Company Market Share
Ethical Labels Industry Market Report: 2019-2033
This comprehensive report provides an in-depth analysis of the Ethical Labels Industry, projecting a market value exceeding $XX Million by 2033. The study covers the period from 2019 to 2033, with 2025 as the base and estimated year. This report is crucial for stakeholders seeking to understand market dynamics, identify growth opportunities, and navigate the competitive landscape. It features detailed analysis across various segments and key players like PepsiCo Inc, Ingredion Incorporated, Koninklijke DSM N.V., The Kraft Heinz Company, Kerry Group PLC, Cargill Inc, Go Macro LLC, Archer-Daniels-Midland Company, Garden of Life (Nestlé S.A), and The Hershey Company. This list is not exhaustive.
Ethical Labels Industry Market Dynamics & Concentration
The Ethical Labels Industry exhibits a moderately concentrated market structure, with a few major players holding significant market share. However, the landscape is dynamic, driven by continuous innovation in label types and increasing consumer demand for ethically sourced products. Regulatory frameworks, varying across regions, play a crucial role in shaping market growth. Product substitutes, primarily conventional products lacking ethical certifications, pose a challenge. End-user trends, strongly influenced by ethical and environmental consciousness, are pushing the industry towards significant growth. The historical period (2019-2024) witnessed a notable increase in M&A activity, with approximately XX deals recorded, indicating consolidation and expansion strategies among key players. Market share distribution in 2025 is estimated as follows: Top 5 players hold approximately XX% of the market, with the remaining share distributed across numerous smaller players.
Ethical Labels Industry Industry Trends & Analysis
The Ethical Labels Industry is experiencing robust growth, driven primarily by escalating consumer awareness regarding ethical sourcing, sustainability, and animal welfare. Technological advancements, such as blockchain technology for traceability and improved certification processes, are enhancing transparency and consumer trust. The compound annual growth rate (CAGR) from 2025 to 2033 is projected to be XX%, indicating a substantial market expansion. Market penetration of ethical labels across various product categories is increasing steadily, with significant adoption in the food and beverage sectors. Competitive dynamics are marked by innovation in label types, geographical expansion, and strategic partnerships. The shift towards conscious consumerism and stricter regulations concerning ethical labeling further propel market growth. The market size is estimated at $XX Million in 2025.
Leading Markets & Segments in Ethical Labels Industry
The global ethical labels market is dominated by North America and Europe, driven by strong consumer demand and robust regulatory frameworks. Within these regions, certain countries exhibit higher market penetration than others due to factors like economic policies, consumer awareness, and existing infrastructure.
- By Label Type: Organic and Sustainability labels currently hold the largest market share, followed by Vegan and Fairtrade labels. Growth in Animal Welfare labels is also significant.
- By Product Type: Food products, especially processed foods, dominate the market, with beverages showing substantial growth potential.
- By Distribution Channel: Offline retail channels (supermarkets, hypermarkets) currently account for the larger share, but online sales are experiencing rapid growth due to e-commerce expansion and increased consumer access to ethical products.
Dominance Analysis: The North American market’s dominance stems from high consumer disposable income, a strong regulatory environment promoting ethical labels, and a mature market for organic and sustainably produced goods. European markets show similar trends, although specific national markets within Europe vary in adoption rates due to differences in regulatory environments and consumer preferences.
Ethical Labels Industry Product Developments
Recent product developments focus on enhancing traceability, improving sustainability, and streamlining certification processes. Innovations such as blockchain technology for supply chain transparency and AI-powered verification systems are enhancing consumer trust. The development of new label types, such as those emphasizing carbon footprint reduction and social responsibility, reflects evolving consumer preferences and regulatory demands. This focus on product differentiation and value-added services enhances the competitive advantage of leading players.
Key Drivers of Ethical Labels Industry Growth
Several key factors are driving the growth of the Ethical Labels Industry. Technological advancements, like blockchain for enhanced supply chain transparency, contribute to consumer trust and market expansion. Increasing consumer awareness regarding ethical sourcing and sustainability is a significant driver, further fueled by stricter regulations and governmental initiatives promoting ethical labeling. The growing preference for healthier and environmentally friendly products significantly boosts the market's potential.
Challenges in the Ethical Labels Industry Market
The Ethical Labels Industry faces challenges, including the high cost of certification and labeling, which can create barriers to entry for small businesses. Supply chain complexities and ensuring the authenticity and traceability of products across global networks remain significant hurdles. Competitive pressures, particularly from large multinational companies, also impact smaller players in the market. Inconsistent regulatory frameworks across different regions create compliance challenges, hindering market expansion. These factors collectively impact market growth, estimated to account for a XX% reduction in the overall growth trajectory.
Emerging Opportunities in Ethical Labels Industry
Emerging opportunities exist in expanding into developing markets with growing consumer awareness regarding ethical and sustainable products. Strategic partnerships between ethical label providers and major food and beverage companies can accelerate market penetration. Technological breakthroughs, such as AI-powered verification systems, can enhance transparency and improve consumer trust, further driving market growth.
Leading Players in the Ethical Labels Industry Sector
- PepsiCo Inc
- Ingredion Incorporated
- Koninklijke DSM N.V.
- The Kraft Heinz Company
- Kerry Group PLC
- Cargill Inc
- Go Macro LLC
- Archer-Daniels-Midland Company
- Garden of Life (Nestlé S.A)
- The Hershey Company
Key Milestones in Ethical Labels Industry Industry
- June 2023: Kerry introduced Biobake EgR, an enzyme solution reducing egg usage in baking, enabling cost-effective shifts to free-range or organic eggs, aligning with growing consumer demand for ethical egg-based products. This significantly impacts the animal welfare label segment.
- September 2023: Maranello launched its "Maranello on Earth" ethical label, encompassing criteria for sustainable, recycled, locally sourced, and socially responsible promotional objects. This innovation expands the scope of ethical labeling beyond product ingredients to encompass promotional materials.
Strategic Outlook for Ethical Labels Industry Market
The Ethical Labels Industry holds immense potential for growth, driven by increasing consumer demand for ethically sourced products, technological advancements improving transparency and traceability, and strengthening regulatory frameworks. Strategic partnerships and expansions into new markets, particularly developing economies with rising middle classes and growing awareness of ethical consumption, are key growth accelerators. Focus on innovation, including the development of new label types addressing evolving consumer concerns, will be crucial for companies to maintain a competitive edge and capture market share in this expanding sector.
Ethical Labels Industry Segmentation
-
1. Label Type
- 1.1. Halal
- 1.2. Organic
- 1.3. Clean
- 1.4. Sustainability and Fairtrade labels
- 1.5. Animal Welfare Labels
- 1.6. Vegan Labels
- 1.7. Other Label Types
-
2. Product Type
- 2.1. Food
- 2.2. Beverages
-
3. Distribution Channel
- 3.1. Offline
- 3.2. Online
Ethical Labels Industry Segmentation By Geography
- 1. North America
- 2. Europe
- 3. Asia
- 4. Australia and New Zealand
- 5. Latin America
- 6. Middle East and Africa
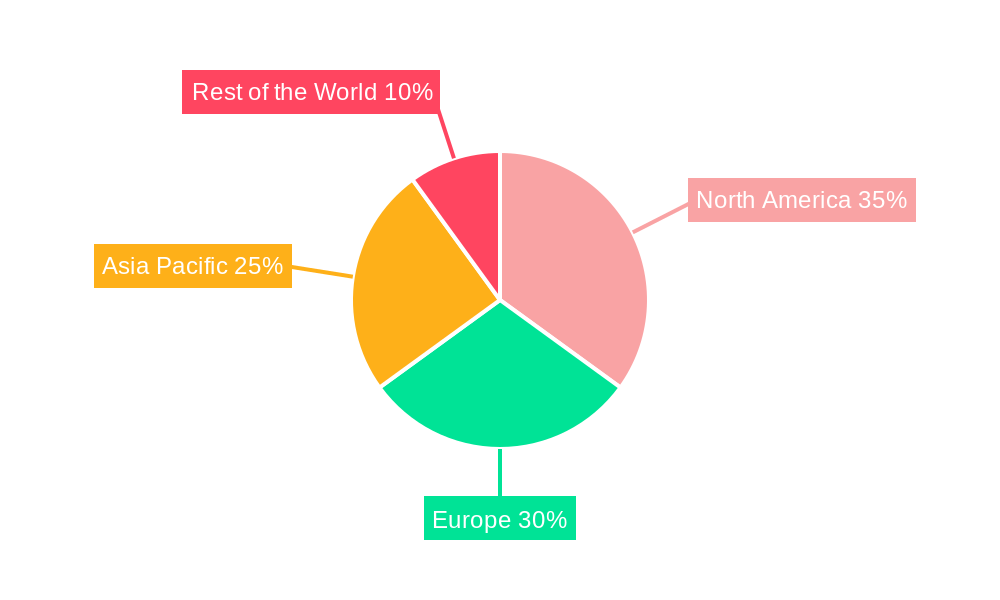
Ethical Labels Industry Regional Market Share
Geographic Coverage of Ethical Labels Industry
Ethical Labels Industry REPORT HIGHLIGHTS
| Aspects | Details |
|---|---|
| Study Period | 2020-2034 |
| Base Year | 2025 |
| Estimated Year | 2026 |
| Forecast Period | 2026-2034 |
| Historical Period | 2020-2025 |
| Growth Rate | CAGR of 7.10% from 2020-2034 |
| Segmentation |
|
Table of Contents
- 1. Introduction
- 1.1. Research Scope
- 1.2. Market Segmentation
- 1.3. Research Objective
- 1.4. Definitions and Assumptions
- 2. Executive Summary
- 2.1. Market Snapshot
- 3. Market Dynamics
- 3.1. Market Drivers
- 3.2. Market Restrains
- 3.3. Market Trends
- 3.4. Market Opportunities
- 4. Market Factor Analysis
- 4.1. Porters Five Forces
- 4.1.1. Bargaining Power of Suppliers
- 4.1.2. Bargaining Power of Buyers
- 4.1.3. Threat of New Entrants
- 4.1.4. Threat of Substitutes
- 4.1.5. Competitive Rivalry
- 4.2. PESTEL analysis
- 4.3. BCG Analysis
- 4.3.1. Stars (High Growth, High Market Share)
- 4.3.2. Cash Cows (Low Growth, High Market Share)
- 4.3.3. Question Mark (High Growth, Low Market Share)
- 4.3.4. Dogs (Low Growth, Low Market Share)
- 4.4. Ansoff Matrix Analysis
- 4.5. Supply Chain Analysis
- 4.6. Regulatory Landscape
- 4.7. Current Market Potential and Opportunity Assessment (TAM–SAM–SOM Framework)
- 4.8. MDP Analyst Note
- 4.1. Porters Five Forces
- 5. Market Analysis, Insights and Forecast 2021-2033
- 5.1. Market Analysis, Insights and Forecast - by Label Type
- 5.1.1. Halal
- 5.1.2. Organic
- 5.1.3. Clean
- 5.1.4. Sustainability and Fairtrade labels
- 5.1.5. Animal Welfare Labels
- 5.1.6. Vegan Labels
- 5.1.7. Other Label Types
- 5.2. Market Analysis, Insights and Forecast - by Product Type
- 5.2.1. Food
- 5.2.2. Beverages
- 5.3. Market Analysis, Insights and Forecast - by Distribution Channel
- 5.3.1. Offline
- 5.3.2. Online
- 5.4. Market Analysis, Insights and Forecast - by Region
- 5.4.1. North America
- 5.4.2. Europe
- 5.4.3. Asia
- 5.4.4. Australia and New Zealand
- 5.4.5. Latin America
- 5.4.6. Middle East and Africa
- 5.1. Market Analysis, Insights and Forecast - by Label Type
- 6. Global Ethical Labels Industry Analysis, Insights and Forecast, 2021-2033
- 6.1. Market Analysis, Insights and Forecast - by Label Type
- 6.1.1. Halal
- 6.1.2. Organic
- 6.1.3. Clean
- 6.1.4. Sustainability and Fairtrade labels
- 6.1.5. Animal Welfare Labels
- 6.1.6. Vegan Labels
- 6.1.7. Other Label Types
- 6.2. Market Analysis, Insights and Forecast - by Product Type
- 6.2.1. Food
- 6.2.2. Beverages
- 6.3. Market Analysis, Insights and Forecast - by Distribution Channel
- 6.3.1. Offline
- 6.3.2. Online
- 6.1. Market Analysis, Insights and Forecast - by Label Type
- 7. North America Ethical Labels Industry Analysis, Insights and Forecast, 2020-2032
- 7.1. Market Analysis, Insights and Forecast - by Label Type
- 7.1.1. Halal
- 7.1.2. Organic
- 7.1.3. Clean
- 7.1.4. Sustainability and Fairtrade labels
- 7.1.5. Animal Welfare Labels
- 7.1.6. Vegan Labels
- 7.1.7. Other Label Types
- 7.2. Market Analysis, Insights and Forecast - by Product Type
- 7.2.1. Food
- 7.2.2. Beverages
- 7.3. Market Analysis, Insights and Forecast - by Distribution Channel
- 7.3.1. Offline
- 7.3.2. Online
- 7.1. Market Analysis, Insights and Forecast - by Label Type
- 8. Europe Ethical Labels Industry Analysis, Insights and Forecast, 2020-2032
- 8.1. Market Analysis, Insights and Forecast - by Label Type
- 8.1.1. Halal
- 8.1.2. Organic
- 8.1.3. Clean
- 8.1.4. Sustainability and Fairtrade labels
- 8.1.5. Animal Welfare Labels
- 8.1.6. Vegan Labels
- 8.1.7. Other Label Types
- 8.2. Market Analysis, Insights and Forecast - by Product Type
- 8.2.1. Food
- 8.2.2. Beverages
- 8.3. Market Analysis, Insights and Forecast - by Distribution Channel
- 8.3.1. Offline
- 8.3.2. Online
- 8.1. Market Analysis, Insights and Forecast - by Label Type
- 9. Asia Ethical Labels Industry Analysis, Insights and Forecast, 2020-2032
- 9.1. Market Analysis, Insights and Forecast - by Label Type
- 9.1.1. Halal
- 9.1.2. Organic
- 9.1.3. Clean
- 9.1.4. Sustainability and Fairtrade labels
- 9.1.5. Animal Welfare Labels
- 9.1.6. Vegan Labels
- 9.1.7. Other Label Types
- 9.2. Market Analysis, Insights and Forecast - by Product Type
- 9.2.1. Food
- 9.2.2. Beverages
- 9.3. Market Analysis, Insights and Forecast - by Distribution Channel
- 9.3.1. Offline
- 9.3.2. Online
- 9.1. Market Analysis, Insights and Forecast - by Label Type
- 10. Australia and New Zealand Ethical Labels Industry Analysis, Insights and Forecast, 2020-2032
- 10.1. Market Analysis, Insights and Forecast - by Label Type
- 10.1.1. Halal
- 10.1.2. Organic
- 10.1.3. Clean
- 10.1.4. Sustainability and Fairtrade labels
- 10.1.5. Animal Welfare Labels
- 10.1.6. Vegan Labels
- 10.1.7. Other Label Types
- 10.2. Market Analysis, Insights and Forecast - by Product Type
- 10.2.1. Food
- 10.2.2. Beverages
- 10.3. Market Analysis, Insights and Forecast - by Distribution Channel
- 10.3.1. Offline
- 10.3.2. Online
- 10.1. Market Analysis, Insights and Forecast - by Label Type
- 11. Latin America Ethical Labels Industry Analysis, Insights and Forecast, 2020-2032
- 11.1. Market Analysis, Insights and Forecast - by Label Type
- 11.1.1. Halal
- 11.1.2. Organic
- 11.1.3. Clean
- 11.1.4. Sustainability and Fairtrade labels
- 11.1.5. Animal Welfare Labels
- 11.1.6. Vegan Labels
- 11.1.7. Other Label Types
- 11.2. Market Analysis, Insights and Forecast - by Product Type
- 11.2.1. Food
- 11.2.2. Beverages
- 11.3. Market Analysis, Insights and Forecast - by Distribution Channel
- 11.3.1. Offline
- 11.3.2. Online
- 11.1. Market Analysis, Insights and Forecast - by Label Type
- 12. Middle East and Africa Ethical Labels Industry Analysis, Insights and Forecast, 2020-2032
- 12.1. Market Analysis, Insights and Forecast - by Label Type
- 12.1.1. Halal
- 12.1.2. Organic
- 12.1.3. Clean
- 12.1.4. Sustainability and Fairtrade labels
- 12.1.5. Animal Welfare Labels
- 12.1.6. Vegan Labels
- 12.1.7. Other Label Types
- 12.2. Market Analysis, Insights and Forecast - by Product Type
- 12.2.1. Food
- 12.2.2. Beverages
- 12.3. Market Analysis, Insights and Forecast - by Distribution Channel
- 12.3.1. Offline
- 12.3.2. Online
- 12.1. Market Analysis, Insights and Forecast - by Label Type
- 13. Competitive Analysis
- 13.1. Company Profiles
- 13.1.1 PepsiCo Inc
- 13.1.1.1. Company Overview
- 13.1.1.2. Products
- 13.1.1.3. Company Financials
- 13.1.1.4. SWOT Analysis
- 13.1.2 Ingredion Incorporated*List Not Exhaustive
- 13.1.2.1. Company Overview
- 13.1.2.2. Products
- 13.1.2.3. Company Financials
- 13.1.2.4. SWOT Analysis
- 13.1.3 Koninklijke DSM N V
- 13.1.3.1. Company Overview
- 13.1.3.2. Products
- 13.1.3.3. Company Financials
- 13.1.3.4. SWOT Analysis
- 13.1.4 The Kraft Heinz Company
- 13.1.4.1. Company Overview
- 13.1.4.2. Products
- 13.1.4.3. Company Financials
- 13.1.4.4. SWOT Analysis
- 13.1.5 Kerry Group PLC
- 13.1.5.1. Company Overview
- 13.1.5.2. Products
- 13.1.5.3. Company Financials
- 13.1.5.4. SWOT Analysis
- 13.1.6 Cargill Inc
- 13.1.6.1. Company Overview
- 13.1.6.2. Products
- 13.1.6.3. Company Financials
- 13.1.6.4. SWOT Analysis
- 13.1.7 Go Macro LLC
- 13.1.7.1. Company Overview
- 13.1.7.2. Products
- 13.1.7.3. Company Financials
- 13.1.7.4. SWOT Analysis
- 13.1.8 Archer-Daniels-Midland Company
- 13.1.8.1. Company Overview
- 13.1.8.2. Products
- 13.1.8.3. Company Financials
- 13.1.8.4. SWOT Analysis
- 13.1.9 Garden of Life (Nestlé S A )
- 13.1.9.1. Company Overview
- 13.1.9.2. Products
- 13.1.9.3. Company Financials
- 13.1.9.4. SWOT Analysis
- 13.1.10 The Hershey Company
- 13.1.10.1. Company Overview
- 13.1.10.2. Products
- 13.1.10.3. Company Financials
- 13.1.10.4. SWOT Analysis
- 13.1.1 PepsiCo Inc
- 13.2. Market Entropy
- 13.2.1 Company's Key Areas Served
- 13.2.2 Recent Developments
- 13.3. Company Market Share Analysis 2025
- 13.3.1 Top 5 Companies Market Share Analysis
- 13.3.2 Top 3 Companies Market Share Analysis
- 13.4. List of Potential Customers
- 14. Research Methodology
List of Figures
- Figure 1: Global Ethical Labels Industry Revenue Breakdown (Million, %) by Region 2025 & 2033
- Figure 2: North America Ethical Labels Industry Revenue (Million), by Label Type 2025 & 2033
- Figure 3: North America Ethical Labels Industry Revenue Share (%), by Label Type 2025 & 2033
- Figure 4: North America Ethical Labels Industry Revenue (Million), by Product Type 2025 & 2033
- Figure 5: North America Ethical Labels Industry Revenue Share (%), by Product Type 2025 & 2033
- Figure 6: North America Ethical Labels Industry Revenue (Million), by Distribution Channel 2025 & 2033
- Figure 7: North America Ethical Labels Industry Revenue Share (%), by Distribution Channel 2025 & 2033
- Figure 8: North America Ethical Labels Industry Revenue (Million), by Country 2025 & 2033
- Figure 9: North America Ethical Labels Industry Revenue Share (%), by Country 2025 & 2033
- Figure 10: Europe Ethical Labels Industry Revenue (Million), by Label Type 2025 & 2033
- Figure 11: Europe Ethical Labels Industry Revenue Share (%), by Label Type 2025 & 2033
- Figure 12: Europe Ethical Labels Industry Revenue (Million), by Product Type 2025 & 2033
- Figure 13: Europe Ethical Labels Industry Revenue Share (%), by Product Type 2025 & 2033
- Figure 14: Europe Ethical Labels Industry Revenue (Million), by Distribution Channel 2025 & 2033
- Figure 15: Europe Ethical Labels Industry Revenue Share (%), by Distribution Channel 2025 & 2033
- Figure 16: Europe Ethical Labels Industry Revenue (Million), by Country 2025 & 2033
- Figure 17: Europe Ethical Labels Industry Revenue Share (%), by Country 2025 & 2033
- Figure 18: Asia Ethical Labels Industry Revenue (Million), by Label Type 2025 & 2033
- Figure 19: Asia Ethical Labels Industry Revenue Share (%), by Label Type 2025 & 2033
- Figure 20: Asia Ethical Labels Industry Revenue (Million), by Product Type 2025 & 2033
- Figure 21: Asia Ethical Labels Industry Revenue Share (%), by Product Type 2025 & 2033
- Figure 22: Asia Ethical Labels Industry Revenue (Million), by Distribution Channel 2025 & 2033
- Figure 23: Asia Ethical Labels Industry Revenue Share (%), by Distribution Channel 2025 & 2033
- Figure 24: Asia Ethical Labels Industry Revenue (Million), by Country 2025 & 2033
- Figure 25: Asia Ethical Labels Industry Revenue Share (%), by Country 2025 & 2033
- Figure 26: Australia and New Zealand Ethical Labels Industry Revenue (Million), by Label Type 2025 & 2033
- Figure 27: Australia and New Zealand Ethical Labels Industry Revenue Share (%), by Label Type 2025 & 2033
- Figure 28: Australia and New Zealand Ethical Labels Industry Revenue (Million), by Product Type 2025 & 2033
- Figure 29: Australia and New Zealand Ethical Labels Industry Revenue Share (%), by Product Type 2025 & 2033
- Figure 30: Australia and New Zealand Ethical Labels Industry Revenue (Million), by Distribution Channel 2025 & 2033
- Figure 31: Australia and New Zealand Ethical Labels Industry Revenue Share (%), by Distribution Channel 2025 & 2033
- Figure 32: Australia and New Zealand Ethical Labels Industry Revenue (Million), by Country 2025 & 2033
- Figure 33: Australia and New Zealand Ethical Labels Industry Revenue Share (%), by Country 2025 & 2033
- Figure 34: Latin America Ethical Labels Industry Revenue (Million), by Label Type 2025 & 2033
- Figure 35: Latin America Ethical Labels Industry Revenue Share (%), by Label Type 2025 & 2033
- Figure 36: Latin America Ethical Labels Industry Revenue (Million), by Product Type 2025 & 2033
- Figure 37: Latin America Ethical Labels Industry Revenue Share (%), by Product Type 2025 & 2033
- Figure 38: Latin America Ethical Labels Industry Revenue (Million), by Distribution Channel 2025 & 2033
- Figure 39: Latin America Ethical Labels Industry Revenue Share (%), by Distribution Channel 2025 & 2033
- Figure 40: Latin America Ethical Labels Industry Revenue (Million), by Country 2025 & 2033
- Figure 41: Latin America Ethical Labels Industry Revenue Share (%), by Country 2025 & 2033
- Figure 42: Middle East and Africa Ethical Labels Industry Revenue (Million), by Label Type 2025 & 2033
- Figure 43: Middle East and Africa Ethical Labels Industry Revenue Share (%), by Label Type 2025 & 2033
- Figure 44: Middle East and Africa Ethical Labels Industry Revenue (Million), by Product Type 2025 & 2033
- Figure 45: Middle East and Africa Ethical Labels Industry Revenue Share (%), by Product Type 2025 & 2033
- Figure 46: Middle East and Africa Ethical Labels Industry Revenue (Million), by Distribution Channel 2025 & 2033
- Figure 47: Middle East and Africa Ethical Labels Industry Revenue Share (%), by Distribution Channel 2025 & 2033
- Figure 48: Middle East and Africa Ethical Labels Industry Revenue (Million), by Country 2025 & 2033
- Figure 49: Middle East and Africa Ethical Labels Industry Revenue Share (%), by Country 2025 & 2033
List of Tables
- Table 1: Global Ethical Labels Industry Revenue Million Forecast, by Label Type 2020 & 2033
- Table 2: Global Ethical Labels Industry Revenue Million Forecast, by Product Type 2020 & 2033
- Table 3: Global Ethical Labels Industry Revenue Million Forecast, by Distribution Channel 2020 & 2033
- Table 4: Global Ethical Labels Industry Revenue Million Forecast, by Region 2020 & 2033
- Table 5: Global Ethical Labels Industry Revenue Million Forecast, by Label Type 2020 & 2033
- Table 6: Global Ethical Labels Industry Revenue Million Forecast, by Product Type 2020 & 2033
- Table 7: Global Ethical Labels Industry Revenue Million Forecast, by Distribution Channel 2020 & 2033
- Table 8: Global Ethical Labels Industry Revenue Million Forecast, by Country 2020 & 2033
- Table 9: Global Ethical Labels Industry Revenue Million Forecast, by Label Type 2020 & 2033
- Table 10: Global Ethical Labels Industry Revenue Million Forecast, by Product Type 2020 & 2033
- Table 11: Global Ethical Labels Industry Revenue Million Forecast, by Distribution Channel 2020 & 2033
- Table 12: Global Ethical Labels Industry Revenue Million Forecast, by Country 2020 & 2033
- Table 13: Global Ethical Labels Industry Revenue Million Forecast, by Label Type 2020 & 2033
- Table 14: Global Ethical Labels Industry Revenue Million Forecast, by Product Type 2020 & 2033
- Table 15: Global Ethical Labels Industry Revenue Million Forecast, by Distribution Channel 2020 & 2033
- Table 16: Global Ethical Labels Industry Revenue Million Forecast, by Country 2020 & 2033
- Table 17: Global Ethical Labels Industry Revenue Million Forecast, by Label Type 2020 & 2033
- Table 18: Global Ethical Labels Industry Revenue Million Forecast, by Product Type 2020 & 2033
- Table 19: Global Ethical Labels Industry Revenue Million Forecast, by Distribution Channel 2020 & 2033
- Table 20: Global Ethical Labels Industry Revenue Million Forecast, by Country 2020 & 2033
- Table 21: Global Ethical Labels Industry Revenue Million Forecast, by Label Type 2020 & 2033
- Table 22: Global Ethical Labels Industry Revenue Million Forecast, by Product Type 2020 & 2033
- Table 23: Global Ethical Labels Industry Revenue Million Forecast, by Distribution Channel 2020 & 2033
- Table 24: Global Ethical Labels Industry Revenue Million Forecast, by Country 2020 & 2033
- Table 25: Global Ethical Labels Industry Revenue Million Forecast, by Label Type 2020 & 2033
- Table 26: Global Ethical Labels Industry Revenue Million Forecast, by Product Type 2020 & 2033
- Table 27: Global Ethical Labels Industry Revenue Million Forecast, by Distribution Channel 2020 & 2033
- Table 28: Global Ethical Labels Industry Revenue Million Forecast, by Country 2020 & 2033
Frequently Asked Questions
1. What is the projected Compound Annual Growth Rate (CAGR) of the Ethical Labels Industry?
The projected CAGR is approximately 7.10%.
2. Which companies are prominent players in the Ethical Labels Industry?
Key companies in the market include PepsiCo Inc, Ingredion Incorporated*List Not Exhaustive, Koninklijke DSM N V, The Kraft Heinz Company, Kerry Group PLC, Cargill Inc, Go Macro LLC, Archer-Daniels-Midland Company, Garden of Life (Nestlé S A ), The Hershey Company.
3. What are the main segments of the Ethical Labels Industry?
The market segments include Label Type, Product Type, Distribution Channel.
4. Can you provide details about the market size?
The market size is estimated to be USD 0.94 Million as of 2022.
5. What are some drivers contributing to market growth?
Increased Consumer Conscious toward Health and Ethical Values; Growth due to Online Retailing and CSR Activities; Reduction in Meat Consumption for Environmental Sustainability.
6. What are the notable trends driving market growth?
Beverages To Occupy Highest Market Share.
7. Are there any restraints impacting market growth?
Increasing Competition Among Players.
8. Can you provide examples of recent developments in the market?
September 2023: Maranello launched its ethical label. To obtain the Maranello on Earth label, a product must fulfill one of 4 criteria: a useful, sustainable promotional object that can be recycled and that is biodegradable, or a renewable promotional object that uses fewer materials or eco-designed materials produced using organic and recycled materials. It can also be a promotional object with a low carbon footprint, using locally-produced raw materials and green transport over short distances, or a promotional object with a socially positive contribution, environmentally ethical, using European, national, or even local know-how; using local or international, charity-based, socially responsible or fair-trade manufacture.
9. What pricing options are available for accessing the report?
Pricing options include single-user, multi-user, and enterprise licenses priced at USD 4750, USD 5250, and USD 8750 respectively.
10. Is the market size provided in terms of value or volume?
The market size is provided in terms of value, measured in Million.
11. Are there any specific market keywords associated with the report?
Yes, the market keyword associated with the report is "Ethical Labels Industry," which aids in identifying and referencing the specific market segment covered.
12. How do I determine which pricing option suits my needs best?
The pricing options vary based on user requirements and access needs. Individual users may opt for single-user licenses, while businesses requiring broader access may choose multi-user or enterprise licenses for cost-effective access to the report.
13. Are there any additional resources or data provided in the Ethical Labels Industry report?
While the report offers comprehensive insights, it's advisable to review the specific contents or supplementary materials provided to ascertain if additional resources or data are available.
14. How can I stay updated on further developments or reports in the Ethical Labels Industry?
To stay informed about further developments, trends, and reports in the Ethical Labels Industry, consider subscribing to industry newsletters, following relevant companies and organizations, or regularly checking reputable industry news sources and publications.
Methodology
Step 1 - Identification of Relevant Samples Size from Population Database


Step 2 - Approaches for Defining Global Market Size (Value, Volume* & Price*)

Note*: In applicable scenarios
Step 3 - Data Sources
Primary Research
- Web Analytics
- Survey Reports
- Research Institute
- Latest Research Reports
- Opinion Leaders
Secondary Research
- Annual Reports
- White Paper
- Latest Press Release
- Industry Association
- Paid Database
- Investor Presentations

Step 4 - Data Triangulation
Involves using different sources of information in order to increase the validity of a study
These sources are likely to be stakeholders in a program - participants, other researchers, program staff, other community members, and so on.
Then we put all data in single framework & apply various statistical tools to find out the dynamic on the market.
During the analysis stage, feedback from the stakeholder groups would be compared to determine areas of agreement as well as areas of divergence