

Key Insights
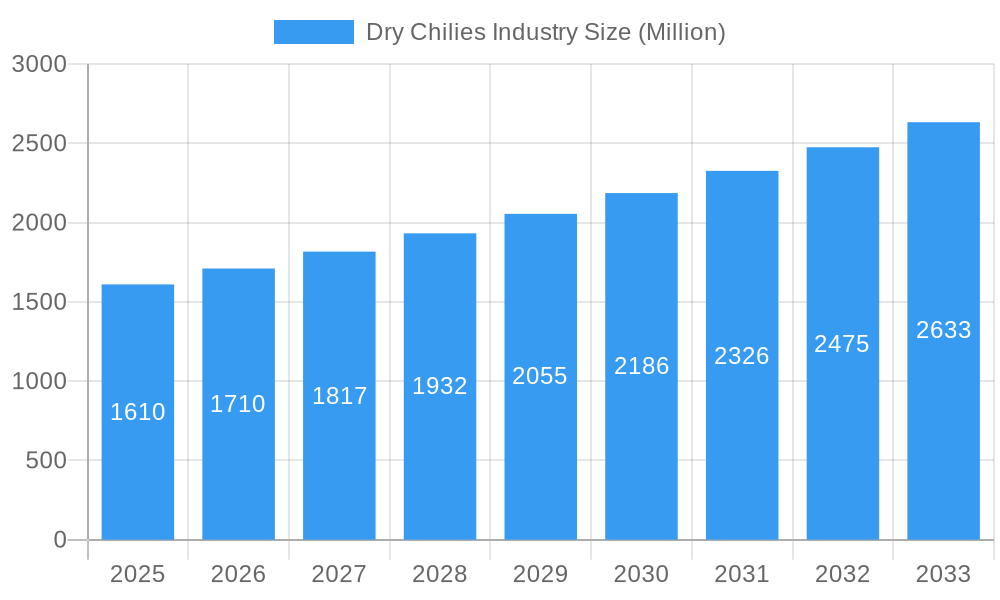
The global dry chilies market, valued at $1.61 billion in 2025, is projected to experience robust growth, driven by increasing demand from the food and beverage industry, particularly in expanding cuisines incorporating chili peppers. The rising popularity of spicy food globally, fueled by evolving culinary preferences and diverse ethnic food consumption, significantly contributes to this market expansion. Furthermore, the application of chili peppers in pharmaceuticals, cosmetics, and pesticides, albeit a smaller segment, offers promising avenues for future growth. The market's growth is further supported by advancements in processing and packaging technologies, ensuring consistent quality and extended shelf life of dry chilies. However, factors such as fluctuating chili pepper prices due to weather conditions and variations in crop yields pose challenges to market stability. Regional variations in consumption patterns also influence market dynamics, with North America and Asia Pacific expected to be leading markets due to high consumption rates and a thriving food processing sector. The current CAGR of 6.11% suggests sustained growth through 2033, though this rate might fluctuate slightly based on external factors influencing agricultural production. Competition among key players, including Syngenta India, Sunrise Foods, Laxmi Organic Industries, AIC India, and Rico Company, is expected to remain intense, with a focus on product diversification and innovation to capture market share.
Dry Chilies Industry Market Size (In Billion)
The segmentation of the dry chilies market by product type (Guajillo, Ancho, Chipotle, Pasilla, California Chili) and application (food and beverage, pharmaceuticals, cosmetics, pesticides) provides valuable insights into market dynamics. The food and beverage industry remains the dominant application, with potential for growth within niche segments such as organic and specialty chili products. The pharmaceutical and cosmetic industries present opportunities for value-added products utilizing chili extracts and compounds. The geographical spread of the market offers diverse opportunities with potential for expansion in emerging economies driven by rising disposable incomes and changing dietary habits. A comprehensive understanding of these market segments and regional variations is crucial for developing effective market strategies and forecasting future market trends.
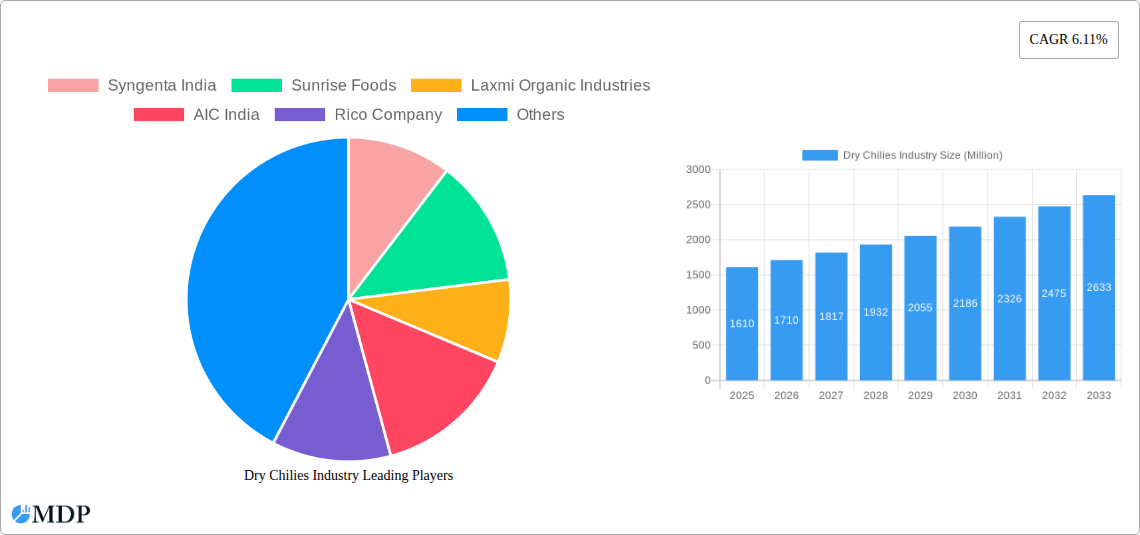
Dry Chilies Industry Company Market Share
Dry Chilies Industry: A Comprehensive Market Report (2019-2033)
This comprehensive report provides an in-depth analysis of the global dry chilies industry, offering invaluable insights for stakeholders across the value chain. From market dynamics and concentration to leading players and future growth opportunities, this report covers all essential aspects of this dynamic market, projected to reach xx Million by 2033. This report covers the historical period of 2019-2024, a base year of 2025, and an estimated and forecast period of 2025-2033. Key players such as Syngenta India, Sunrise Foods, Laxmi Organic Industries, AIC India, and Rico Company are analyzed in detail.
Dry Chilies Industry Market Dynamics & Concentration
The dry chilies market is characterized by a moderately concentrated landscape, with a few major players holding significant market share. While exact figures are proprietary, we estimate that the top 5 players account for approximately xx% of the global market share in 2025. Market concentration is influenced by factors such as economies of scale in production and distribution, as well as brand recognition and established supply chains. Innovation is crucial, driven by the development of high-yield chili varieties, improved processing technologies, and the expansion into new applications. Regulatory frameworks concerning food safety and pesticide residues significantly impact operations. Product substitutes, such as other spices or flavoring agents, exert some competitive pressure, but the unique flavor profile of dry chilies maintains its strong position in various food applications. End-user trends toward healthier and more flavorful food options continue to fuel market growth. Mergers and acquisitions (M&A) activity within the industry has been moderate in recent years, with an estimated xx M&A deals recorded between 2019 and 2024.
- Market Share Concentration: Top 5 players holding approximately xx% (2025 estimate).
- Innovation Drivers: High-yield varieties, improved processing, new applications.
- Regulatory Frameworks: Food safety standards, pesticide residue limits.
- M&A Activity: xx deals (2019-2024 estimate).
Dry Chilies Industry Industry Trends & Analysis
The global dry chilies market is experiencing robust growth, driven by increasing demand from the food and beverage industry, particularly in emerging economies. The Compound Annual Growth Rate (CAGR) is estimated to be xx% during the forecast period (2025-2033). This growth is fueled by rising disposable incomes, changing consumer preferences towards spicy food, and the expanding global population. Technological advancements in cultivation and processing contribute to increased efficiency and product quality. Consumer preferences are shifting toward organic and sustainably sourced chilies, creating opportunities for producers adopting such practices. Competitive dynamics are characterized by price competition, product differentiation, and brand building. Market penetration is highest in regions with established culinary traditions centered around chili peppers, though global expansion continues to broaden the customer base.
Leading Markets & Segments in Dry Chilies Industry
The dry chilies market displays regional variations in consumption and production. While precise market shares require proprietary data, [mention a dominant region, e.g., Asia] is currently the leading market, driven by high consumption in countries such as [mention specific country]. The food and beverage industry is the dominant application segment, followed by pharmaceutical and cosmetic applications. The California chili holds a significant market share among product types.
- Key Drivers for Dominant Regions:
- High population density and chili consumption habits.
- Favorable climatic conditions for cultivation.
- Strong domestic supply chains and production capabilities.
- Supportive government policies for agricultural development.
- Dominant Segment Analysis: Food and beverage industry, driven by culinary uses in diverse cuisines globally.
Dry Chilies Industry Product Developments
Recent product innovations focus on enhancing chili quality, yield, and shelf life. Technological advancements include improved processing techniques to enhance the flavor and color of dry chilies, along with the development of value-added products like chili powders, flakes, and extracts. These innovations cater to diverse consumer needs and preferences, contributing to the overall market growth. The development of disease-resistant chili varieties addresses critical agricultural challenges, ensuring consistent product supply.
Key Drivers of Dry Chilies Industry Growth
Several factors are driving the growth of the dry chilies industry. Rising global demand for spicy foods, coupled with increasing disposable incomes in developing countries, is a major contributor. Technological advancements in agriculture and processing contribute to higher yields and improved product quality. Supportive government policies in several key chili-producing regions are also encouraging investment and growth within the sector. Furthermore, expanding applications of dry chilies in pharmaceuticals and cosmetics present new market opportunities.
Challenges in the Dry Chilies Industry Market
The dry chilies industry faces several challenges. Climate change poses a significant threat, impacting crop yields and product quality. Fluctuations in chili prices due to unpredictable weather conditions can affect profitability. Supply chain disruptions can also hinder market efficiency. Competition from substitute products and the need to meet stringent food safety regulations are further challenges. These factors can collectively decrease the profitability of the industry if not properly addressed. Estimated losses due to these factors are approximately xx Million annually.
Emerging Opportunities in Dry Chilies Industry
The dry chilies industry offers promising long-term growth opportunities. Technological advancements in precision agriculture can enhance yields and sustainability. Strategic partnerships between producers, processors, and retailers can improve supply chain efficiency. Expanding into new markets with growing demand for chili peppers provides significant growth potential. The development of new chili-based food and non-food products further contributes to the market expansion.
Leading Players in the Dry Chilies Industry Sector
- Syngenta India
- Sunrise Foods
- Laxmi Organic Industries
- AIC India
- Rico Company
Key Milestones in Dry Chilies Industry Industry
- June 2022: Syngenta India partnered with the Agriculture Insurance Company of India (AIC) to mitigate price volatility for farmers. This initiative aimed to enhance farmer resilience against market fluctuations, boosting production stability.
- November 2022: The Indonesian government implemented strategic policies to boost domestic chili production, reducing reliance on imports. This included initiatives to improve farming infrastructure, seed quality, and farmer capacity. This policy significantly impacted the global market by reducing reliance on Indonesian imports.
Strategic Outlook for Dry Chilies Industry Market
The future of the dry chilies market looks promising, with continued growth driven by increasing global demand, technological innovation, and strategic expansion. Companies that embrace sustainable farming practices, invest in research and development, and effectively manage their supply chains will be well-positioned to capitalize on future opportunities. Focusing on product diversification and value addition will enhance profitability and market share. The industry needs to proactively address climate change challenges and regulatory hurdles to sustain long-term growth.
Dry Chilies Industry Segmentation
- 1. Production Analysis
- 2. Consumption Analysis
- 3. Import Market Analysis (Value & Volume)
- 4. Export Market Analysis (Value & Volume)
- 5. Price Trend Analysis
Dry Chilies Industry Segmentation By Geography
-
1. North America
- 1.1. United States
- 1.2. Canada
- 1.3. Mexico
-
2. Europe
- 2.1. United Kingdom
- 2.2. Germany
- 2.3. France
- 2.4. Spain
-
3. Asia Pacific
- 3.1. China
- 3.2. Australia
- 3.3. India
-
4. South America
- 4.1. Brazil
- 4.2. Argentina
-
5. Africa
- 5.1. South Africa
- 5.2. Egypt
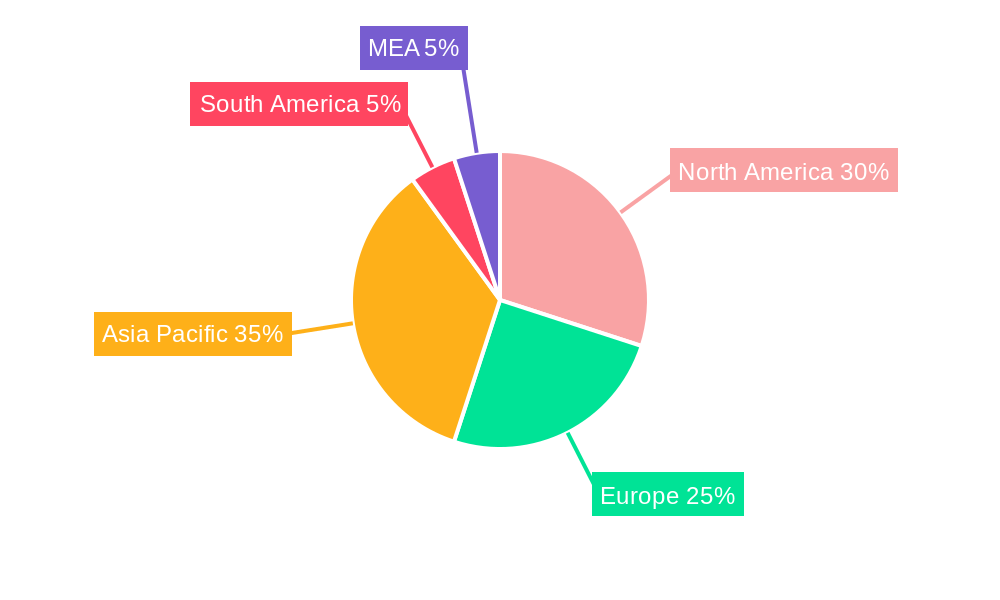
Dry Chilies Industry Regional Market Share
Geographic Coverage of Dry Chilies Industry
Dry Chilies Industry REPORT HIGHLIGHTS
| Aspects | Details |
|---|---|
| Study Period | 2020-2034 |
| Base Year | 2025 |
| Estimated Year | 2026 |
| Forecast Period | 2026-2034 |
| Historical Period | 2020-2025 |
| Growth Rate | CAGR of 6.11% from 2020-2034 |
| Segmentation |
|
Table of Contents
- 1. Introduction
- 1.1. Research Scope
- 1.2. Market Segmentation
- 1.3. Research Objective
- 1.4. Definitions and Assumptions
- 2. Executive Summary
- 2.1. Market Snapshot
- 3. Market Dynamics
- 3.1. Market Drivers
- 3.2. Market Restrains
- 3.3. Market Trends
- 3.4. Market Opportunities
- 4. Market Factor Analysis
- 4.1. Porters Five Forces
- 4.1.1. Bargaining Power of Suppliers
- 4.1.2. Bargaining Power of Buyers
- 4.1.3. Threat of New Entrants
- 4.1.4. Threat of Substitutes
- 4.1.5. Competitive Rivalry
- 4.2. PESTEL analysis
- 4.3. BCG Analysis
- 4.3.1. Stars (High Growth, High Market Share)
- 4.3.2. Cash Cows (Low Growth, High Market Share)
- 4.3.3. Question Mark (High Growth, Low Market Share)
- 4.3.4. Dogs (Low Growth, Low Market Share)
- 4.4. Ansoff Matrix Analysis
- 4.5. Supply Chain Analysis
- 4.6. Regulatory Landscape
- 4.7. Current Market Potential and Opportunity Assessment (TAM–SAM–SOM Framework)
- 4.8. MDP Analyst Note
- 4.1. Porters Five Forces
- 5. Market Analysis, Insights and Forecast 2021-2033
- 5.1. Market Analysis, Insights and Forecast - by Production Analysis
- 5.2. Market Analysis, Insights and Forecast - by Consumption Analysis
- 5.3. Market Analysis, Insights and Forecast - by Import Market Analysis (Value & Volume)
- 5.4. Market Analysis, Insights and Forecast - by Export Market Analysis (Value & Volume)
- 5.5. Market Analysis, Insights and Forecast - by Price Trend Analysis
- 5.6. Market Analysis, Insights and Forecast - by Region
- 5.6.1. North America
- 5.6.2. Europe
- 5.6.3. Asia Pacific
- 5.6.4. South America
- 5.6.5. Africa
- 6. Global Dry Chilies Industry Analysis, Insights and Forecast, 2021-2033
- 6.1. Market Analysis, Insights and Forecast - by Production Analysis
- 6.2. Market Analysis, Insights and Forecast - by Consumption Analysis
- 6.3. Market Analysis, Insights and Forecast - by Import Market Analysis (Value & Volume)
- 6.4. Market Analysis, Insights and Forecast - by Export Market Analysis (Value & Volume)
- 6.5. Market Analysis, Insights and Forecast - by Price Trend Analysis
- 7. North America Dry Chilies Industry Analysis, Insights and Forecast, 2020-2032
- 7.1. Market Analysis, Insights and Forecast - by Production Analysis
- 7.2. Market Analysis, Insights and Forecast - by Consumption Analysis
- 7.3. Market Analysis, Insights and Forecast - by Import Market Analysis (Value & Volume)
- 7.4. Market Analysis, Insights and Forecast - by Export Market Analysis (Value & Volume)
- 7.5. Market Analysis, Insights and Forecast - by Price Trend Analysis
- 8. Europe Dry Chilies Industry Analysis, Insights and Forecast, 2020-2032
- 8.1. Market Analysis, Insights and Forecast - by Production Analysis
- 8.2. Market Analysis, Insights and Forecast - by Consumption Analysis
- 8.3. Market Analysis, Insights and Forecast - by Import Market Analysis (Value & Volume)
- 8.4. Market Analysis, Insights and Forecast - by Export Market Analysis (Value & Volume)
- 8.5. Market Analysis, Insights and Forecast - by Price Trend Analysis
- 9. Asia Pacific Dry Chilies Industry Analysis, Insights and Forecast, 2020-2032
- 9.1. Market Analysis, Insights and Forecast - by Production Analysis
- 9.2. Market Analysis, Insights and Forecast - by Consumption Analysis
- 9.3. Market Analysis, Insights and Forecast - by Import Market Analysis (Value & Volume)
- 9.4. Market Analysis, Insights and Forecast - by Export Market Analysis (Value & Volume)
- 9.5. Market Analysis, Insights and Forecast - by Price Trend Analysis
- 10. South America Dry Chilies Industry Analysis, Insights and Forecast, 2020-2032
- 10.1. Market Analysis, Insights and Forecast - by Production Analysis
- 10.2. Market Analysis, Insights and Forecast - by Consumption Analysis
- 10.3. Market Analysis, Insights and Forecast - by Import Market Analysis (Value & Volume)
- 10.4. Market Analysis, Insights and Forecast - by Export Market Analysis (Value & Volume)
- 10.5. Market Analysis, Insights and Forecast - by Price Trend Analysis
- 11. Africa Dry Chilies Industry Analysis, Insights and Forecast, 2020-2032
- 11.1. Market Analysis, Insights and Forecast - by Production Analysis
- 11.2. Market Analysis, Insights and Forecast - by Consumption Analysis
- 11.3. Market Analysis, Insights and Forecast - by Import Market Analysis (Value & Volume)
- 11.4. Market Analysis, Insights and Forecast - by Export Market Analysis (Value & Volume)
- 11.5. Market Analysis, Insights and Forecast - by Price Trend Analysis
- 12. Competitive Analysis
- 12.1. Company Profiles
- 12.1.1 Syngenta India
- 12.1.1.1. Company Overview
- 12.1.1.2. Products
- 12.1.1.3. Company Financials
- 12.1.1.4. SWOT Analysis
- 12.1.2 Sunrise Foods
- 12.1.2.1. Company Overview
- 12.1.2.2. Products
- 12.1.2.3. Company Financials
- 12.1.2.4. SWOT Analysis
- 12.1.3 Laxmi Organic Industries
- 12.1.3.1. Company Overview
- 12.1.3.2. Products
- 12.1.3.3. Company Financials
- 12.1.3.4. SWOT Analysis
- 12.1.4 AIC India
- 12.1.4.1. Company Overview
- 12.1.4.2. Products
- 12.1.4.3. Company Financials
- 12.1.4.4. SWOT Analysis
- 12.1.5 Rico Company
- 12.1.5.1. Company Overview
- 12.1.5.2. Products
- 12.1.5.3. Company Financials
- 12.1.5.4. SWOT Analysis
- 12.1.1 Syngenta India
- 12.2. Market Entropy
- 12.2.1 Company's Key Areas Served
- 12.2.2 Recent Developments
- 12.3. Company Market Share Analysis 2025
- 12.3.1 Top 5 Companies Market Share Analysis
- 12.3.2 Top 3 Companies Market Share Analysis
- 12.4. List of Potential Customers
- 13. Research Methodology
List of Figures
- Figure 1: Global Dry Chilies Industry Revenue Breakdown (Million, %) by Region 2025 & 2033
- Figure 2: North America Dry Chilies Industry Revenue (Million), by Production Analysis 2025 & 2033
- Figure 3: North America Dry Chilies Industry Revenue Share (%), by Production Analysis 2025 & 2033
- Figure 4: North America Dry Chilies Industry Revenue (Million), by Consumption Analysis 2025 & 2033
- Figure 5: North America Dry Chilies Industry Revenue Share (%), by Consumption Analysis 2025 & 2033
- Figure 6: North America Dry Chilies Industry Revenue (Million), by Import Market Analysis (Value & Volume) 2025 & 2033
- Figure 7: North America Dry Chilies Industry Revenue Share (%), by Import Market Analysis (Value & Volume) 2025 & 2033
- Figure 8: North America Dry Chilies Industry Revenue (Million), by Export Market Analysis (Value & Volume) 2025 & 2033
- Figure 9: North America Dry Chilies Industry Revenue Share (%), by Export Market Analysis (Value & Volume) 2025 & 2033
- Figure 10: North America Dry Chilies Industry Revenue (Million), by Price Trend Analysis 2025 & 2033
- Figure 11: North America Dry Chilies Industry Revenue Share (%), by Price Trend Analysis 2025 & 2033
- Figure 12: North America Dry Chilies Industry Revenue (Million), by Country 2025 & 2033
- Figure 13: North America Dry Chilies Industry Revenue Share (%), by Country 2025 & 2033
- Figure 14: Europe Dry Chilies Industry Revenue (Million), by Production Analysis 2025 & 2033
- Figure 15: Europe Dry Chilies Industry Revenue Share (%), by Production Analysis 2025 & 2033
- Figure 16: Europe Dry Chilies Industry Revenue (Million), by Consumption Analysis 2025 & 2033
- Figure 17: Europe Dry Chilies Industry Revenue Share (%), by Consumption Analysis 2025 & 2033
- Figure 18: Europe Dry Chilies Industry Revenue (Million), by Import Market Analysis (Value & Volume) 2025 & 2033
- Figure 19: Europe Dry Chilies Industry Revenue Share (%), by Import Market Analysis (Value & Volume) 2025 & 2033
- Figure 20: Europe Dry Chilies Industry Revenue (Million), by Export Market Analysis (Value & Volume) 2025 & 2033
- Figure 21: Europe Dry Chilies Industry Revenue Share (%), by Export Market Analysis (Value & Volume) 2025 & 2033
- Figure 22: Europe Dry Chilies Industry Revenue (Million), by Price Trend Analysis 2025 & 2033
- Figure 23: Europe Dry Chilies Industry Revenue Share (%), by Price Trend Analysis 2025 & 2033
- Figure 24: Europe Dry Chilies Industry Revenue (Million), by Country 2025 & 2033
- Figure 25: Europe Dry Chilies Industry Revenue Share (%), by Country 2025 & 2033
- Figure 26: Asia Pacific Dry Chilies Industry Revenue (Million), by Production Analysis 2025 & 2033
- Figure 27: Asia Pacific Dry Chilies Industry Revenue Share (%), by Production Analysis 2025 & 2033
- Figure 28: Asia Pacific Dry Chilies Industry Revenue (Million), by Consumption Analysis 2025 & 2033
- Figure 29: Asia Pacific Dry Chilies Industry Revenue Share (%), by Consumption Analysis 2025 & 2033
- Figure 30: Asia Pacific Dry Chilies Industry Revenue (Million), by Import Market Analysis (Value & Volume) 2025 & 2033
- Figure 31: Asia Pacific Dry Chilies Industry Revenue Share (%), by Import Market Analysis (Value & Volume) 2025 & 2033
- Figure 32: Asia Pacific Dry Chilies Industry Revenue (Million), by Export Market Analysis (Value & Volume) 2025 & 2033
- Figure 33: Asia Pacific Dry Chilies Industry Revenue Share (%), by Export Market Analysis (Value & Volume) 2025 & 2033
- Figure 34: Asia Pacific Dry Chilies Industry Revenue (Million), by Price Trend Analysis 2025 & 2033
- Figure 35: Asia Pacific Dry Chilies Industry Revenue Share (%), by Price Trend Analysis 2025 & 2033
- Figure 36: Asia Pacific Dry Chilies Industry Revenue (Million), by Country 2025 & 2033
- Figure 37: Asia Pacific Dry Chilies Industry Revenue Share (%), by Country 2025 & 2033
- Figure 38: South America Dry Chilies Industry Revenue (Million), by Production Analysis 2025 & 2033
- Figure 39: South America Dry Chilies Industry Revenue Share (%), by Production Analysis 2025 & 2033
- Figure 40: South America Dry Chilies Industry Revenue (Million), by Consumption Analysis 2025 & 2033
- Figure 41: South America Dry Chilies Industry Revenue Share (%), by Consumption Analysis 2025 & 2033
- Figure 42: South America Dry Chilies Industry Revenue (Million), by Import Market Analysis (Value & Volume) 2025 & 2033
- Figure 43: South America Dry Chilies Industry Revenue Share (%), by Import Market Analysis (Value & Volume) 2025 & 2033
- Figure 44: South America Dry Chilies Industry Revenue (Million), by Export Market Analysis (Value & Volume) 2025 & 2033
- Figure 45: South America Dry Chilies Industry Revenue Share (%), by Export Market Analysis (Value & Volume) 2025 & 2033
- Figure 46: South America Dry Chilies Industry Revenue (Million), by Price Trend Analysis 2025 & 2033
- Figure 47: South America Dry Chilies Industry Revenue Share (%), by Price Trend Analysis 2025 & 2033
- Figure 48: South America Dry Chilies Industry Revenue (Million), by Country 2025 & 2033
- Figure 49: South America Dry Chilies Industry Revenue Share (%), by Country 2025 & 2033
- Figure 50: Africa Dry Chilies Industry Revenue (Million), by Production Analysis 2025 & 2033
- Figure 51: Africa Dry Chilies Industry Revenue Share (%), by Production Analysis 2025 & 2033
- Figure 52: Africa Dry Chilies Industry Revenue (Million), by Consumption Analysis 2025 & 2033
- Figure 53: Africa Dry Chilies Industry Revenue Share (%), by Consumption Analysis 2025 & 2033
- Figure 54: Africa Dry Chilies Industry Revenue (Million), by Import Market Analysis (Value & Volume) 2025 & 2033
- Figure 55: Africa Dry Chilies Industry Revenue Share (%), by Import Market Analysis (Value & Volume) 2025 & 2033
- Figure 56: Africa Dry Chilies Industry Revenue (Million), by Export Market Analysis (Value & Volume) 2025 & 2033
- Figure 57: Africa Dry Chilies Industry Revenue Share (%), by Export Market Analysis (Value & Volume) 2025 & 2033
- Figure 58: Africa Dry Chilies Industry Revenue (Million), by Price Trend Analysis 2025 & 2033
- Figure 59: Africa Dry Chilies Industry Revenue Share (%), by Price Trend Analysis 2025 & 2033
- Figure 60: Africa Dry Chilies Industry Revenue (Million), by Country 2025 & 2033
- Figure 61: Africa Dry Chilies Industry Revenue Share (%), by Country 2025 & 2033
List of Tables
- Table 1: Global Dry Chilies Industry Revenue Million Forecast, by Production Analysis 2020 & 2033
- Table 2: Global Dry Chilies Industry Revenue Million Forecast, by Consumption Analysis 2020 & 2033
- Table 3: Global Dry Chilies Industry Revenue Million Forecast, by Import Market Analysis (Value & Volume) 2020 & 2033
- Table 4: Global Dry Chilies Industry Revenue Million Forecast, by Export Market Analysis (Value & Volume) 2020 & 2033
- Table 5: Global Dry Chilies Industry Revenue Million Forecast, by Price Trend Analysis 2020 & 2033
- Table 6: Global Dry Chilies Industry Revenue Million Forecast, by Region 2020 & 2033
- Table 7: Global Dry Chilies Industry Revenue Million Forecast, by Production Analysis 2020 & 2033
- Table 8: Global Dry Chilies Industry Revenue Million Forecast, by Consumption Analysis 2020 & 2033
- Table 9: Global Dry Chilies Industry Revenue Million Forecast, by Import Market Analysis (Value & Volume) 2020 & 2033
- Table 10: Global Dry Chilies Industry Revenue Million Forecast, by Export Market Analysis (Value & Volume) 2020 & 2033
- Table 11: Global Dry Chilies Industry Revenue Million Forecast, by Price Trend Analysis 2020 & 2033
- Table 12: Global Dry Chilies Industry Revenue Million Forecast, by Country 2020 & 2033
- Table 13: United States Dry Chilies Industry Revenue (Million) Forecast, by Application 2020 & 2033
- Table 14: Canada Dry Chilies Industry Revenue (Million) Forecast, by Application 2020 & 2033
- Table 15: Mexico Dry Chilies Industry Revenue (Million) Forecast, by Application 2020 & 2033
- Table 16: Global Dry Chilies Industry Revenue Million Forecast, by Production Analysis 2020 & 2033
- Table 17: Global Dry Chilies Industry Revenue Million Forecast, by Consumption Analysis 2020 & 2033
- Table 18: Global Dry Chilies Industry Revenue Million Forecast, by Import Market Analysis (Value & Volume) 2020 & 2033
- Table 19: Global Dry Chilies Industry Revenue Million Forecast, by Export Market Analysis (Value & Volume) 2020 & 2033
- Table 20: Global Dry Chilies Industry Revenue Million Forecast, by Price Trend Analysis 2020 & 2033
- Table 21: Global Dry Chilies Industry Revenue Million Forecast, by Country 2020 & 2033
- Table 22: United Kingdom Dry Chilies Industry Revenue (Million) Forecast, by Application 2020 & 2033
- Table 23: Germany Dry Chilies Industry Revenue (Million) Forecast, by Application 2020 & 2033
- Table 24: France Dry Chilies Industry Revenue (Million) Forecast, by Application 2020 & 2033
- Table 25: Spain Dry Chilies Industry Revenue (Million) Forecast, by Application 2020 & 2033
- Table 26: Global Dry Chilies Industry Revenue Million Forecast, by Production Analysis 2020 & 2033
- Table 27: Global Dry Chilies Industry Revenue Million Forecast, by Consumption Analysis 2020 & 2033
- Table 28: Global Dry Chilies Industry Revenue Million Forecast, by Import Market Analysis (Value & Volume) 2020 & 2033
- Table 29: Global Dry Chilies Industry Revenue Million Forecast, by Export Market Analysis (Value & Volume) 2020 & 2033
- Table 30: Global Dry Chilies Industry Revenue Million Forecast, by Price Trend Analysis 2020 & 2033
- Table 31: Global Dry Chilies Industry Revenue Million Forecast, by Country 2020 & 2033
- Table 32: China Dry Chilies Industry Revenue (Million) Forecast, by Application 2020 & 2033
- Table 33: Australia Dry Chilies Industry Revenue (Million) Forecast, by Application 2020 & 2033
- Table 34: India Dry Chilies Industry Revenue (Million) Forecast, by Application 2020 & 2033
- Table 35: Global Dry Chilies Industry Revenue Million Forecast, by Production Analysis 2020 & 2033
- Table 36: Global Dry Chilies Industry Revenue Million Forecast, by Consumption Analysis 2020 & 2033
- Table 37: Global Dry Chilies Industry Revenue Million Forecast, by Import Market Analysis (Value & Volume) 2020 & 2033
- Table 38: Global Dry Chilies Industry Revenue Million Forecast, by Export Market Analysis (Value & Volume) 2020 & 2033
- Table 39: Global Dry Chilies Industry Revenue Million Forecast, by Price Trend Analysis 2020 & 2033
- Table 40: Global Dry Chilies Industry Revenue Million Forecast, by Country 2020 & 2033
- Table 41: Brazil Dry Chilies Industry Revenue (Million) Forecast, by Application 2020 & 2033
- Table 42: Argentina Dry Chilies Industry Revenue (Million) Forecast, by Application 2020 & 2033
- Table 43: Global Dry Chilies Industry Revenue Million Forecast, by Production Analysis 2020 & 2033
- Table 44: Global Dry Chilies Industry Revenue Million Forecast, by Consumption Analysis 2020 & 2033
- Table 45: Global Dry Chilies Industry Revenue Million Forecast, by Import Market Analysis (Value & Volume) 2020 & 2033
- Table 46: Global Dry Chilies Industry Revenue Million Forecast, by Export Market Analysis (Value & Volume) 2020 & 2033
- Table 47: Global Dry Chilies Industry Revenue Million Forecast, by Price Trend Analysis 2020 & 2033
- Table 48: Global Dry Chilies Industry Revenue Million Forecast, by Country 2020 & 2033
- Table 49: South Africa Dry Chilies Industry Revenue (Million) Forecast, by Application 2020 & 2033
- Table 50: Egypt Dry Chilies Industry Revenue (Million) Forecast, by Application 2020 & 2033
Frequently Asked Questions
1. What is the projected Compound Annual Growth Rate (CAGR) of the Dry Chilies Industry?
The projected CAGR is approximately 6.11%.
2. Which companies are prominent players in the Dry Chilies Industry?
Key companies in the market include Syngenta India, Sunrise Foods, Laxmi Organic Industries, AIC India, Rico Company.
3. What are the main segments of the Dry Chilies Industry?
The market segments include Production Analysis, Consumption Analysis, Import Market Analysis (Value & Volume), Export Market Analysis (Value & Volume), Price Trend Analysis.
4. Can you provide details about the market size?
The market size is estimated to be USD 1.61 Million as of 2022.
5. What are some drivers contributing to market growth?
Increasing Berry Consumption for Health Benefits; Increasing Adoption of High-Technology Farm Practices; Growing Usage of Berries in the Food and Beverage Industries.
6. What are the notable trends driving market growth?
High Demand for the Exotic and Spicy Oriental Dishes.
7. Are there any restraints impacting market growth?
High Production Cost Involved in Berry Production; Increasing Disease and Pest Infestations.
8. Can you provide examples of recent developments in the market?
November 2022: The Indonesian government increased domestic production of chilies rather than importing them from abroad, and to do this, it implemented strategic policies for chili development using hybrid seeds, complete and balanced fertilization, better irrigation infrastructure and farming roads, increasing the capacity of farmers' resources, and expanding the goals and market segments.
9. What pricing options are available for accessing the report?
Pricing options include single-user, multi-user, and enterprise licenses priced at USD 4750, USD 5250, and USD 8750 respectively.
10. Is the market size provided in terms of value or volume?
The market size is provided in terms of value, measured in Million.
11. Are there any specific market keywords associated with the report?
Yes, the market keyword associated with the report is "Dry Chilies Industry," which aids in identifying and referencing the specific market segment covered.
12. How do I determine which pricing option suits my needs best?
The pricing options vary based on user requirements and access needs. Individual users may opt for single-user licenses, while businesses requiring broader access may choose multi-user or enterprise licenses for cost-effective access to the report.
13. Are there any additional resources or data provided in the Dry Chilies Industry report?
While the report offers comprehensive insights, it's advisable to review the specific contents or supplementary materials provided to ascertain if additional resources or data are available.
14. How can I stay updated on further developments or reports in the Dry Chilies Industry?
To stay informed about further developments, trends, and reports in the Dry Chilies Industry, consider subscribing to industry newsletters, following relevant companies and organizations, or regularly checking reputable industry news sources and publications.
Methodology
Step 1 - Identification of Relevant Samples Size from Population Database


Step 2 - Approaches for Defining Global Market Size (Value, Volume* & Price*)

Note*: In applicable scenarios
Step 3 - Data Sources
Primary Research
- Web Analytics
- Survey Reports
- Research Institute
- Latest Research Reports
- Opinion Leaders
Secondary Research
- Annual Reports
- White Paper
- Latest Press Release
- Industry Association
- Paid Database
- Investor Presentations

Step 4 - Data Triangulation
Involves using different sources of information in order to increase the validity of a study
These sources are likely to be stakeholders in a program - participants, other researchers, program staff, other community members, and so on.
Then we put all data in single framework & apply various statistical tools to find out the dynamic on the market.
During the analysis stage, feedback from the stakeholder groups would be compared to determine areas of agreement as well as areas of divergence