

Key Insights
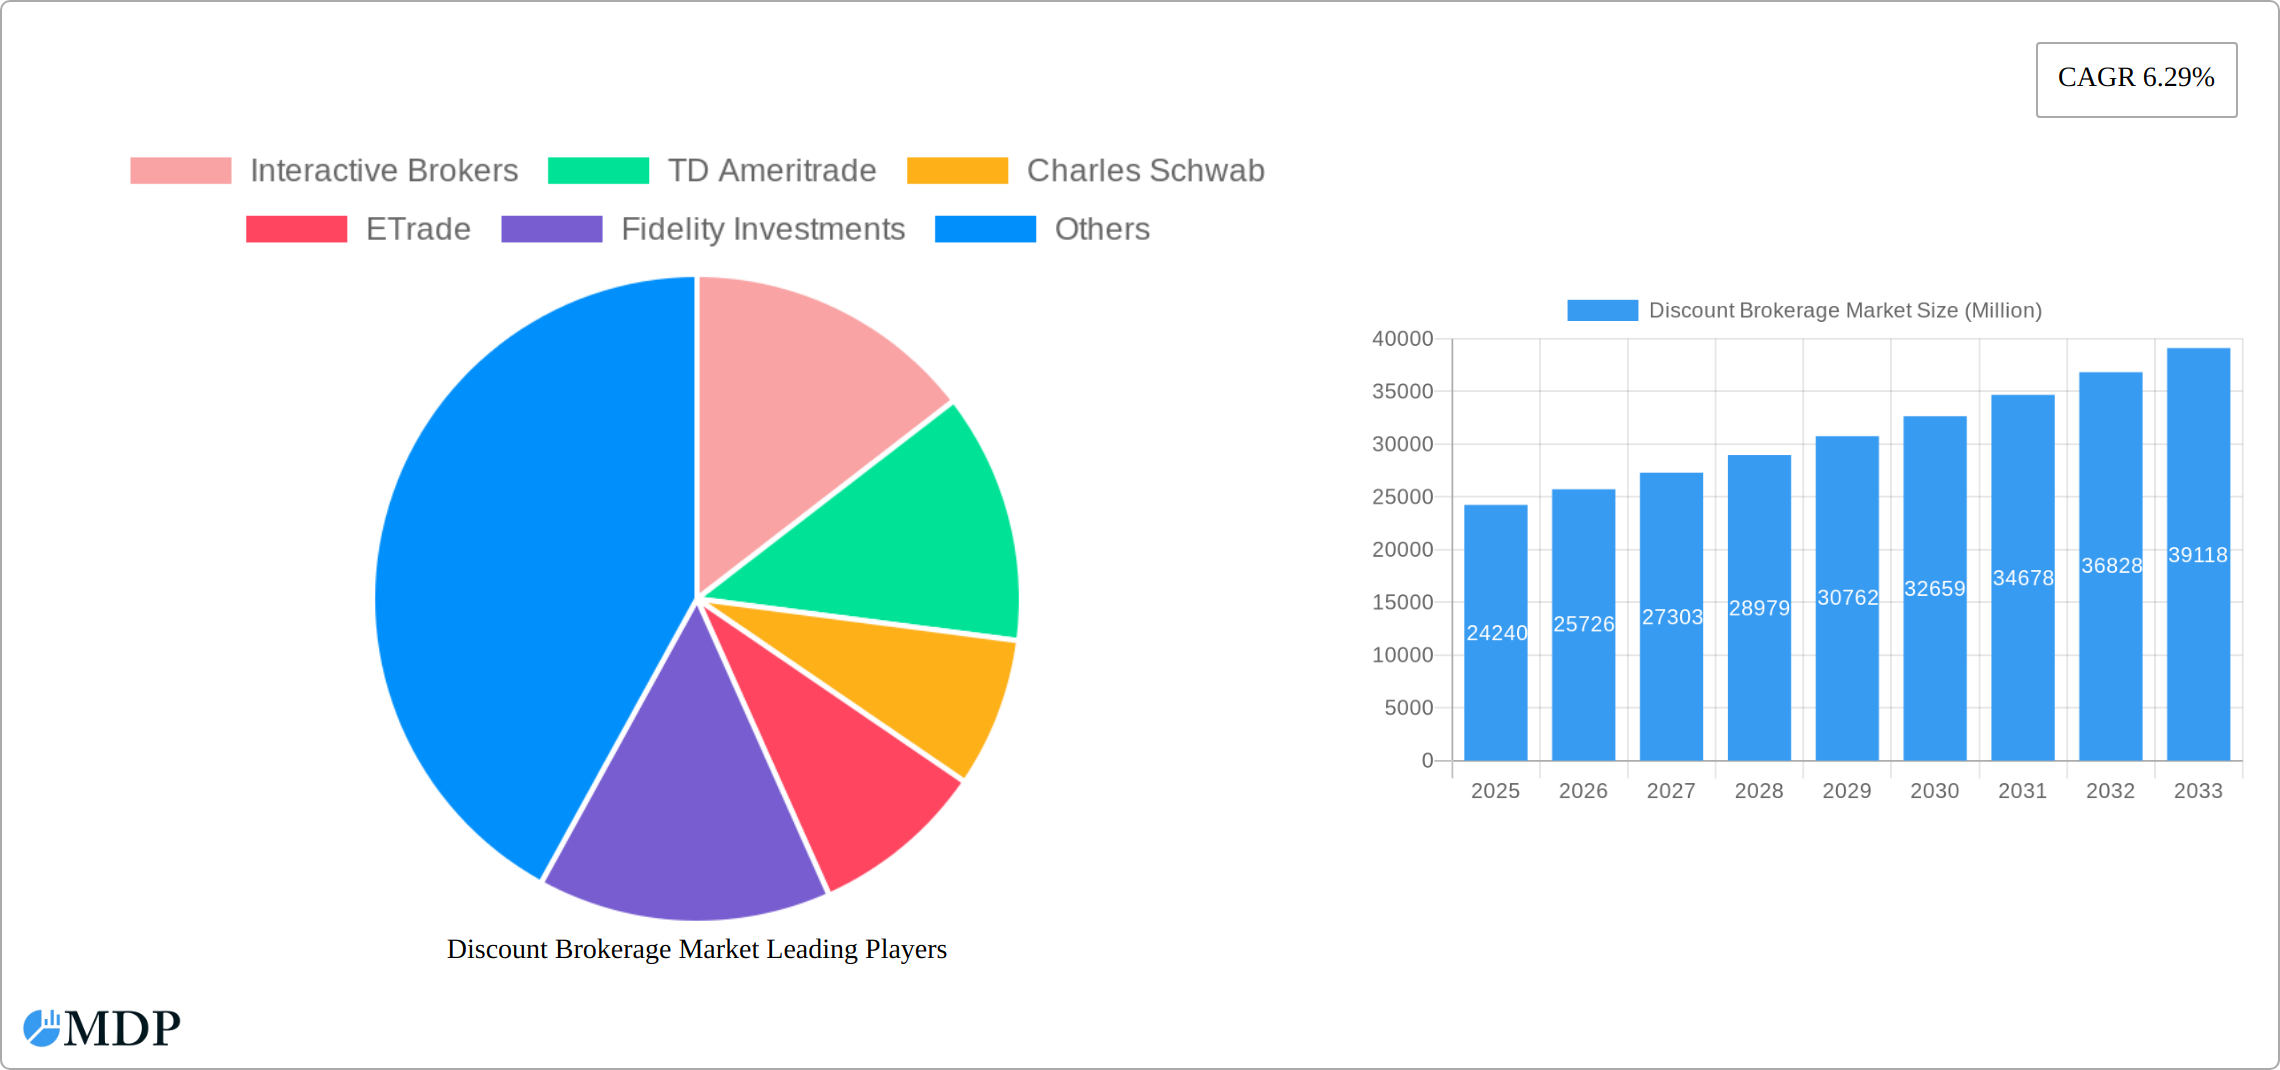
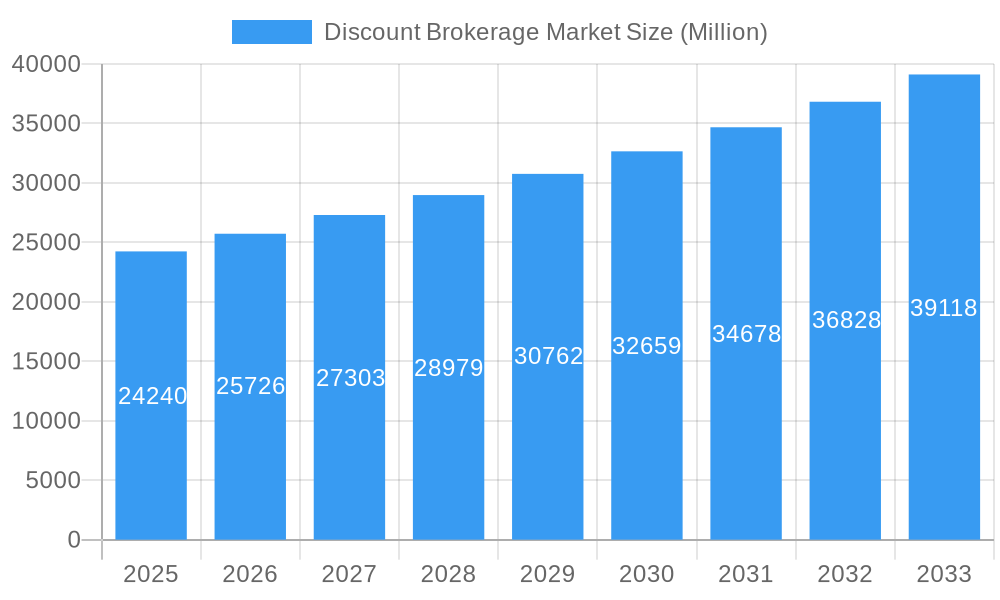
The discount brokerage market, valued at $24.24 billion in 2025, is projected to experience robust growth, driven by several key factors. Increased accessibility of online trading platforms, coupled with the rising popularity of mobile investing apps, has significantly lowered the barrier to entry for individual investors. This democratization of investing, combined with lower commission fees compared to traditional full-service brokerage firms, fuels market expansion. Furthermore, a growing millennial and Gen Z population entering the workforce and actively engaging with financial markets contributes to market expansion. The market's growth is also spurred by the introduction of innovative investment products and services, including fractional share trading and robo-advisors, catering to diverse investor needs and risk profiles. Competition among established players like Interactive Brokers, TD Ameritrade, Charles Schwab, and newer entrants like Robinhood, is fierce, leading to continuous improvements in platform features and customer experience. This competitive landscape ensures that the market remains dynamic and accessible for a wide range of investors.
Discount Brokerage Market Market Size (In Billion)
However, regulatory changes and potential economic downturns represent significant restraints. Increased regulatory scrutiny aimed at protecting investors could lead to increased compliance costs for brokerage firms, potentially impacting profitability and hindering market growth. Economic uncertainty, characterized by market volatility or recessionary periods, may cause investors to reduce trading activity, affecting overall market revenue. The long-term outlook for the discount brokerage market remains positive, predicated on continued technological innovation, expanding investor base, and adapting to evolving regulatory landscapes. The market is expected to maintain a healthy growth trajectory, leveraging technological advancements and broadening its reach to a wider demographic of investors. Strategic partnerships and mergers and acquisitions within the industry are likely to continue shaping the competitive dynamics and further influencing the growth trajectory.
Discount Brokerage Market Company Market Share
Discount Brokerage Market: A Comprehensive Report (2019-2033)
This in-depth report provides a comprehensive analysis of the Discount Brokerage Market, covering market dynamics, industry trends, leading players, and future growth prospects. The study period spans from 2019 to 2033, with 2025 serving as the base and estimated year. The report leverages extensive data analysis to provide actionable insights for industry stakeholders, including established players and new entrants. The market is valued at xx Million in 2025 and is projected to reach xx Million by 2033, exhibiting a CAGR of xx%.
Discount Brokerage Market Market Dynamics & Concentration
The discount brokerage market is characterized by intense competition and significant consolidation. Market concentration is moderate, with a few dominant players commanding substantial market share, while numerous smaller firms compete for a share of the remaining market. In 2024, the top five players—Interactive Brokers, TD Ameritrade, Charles Schwab, E*TRADE, and Fidelity Investments—held an estimated xx% of the global market share. However, the market is witnessing increasing participation from fintech startups and international players.
- Innovation Drivers: Technological advancements, particularly in mobile trading platforms and algorithmic trading, are significant drivers of market innovation. The rising adoption of robo-advisors and AI-powered investment tools is reshaping the landscape.
- Regulatory Frameworks: Stringent regulatory compliance requirements, varying across jurisdictions, significantly impact market dynamics. Changes in regulations often lead to mergers and acquisitions (M&A) activity as companies adapt to new compliance costs.
- Product Substitutes: The market faces competitive pressures from other investment platforms, including direct-to-consumer offerings by traditional banks and wealth management firms.
- End-User Trends: A growing preference for mobile and online trading platforms is driving market growth. Demand for low-cost investment options and personalized financial advice is significantly impacting the competitive landscape.
- M&A Activities: The discount brokerage market has witnessed a notable increase in M&A activity in recent years (xx deals in the past five years), mainly driven by the need for expansion, technological integration, and regulatory compliance.
Discount Brokerage Market Industry Trends & Analysis
The Discount Brokerage Market is experiencing robust growth, driven primarily by increased retail investor participation, technological advancements, and a shift towards digital platforms. The market’s growth trajectory is also influenced by factors such as evolving investor demographics, increasing financial literacy, and the growing adoption of automated trading tools. The market exhibits a strong positive correlation with overall economic growth; periods of economic expansion tend to result in increased trading activity and higher market penetration. The CAGR for the period 2025-2033 is estimated to be xx%. Market penetration, currently at xx%, is projected to reach xx% by 2033. Technological disruptions, including blockchain technology and decentralized finance (DeFi) applications, present both opportunities and challenges for market players. Consumer preferences are increasingly shifting towards personalized investment experiences, requiring brokers to enhance their offerings with AI-driven tools and advisory services.
Leading Markets & Segments in Discount Brokerage Market
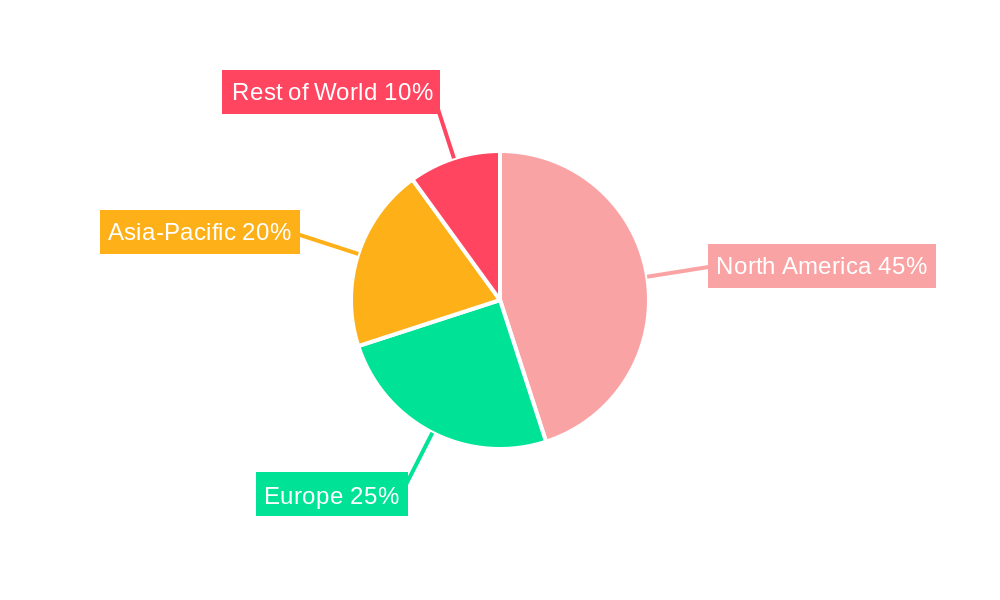
The global discount brokerage market is a dynamic and evolving landscape, with North America currently holding a dominant position. This leadership is attributed to a confluence of factors, including a well-established financial infrastructure, high levels of financial literacy among its populace, and a robust, investor-friendly regulatory environment coupled with advanced technological adoption.
- Key Drivers in North America:
- A strong and supportive regulatory framework that actively encourages broader investor participation.
- Extensive internet and mobile penetration, facilitating easy access to trading platforms for a vast user base.
- A deeply entrenched and sophisticated financial ecosystem that supports efficient market operations.
- A population with a generally high degree of financial literacy, leading to greater engagement in investment activities.
- Dominance Analysis: The United States commands the largest share of the global discount brokerage market, with Canada following closely behind. This significant North American presence is a direct result of the concentration of established industry players and a substantial number of active retail investors. While North America leads, the Asia-Pacific region is rapidly emerging as the fastest-growing market, propelled by soaring smartphone adoption rates and a burgeoning middle class with increasing disposable income and investment aspirations. Europe's market, while experiencing steady growth, progresses at a more measured pace compared to the accelerated expansion seen in Asia-Pacific.
Discount Brokerage Market Product Developments
Recent product innovations focus on enhancing user experience through intuitive mobile applications, personalized investment advice via robo-advisors, and the integration of advanced charting and analytical tools. The competitive advantage lies in offering a seamless, user-friendly platform combined with competitive pricing and a wide range of investment products. The adoption of AI and machine learning is transforming the way brokers analyze market data, personalize investment strategies, and manage risk.
Key Drivers of Discount Brokerage Market Growth
Several factors are fueling the growth of the discount brokerage market:
- Technological Advancements: The proliferation of mobile trading apps and AI-powered investment tools has lowered barriers to entry and increased accessibility.
- Economic Growth: Economic prosperity drives increased investment activity, fueling demand for brokerage services.
- Regulatory Changes: Favourable regulatory environments, particularly those promoting Fintech innovation, stimulate market expansion.
Challenges in the Discount Brokerage Market Market
The discount brokerage market faces several challenges:
- Regulatory Hurdles: Compliance costs associated with stringent regulations can significantly impact profitability.
- Competitive Pressures: Intense competition among established players and new entrants puts downward pressure on pricing and profit margins.
- Cybersecurity Risks: The increasing reliance on digital platforms raises concerns about data breaches and cybersecurity threats.
Emerging Opportunities in Discount Brokerage Market
The discount brokerage sector is ripe with burgeoning opportunities for innovation and expansion:
- Technological Advancements: The integration of disruptive technologies such as blockchain offers pathways to enhanced security, transparency, and efficiency in trading. The rise of Decentralized Finance (DeFi) platforms also presents novel avenues for product development and the creation of innovative investment solutions that cater to evolving investor demands.
- Strategic Alliances: Collaborative ventures between traditional brokerage firms and agile fintech companies can unlock synergistic benefits. These partnerships can lead to the co-creation of enhanced customer experiences, the development of sophisticated digital tools, and the expansion of market reach into previously underserved demographics.
- Global Market Expansion: Significant untapped potential exists within emerging economies. As financial literacy grows and disposable incomes rise in these regions, there is a substantial opportunity for discount brokers to establish a presence and capture a new wave of retail investors eager to participate in financial markets.
Leading Players in the Discount Brokerage Market Sector
The discount brokerage market is populated by a diverse range of firms, from established financial institutions to agile, digitally-native platforms. Key players include:
- Interactive Brokers
- TD Ameritrade (now part of Charles Schwab)
- Charles Schwab
- E*TRADE (now part of Morgan Stanley)
- Fidelity Investments
- Robinhood
- Vanguard
- Ally Invest
- Firstrade
- DEGIRO (now part of flatexDEGIRO)
Key Milestones in Discount Brokerage Market Industry
- September 2023: HDFC Securities launched its discount brokerage platform, Sky, offering a wide range of trading and investment options. This significantly enhances competition within the Indian market and offers a broader choice for investors.
- September 2023: Ujjivan SFB partnered with SMC Global Securities, expanding online trading access for its clientele. This partnership demonstrates the growing trend of banks collaborating with brokerages to provide integrated financial services.
Strategic Outlook for Discount Brokerage Market Market
The future of the discount brokerage market is bright, with continued growth expected driven by technological advancements, increasing financial inclusion, and a growing global investor base. Strategic opportunities lie in leveraging technological innovations, forging strategic partnerships, and expanding into emerging markets. Companies that successfully adapt to changing consumer preferences, enhance their technology platforms, and maintain regulatory compliance will be best positioned for long-term success.
Discount Brokerage Market Segmentation
-
1. Mode
- 1.1. Online Discount Brokerage Service
- 1.2. Offline Discount Brokerage Service
-
2. Application
- 2.1. Individual
- 2.2. Enterprise
- 2.3. Government Agencies
-
3. Services
- 3.1. Order Execution and Advisory
- 3.2. Discretionary
- 3.3. Online Trading Platforms
- 3.4. Education and Investor Resources
-
4. Commission
- 4.1. Commission-free Brokers
- 4.2. Fixed Commission Brokers
Discount Brokerage Market Segmentation By Geography
-
1. North America
- 1.1. United States
- 1.2. Canada
- 1.3. Mexico
- 1.4. Rest of North America
-
2. Europe
- 2.1. Germany
- 2.2. United Kingdom
- 2.3. France
- 2.4. Russia
- 2.5. Spain
- 2.6. Rest of Europe
-
3. Asia Pacific
- 3.1. India
- 3.2. China
- 3.3. Japan
- 3.4. Rest of Asia Pacific
-
4. South America
- 4.1. Brazil
- 4.2. Argentina
- 4.3. Rest of South America
-
5. Middle East
- 5.1. United Arab Emirates
- 5.2. Saudi Arabia
- 5.3. Rest of Middle East
Discount Brokerage Market Regional Market Share
Geographic Coverage of Discount Brokerage Market
Discount Brokerage Market REPORT HIGHLIGHTS
| Aspects | Details |
|---|---|
| Study Period | 2020-2034 |
| Base Year | 2025 |
| Estimated Year | 2026 |
| Forecast Period | 2026-2034 |
| Historical Period | 2020-2025 |
| Growth Rate | CAGR of 6.29% from 2020-2034 |
| Segmentation |
|
Table of Contents
- 1. Introduction
- 1.1. Research Scope
- 1.2. Market Segmentation
- 1.3. Research Objective
- 1.4. Definitions and Assumptions
- 2. Executive Summary
- 2.1. Market Snapshot
- 3. Market Dynamics
- 3.1. Market Drivers
- 3.2. Market Restrains
- 3.3. Market Trends
- 3.4. Market Opportunities
- 4. Market Factor Analysis
- 4.1. Porters Five Forces
- 4.1.1. Bargaining Power of Suppliers
- 4.1.2. Bargaining Power of Buyers
- 4.1.3. Threat of New Entrants
- 4.1.4. Threat of Substitutes
- 4.1.5. Competitive Rivalry
- 4.2. PESTEL analysis
- 4.3. BCG Analysis
- 4.3.1. Stars (High Growth, High Market Share)
- 4.3.2. Cash Cows (Low Growth, High Market Share)
- 4.3.3. Question Mark (High Growth, Low Market Share)
- 4.3.4. Dogs (Low Growth, Low Market Share)
- 4.4. Ansoff Matrix Analysis
- 4.5. Supply Chain Analysis
- 4.6. Regulatory Landscape
- 4.7. Current Market Potential and Opportunity Assessment (TAM–SAM–SOM Framework)
- 4.8. MDP Analyst Note
- 4.1. Porters Five Forces
- 5. Market Analysis, Insights and Forecast 2021-2033
- 5.1. Market Analysis, Insights and Forecast - by Mode
- 5.1.1. Online Discount Brokerage Service
- 5.1.2. Offline Discount Brokerage Service
- 5.2. Market Analysis, Insights and Forecast - by Application
- 5.2.1. Individual
- 5.2.2. Enterprise
- 5.2.3. Government Agencies
- 5.3. Market Analysis, Insights and Forecast - by Services
- 5.3.1. Order Execution and Advisory
- 5.3.2. Discretionary
- 5.3.3. Online Trading Platforms
- 5.3.4. Education and Investor Resources
- 5.4. Market Analysis, Insights and Forecast - by Commission
- 5.4.1. Commission-free Brokers
- 5.4.2. Fixed Commission Brokers
- 5.5. Market Analysis, Insights and Forecast - by Region
- 5.5.1. North America
- 5.5.2. Europe
- 5.5.3. Asia Pacific
- 5.5.4. South America
- 5.5.5. Middle East
- 5.1. Market Analysis, Insights and Forecast - by Mode
- 6. Global Discount Brokerage Market Analysis, Insights and Forecast, 2021-2033
- 6.1. Market Analysis, Insights and Forecast - by Mode
- 6.1.1. Online Discount Brokerage Service
- 6.1.2. Offline Discount Brokerage Service
- 6.2. Market Analysis, Insights and Forecast - by Application
- 6.2.1. Individual
- 6.2.2. Enterprise
- 6.2.3. Government Agencies
- 6.3. Market Analysis, Insights and Forecast - by Services
- 6.3.1. Order Execution and Advisory
- 6.3.2. Discretionary
- 6.3.3. Online Trading Platforms
- 6.3.4. Education and Investor Resources
- 6.4. Market Analysis, Insights and Forecast - by Commission
- 6.4.1. Commission-free Brokers
- 6.4.2. Fixed Commission Brokers
- 6.1. Market Analysis, Insights and Forecast - by Mode
- 7. North America Discount Brokerage Market Analysis, Insights and Forecast, 2020-2032
- 7.1. Market Analysis, Insights and Forecast - by Mode
- 7.1.1. Online Discount Brokerage Service
- 7.1.2. Offline Discount Brokerage Service
- 7.2. Market Analysis, Insights and Forecast - by Application
- 7.2.1. Individual
- 7.2.2. Enterprise
- 7.2.3. Government Agencies
- 7.3. Market Analysis, Insights and Forecast - by Services
- 7.3.1. Order Execution and Advisory
- 7.3.2. Discretionary
- 7.3.3. Online Trading Platforms
- 7.3.4. Education and Investor Resources
- 7.4. Market Analysis, Insights and Forecast - by Commission
- 7.4.1. Commission-free Brokers
- 7.4.2. Fixed Commission Brokers
- 7.1. Market Analysis, Insights and Forecast - by Mode
- 8. Europe Discount Brokerage Market Analysis, Insights and Forecast, 2020-2032
- 8.1. Market Analysis, Insights and Forecast - by Mode
- 8.1.1. Online Discount Brokerage Service
- 8.1.2. Offline Discount Brokerage Service
- 8.2. Market Analysis, Insights and Forecast - by Application
- 8.2.1. Individual
- 8.2.2. Enterprise
- 8.2.3. Government Agencies
- 8.3. Market Analysis, Insights and Forecast - by Services
- 8.3.1. Order Execution and Advisory
- 8.3.2. Discretionary
- 8.3.3. Online Trading Platforms
- 8.3.4. Education and Investor Resources
- 8.4. Market Analysis, Insights and Forecast - by Commission
- 8.4.1. Commission-free Brokers
- 8.4.2. Fixed Commission Brokers
- 8.1. Market Analysis, Insights and Forecast - by Mode
- 9. Asia Pacific Discount Brokerage Market Analysis, Insights and Forecast, 2020-2032
- 9.1. Market Analysis, Insights and Forecast - by Mode
- 9.1.1. Online Discount Brokerage Service
- 9.1.2. Offline Discount Brokerage Service
- 9.2. Market Analysis, Insights and Forecast - by Application
- 9.2.1. Individual
- 9.2.2. Enterprise
- 9.2.3. Government Agencies
- 9.3. Market Analysis, Insights and Forecast - by Services
- 9.3.1. Order Execution and Advisory
- 9.3.2. Discretionary
- 9.3.3. Online Trading Platforms
- 9.3.4. Education and Investor Resources
- 9.4. Market Analysis, Insights and Forecast - by Commission
- 9.4.1. Commission-free Brokers
- 9.4.2. Fixed Commission Brokers
- 9.1. Market Analysis, Insights and Forecast - by Mode
- 10. South America Discount Brokerage Market Analysis, Insights and Forecast, 2020-2032
- 10.1. Market Analysis, Insights and Forecast - by Mode
- 10.1.1. Online Discount Brokerage Service
- 10.1.2. Offline Discount Brokerage Service
- 10.2. Market Analysis, Insights and Forecast - by Application
- 10.2.1. Individual
- 10.2.2. Enterprise
- 10.2.3. Government Agencies
- 10.3. Market Analysis, Insights and Forecast - by Services
- 10.3.1. Order Execution and Advisory
- 10.3.2. Discretionary
- 10.3.3. Online Trading Platforms
- 10.3.4. Education and Investor Resources
- 10.4. Market Analysis, Insights and Forecast - by Commission
- 10.4.1. Commission-free Brokers
- 10.4.2. Fixed Commission Brokers
- 10.1. Market Analysis, Insights and Forecast - by Mode
- 11. Middle East Discount Brokerage Market Analysis, Insights and Forecast, 2020-2032
- 11.1. Market Analysis, Insights and Forecast - by Mode
- 11.1.1. Online Discount Brokerage Service
- 11.1.2. Offline Discount Brokerage Service
- 11.2. Market Analysis, Insights and Forecast - by Application
- 11.2.1. Individual
- 11.2.2. Enterprise
- 11.2.3. Government Agencies
- 11.3. Market Analysis, Insights and Forecast - by Services
- 11.3.1. Order Execution and Advisory
- 11.3.2. Discretionary
- 11.3.3. Online Trading Platforms
- 11.3.4. Education and Investor Resources
- 11.4. Market Analysis, Insights and Forecast - by Commission
- 11.4.1. Commission-free Brokers
- 11.4.2. Fixed Commission Brokers
- 11.1. Market Analysis, Insights and Forecast - by Mode
- 12. Competitive Analysis
- 12.1. Company Profiles
- 12.1.1 Interactive Brokers
- 12.1.1.1. Company Overview
- 12.1.1.2. Products
- 12.1.1.3. Company Financials
- 12.1.1.4. SWOT Analysis
- 12.1.2 TD Ameritrade
- 12.1.2.1. Company Overview
- 12.1.2.2. Products
- 12.1.2.3. Company Financials
- 12.1.2.4. SWOT Analysis
- 12.1.3 Charles Schwab
- 12.1.3.1. Company Overview
- 12.1.3.2. Products
- 12.1.3.3. Company Financials
- 12.1.3.4. SWOT Analysis
- 12.1.4 ETrade
- 12.1.4.1. Company Overview
- 12.1.4.2. Products
- 12.1.4.3. Company Financials
- 12.1.4.4. SWOT Analysis
- 12.1.5 Fidelity Investments
- 12.1.5.1. Company Overview
- 12.1.5.2. Products
- 12.1.5.3. Company Financials
- 12.1.5.4. SWOT Analysis
- 12.1.6 Robinhood
- 12.1.6.1. Company Overview
- 12.1.6.2. Products
- 12.1.6.3. Company Financials
- 12.1.6.4. SWOT Analysis
- 12.1.7 Vanguard
- 12.1.7.1. Company Overview
- 12.1.7.2. Products
- 12.1.7.3. Company Financials
- 12.1.7.4. SWOT Analysis
- 12.1.8 Ally Invest
- 12.1.8.1. Company Overview
- 12.1.8.2. Products
- 12.1.8.3. Company Financials
- 12.1.8.4. SWOT Analysis
- 12.1.9 Firstrade
- 12.1.9.1. Company Overview
- 12.1.9.2. Products
- 12.1.9.3. Company Financials
- 12.1.9.4. SWOT Analysis
- 12.1.10 DEGIRO**List Not Exhaustive
- 12.1.10.1. Company Overview
- 12.1.10.2. Products
- 12.1.10.3. Company Financials
- 12.1.10.4. SWOT Analysis
- 12.1.1 Interactive Brokers
- 12.2. Market Entropy
- 12.2.1 Company's Key Areas Served
- 12.2.2 Recent Developments
- 12.3. Company Market Share Analysis 2025
- 12.3.1 Top 5 Companies Market Share Analysis
- 12.3.2 Top 3 Companies Market Share Analysis
- 12.4. List of Potential Customers
- 13. Research Methodology
List of Figures
- Figure 1: Global Discount Brokerage Market Revenue Breakdown (Million, %) by Region 2025 & 2033
- Figure 2: Global Discount Brokerage Market Volume Breakdown (Billion, %) by Region 2025 & 2033
- Figure 3: North America Discount Brokerage Market Revenue (Million), by Mode 2025 & 2033
- Figure 4: North America Discount Brokerage Market Volume (Billion), by Mode 2025 & 2033
- Figure 5: North America Discount Brokerage Market Revenue Share (%), by Mode 2025 & 2033
- Figure 6: North America Discount Brokerage Market Volume Share (%), by Mode 2025 & 2033
- Figure 7: North America Discount Brokerage Market Revenue (Million), by Application 2025 & 2033
- Figure 8: North America Discount Brokerage Market Volume (Billion), by Application 2025 & 2033
- Figure 9: North America Discount Brokerage Market Revenue Share (%), by Application 2025 & 2033
- Figure 10: North America Discount Brokerage Market Volume Share (%), by Application 2025 & 2033
- Figure 11: North America Discount Brokerage Market Revenue (Million), by Services 2025 & 2033
- Figure 12: North America Discount Brokerage Market Volume (Billion), by Services 2025 & 2033
- Figure 13: North America Discount Brokerage Market Revenue Share (%), by Services 2025 & 2033
- Figure 14: North America Discount Brokerage Market Volume Share (%), by Services 2025 & 2033
- Figure 15: North America Discount Brokerage Market Revenue (Million), by Commission 2025 & 2033
- Figure 16: North America Discount Brokerage Market Volume (Billion), by Commission 2025 & 2033
- Figure 17: North America Discount Brokerage Market Revenue Share (%), by Commission 2025 & 2033
- Figure 18: North America Discount Brokerage Market Volume Share (%), by Commission 2025 & 2033
- Figure 19: North America Discount Brokerage Market Revenue (Million), by Country 2025 & 2033
- Figure 20: North America Discount Brokerage Market Volume (Billion), by Country 2025 & 2033
- Figure 21: North America Discount Brokerage Market Revenue Share (%), by Country 2025 & 2033
- Figure 22: North America Discount Brokerage Market Volume Share (%), by Country 2025 & 2033
- Figure 23: Europe Discount Brokerage Market Revenue (Million), by Mode 2025 & 2033
- Figure 24: Europe Discount Brokerage Market Volume (Billion), by Mode 2025 & 2033
- Figure 25: Europe Discount Brokerage Market Revenue Share (%), by Mode 2025 & 2033
- Figure 26: Europe Discount Brokerage Market Volume Share (%), by Mode 2025 & 2033
- Figure 27: Europe Discount Brokerage Market Revenue (Million), by Application 2025 & 2033
- Figure 28: Europe Discount Brokerage Market Volume (Billion), by Application 2025 & 2033
- Figure 29: Europe Discount Brokerage Market Revenue Share (%), by Application 2025 & 2033
- Figure 30: Europe Discount Brokerage Market Volume Share (%), by Application 2025 & 2033
- Figure 31: Europe Discount Brokerage Market Revenue (Million), by Services 2025 & 2033
- Figure 32: Europe Discount Brokerage Market Volume (Billion), by Services 2025 & 2033
- Figure 33: Europe Discount Brokerage Market Revenue Share (%), by Services 2025 & 2033
- Figure 34: Europe Discount Brokerage Market Volume Share (%), by Services 2025 & 2033
- Figure 35: Europe Discount Brokerage Market Revenue (Million), by Commission 2025 & 2033
- Figure 36: Europe Discount Brokerage Market Volume (Billion), by Commission 2025 & 2033
- Figure 37: Europe Discount Brokerage Market Revenue Share (%), by Commission 2025 & 2033
- Figure 38: Europe Discount Brokerage Market Volume Share (%), by Commission 2025 & 2033
- Figure 39: Europe Discount Brokerage Market Revenue (Million), by Country 2025 & 2033
- Figure 40: Europe Discount Brokerage Market Volume (Billion), by Country 2025 & 2033
- Figure 41: Europe Discount Brokerage Market Revenue Share (%), by Country 2025 & 2033
- Figure 42: Europe Discount Brokerage Market Volume Share (%), by Country 2025 & 2033
- Figure 43: Asia Pacific Discount Brokerage Market Revenue (Million), by Mode 2025 & 2033
- Figure 44: Asia Pacific Discount Brokerage Market Volume (Billion), by Mode 2025 & 2033
- Figure 45: Asia Pacific Discount Brokerage Market Revenue Share (%), by Mode 2025 & 2033
- Figure 46: Asia Pacific Discount Brokerage Market Volume Share (%), by Mode 2025 & 2033
- Figure 47: Asia Pacific Discount Brokerage Market Revenue (Million), by Application 2025 & 2033
- Figure 48: Asia Pacific Discount Brokerage Market Volume (Billion), by Application 2025 & 2033
- Figure 49: Asia Pacific Discount Brokerage Market Revenue Share (%), by Application 2025 & 2033
- Figure 50: Asia Pacific Discount Brokerage Market Volume Share (%), by Application 2025 & 2033
- Figure 51: Asia Pacific Discount Brokerage Market Revenue (Million), by Services 2025 & 2033
- Figure 52: Asia Pacific Discount Brokerage Market Volume (Billion), by Services 2025 & 2033
- Figure 53: Asia Pacific Discount Brokerage Market Revenue Share (%), by Services 2025 & 2033
- Figure 54: Asia Pacific Discount Brokerage Market Volume Share (%), by Services 2025 & 2033
- Figure 55: Asia Pacific Discount Brokerage Market Revenue (Million), by Commission 2025 & 2033
- Figure 56: Asia Pacific Discount Brokerage Market Volume (Billion), by Commission 2025 & 2033
- Figure 57: Asia Pacific Discount Brokerage Market Revenue Share (%), by Commission 2025 & 2033
- Figure 58: Asia Pacific Discount Brokerage Market Volume Share (%), by Commission 2025 & 2033
- Figure 59: Asia Pacific Discount Brokerage Market Revenue (Million), by Country 2025 & 2033
- Figure 60: Asia Pacific Discount Brokerage Market Volume (Billion), by Country 2025 & 2033
- Figure 61: Asia Pacific Discount Brokerage Market Revenue Share (%), by Country 2025 & 2033
- Figure 62: Asia Pacific Discount Brokerage Market Volume Share (%), by Country 2025 & 2033
- Figure 63: South America Discount Brokerage Market Revenue (Million), by Mode 2025 & 2033
- Figure 64: South America Discount Brokerage Market Volume (Billion), by Mode 2025 & 2033
- Figure 65: South America Discount Brokerage Market Revenue Share (%), by Mode 2025 & 2033
- Figure 66: South America Discount Brokerage Market Volume Share (%), by Mode 2025 & 2033
- Figure 67: South America Discount Brokerage Market Revenue (Million), by Application 2025 & 2033
- Figure 68: South America Discount Brokerage Market Volume (Billion), by Application 2025 & 2033
- Figure 69: South America Discount Brokerage Market Revenue Share (%), by Application 2025 & 2033
- Figure 70: South America Discount Brokerage Market Volume Share (%), by Application 2025 & 2033
- Figure 71: South America Discount Brokerage Market Revenue (Million), by Services 2025 & 2033
- Figure 72: South America Discount Brokerage Market Volume (Billion), by Services 2025 & 2033
- Figure 73: South America Discount Brokerage Market Revenue Share (%), by Services 2025 & 2033
- Figure 74: South America Discount Brokerage Market Volume Share (%), by Services 2025 & 2033
- Figure 75: South America Discount Brokerage Market Revenue (Million), by Commission 2025 & 2033
- Figure 76: South America Discount Brokerage Market Volume (Billion), by Commission 2025 & 2033
- Figure 77: South America Discount Brokerage Market Revenue Share (%), by Commission 2025 & 2033
- Figure 78: South America Discount Brokerage Market Volume Share (%), by Commission 2025 & 2033
- Figure 79: South America Discount Brokerage Market Revenue (Million), by Country 2025 & 2033
- Figure 80: South America Discount Brokerage Market Volume (Billion), by Country 2025 & 2033
- Figure 81: South America Discount Brokerage Market Revenue Share (%), by Country 2025 & 2033
- Figure 82: South America Discount Brokerage Market Volume Share (%), by Country 2025 & 2033
- Figure 83: Middle East Discount Brokerage Market Revenue (Million), by Mode 2025 & 2033
- Figure 84: Middle East Discount Brokerage Market Volume (Billion), by Mode 2025 & 2033
- Figure 85: Middle East Discount Brokerage Market Revenue Share (%), by Mode 2025 & 2033
- Figure 86: Middle East Discount Brokerage Market Volume Share (%), by Mode 2025 & 2033
- Figure 87: Middle East Discount Brokerage Market Revenue (Million), by Application 2025 & 2033
- Figure 88: Middle East Discount Brokerage Market Volume (Billion), by Application 2025 & 2033
- Figure 89: Middle East Discount Brokerage Market Revenue Share (%), by Application 2025 & 2033
- Figure 90: Middle East Discount Brokerage Market Volume Share (%), by Application 2025 & 2033
- Figure 91: Middle East Discount Brokerage Market Revenue (Million), by Services 2025 & 2033
- Figure 92: Middle East Discount Brokerage Market Volume (Billion), by Services 2025 & 2033
- Figure 93: Middle East Discount Brokerage Market Revenue Share (%), by Services 2025 & 2033
- Figure 94: Middle East Discount Brokerage Market Volume Share (%), by Services 2025 & 2033
- Figure 95: Middle East Discount Brokerage Market Revenue (Million), by Commission 2025 & 2033
- Figure 96: Middle East Discount Brokerage Market Volume (Billion), by Commission 2025 & 2033
- Figure 97: Middle East Discount Brokerage Market Revenue Share (%), by Commission 2025 & 2033
- Figure 98: Middle East Discount Brokerage Market Volume Share (%), by Commission 2025 & 2033
- Figure 99: Middle East Discount Brokerage Market Revenue (Million), by Country 2025 & 2033
- Figure 100: Middle East Discount Brokerage Market Volume (Billion), by Country 2025 & 2033
- Figure 101: Middle East Discount Brokerage Market Revenue Share (%), by Country 2025 & 2033
- Figure 102: Middle East Discount Brokerage Market Volume Share (%), by Country 2025 & 2033
List of Tables
- Table 1: Global Discount Brokerage Market Revenue Million Forecast, by Mode 2020 & 2033
- Table 2: Global Discount Brokerage Market Volume Billion Forecast, by Mode 2020 & 2033
- Table 3: Global Discount Brokerage Market Revenue Million Forecast, by Application 2020 & 2033
- Table 4: Global Discount Brokerage Market Volume Billion Forecast, by Application 2020 & 2033
- Table 5: Global Discount Brokerage Market Revenue Million Forecast, by Services 2020 & 2033
- Table 6: Global Discount Brokerage Market Volume Billion Forecast, by Services 2020 & 2033
- Table 7: Global Discount Brokerage Market Revenue Million Forecast, by Commission 2020 & 2033
- Table 8: Global Discount Brokerage Market Volume Billion Forecast, by Commission 2020 & 2033
- Table 9: Global Discount Brokerage Market Revenue Million Forecast, by Region 2020 & 2033
- Table 10: Global Discount Brokerage Market Volume Billion Forecast, by Region 2020 & 2033
- Table 11: Global Discount Brokerage Market Revenue Million Forecast, by Mode 2020 & 2033
- Table 12: Global Discount Brokerage Market Volume Billion Forecast, by Mode 2020 & 2033
- Table 13: Global Discount Brokerage Market Revenue Million Forecast, by Application 2020 & 2033
- Table 14: Global Discount Brokerage Market Volume Billion Forecast, by Application 2020 & 2033
- Table 15: Global Discount Brokerage Market Revenue Million Forecast, by Services 2020 & 2033
- Table 16: Global Discount Brokerage Market Volume Billion Forecast, by Services 2020 & 2033
- Table 17: Global Discount Brokerage Market Revenue Million Forecast, by Commission 2020 & 2033
- Table 18: Global Discount Brokerage Market Volume Billion Forecast, by Commission 2020 & 2033
- Table 19: Global Discount Brokerage Market Revenue Million Forecast, by Country 2020 & 2033
- Table 20: Global Discount Brokerage Market Volume Billion Forecast, by Country 2020 & 2033
- Table 21: United States Discount Brokerage Market Revenue (Million) Forecast, by Application 2020 & 2033
- Table 22: United States Discount Brokerage Market Volume (Billion) Forecast, by Application 2020 & 2033
- Table 23: Canada Discount Brokerage Market Revenue (Million) Forecast, by Application 2020 & 2033
- Table 24: Canada Discount Brokerage Market Volume (Billion) Forecast, by Application 2020 & 2033
- Table 25: Mexico Discount Brokerage Market Revenue (Million) Forecast, by Application 2020 & 2033
- Table 26: Mexico Discount Brokerage Market Volume (Billion) Forecast, by Application 2020 & 2033
- Table 27: Rest of North America Discount Brokerage Market Revenue (Million) Forecast, by Application 2020 & 2033
- Table 28: Rest of North America Discount Brokerage Market Volume (Billion) Forecast, by Application 2020 & 2033
- Table 29: Global Discount Brokerage Market Revenue Million Forecast, by Mode 2020 & 2033
- Table 30: Global Discount Brokerage Market Volume Billion Forecast, by Mode 2020 & 2033
- Table 31: Global Discount Brokerage Market Revenue Million Forecast, by Application 2020 & 2033
- Table 32: Global Discount Brokerage Market Volume Billion Forecast, by Application 2020 & 2033
- Table 33: Global Discount Brokerage Market Revenue Million Forecast, by Services 2020 & 2033
- Table 34: Global Discount Brokerage Market Volume Billion Forecast, by Services 2020 & 2033
- Table 35: Global Discount Brokerage Market Revenue Million Forecast, by Commission 2020 & 2033
- Table 36: Global Discount Brokerage Market Volume Billion Forecast, by Commission 2020 & 2033
- Table 37: Global Discount Brokerage Market Revenue Million Forecast, by Country 2020 & 2033
- Table 38: Global Discount Brokerage Market Volume Billion Forecast, by Country 2020 & 2033
- Table 39: Germany Discount Brokerage Market Revenue (Million) Forecast, by Application 2020 & 2033
- Table 40: Germany Discount Brokerage Market Volume (Billion) Forecast, by Application 2020 & 2033
- Table 41: United Kingdom Discount Brokerage Market Revenue (Million) Forecast, by Application 2020 & 2033
- Table 42: United Kingdom Discount Brokerage Market Volume (Billion) Forecast, by Application 2020 & 2033
- Table 43: France Discount Brokerage Market Revenue (Million) Forecast, by Application 2020 & 2033
- Table 44: France Discount Brokerage Market Volume (Billion) Forecast, by Application 2020 & 2033
- Table 45: Russia Discount Brokerage Market Revenue (Million) Forecast, by Application 2020 & 2033
- Table 46: Russia Discount Brokerage Market Volume (Billion) Forecast, by Application 2020 & 2033
- Table 47: Spain Discount Brokerage Market Revenue (Million) Forecast, by Application 2020 & 2033
- Table 48: Spain Discount Brokerage Market Volume (Billion) Forecast, by Application 2020 & 2033
- Table 49: Rest of Europe Discount Brokerage Market Revenue (Million) Forecast, by Application 2020 & 2033
- Table 50: Rest of Europe Discount Brokerage Market Volume (Billion) Forecast, by Application 2020 & 2033
- Table 51: Global Discount Brokerage Market Revenue Million Forecast, by Mode 2020 & 2033
- Table 52: Global Discount Brokerage Market Volume Billion Forecast, by Mode 2020 & 2033
- Table 53: Global Discount Brokerage Market Revenue Million Forecast, by Application 2020 & 2033
- Table 54: Global Discount Brokerage Market Volume Billion Forecast, by Application 2020 & 2033
- Table 55: Global Discount Brokerage Market Revenue Million Forecast, by Services 2020 & 2033
- Table 56: Global Discount Brokerage Market Volume Billion Forecast, by Services 2020 & 2033
- Table 57: Global Discount Brokerage Market Revenue Million Forecast, by Commission 2020 & 2033
- Table 58: Global Discount Brokerage Market Volume Billion Forecast, by Commission 2020 & 2033
- Table 59: Global Discount Brokerage Market Revenue Million Forecast, by Country 2020 & 2033
- Table 60: Global Discount Brokerage Market Volume Billion Forecast, by Country 2020 & 2033
- Table 61: India Discount Brokerage Market Revenue (Million) Forecast, by Application 2020 & 2033
- Table 62: India Discount Brokerage Market Volume (Billion) Forecast, by Application 2020 & 2033
- Table 63: China Discount Brokerage Market Revenue (Million) Forecast, by Application 2020 & 2033
- Table 64: China Discount Brokerage Market Volume (Billion) Forecast, by Application 2020 & 2033
- Table 65: Japan Discount Brokerage Market Revenue (Million) Forecast, by Application 2020 & 2033
- Table 66: Japan Discount Brokerage Market Volume (Billion) Forecast, by Application 2020 & 2033
- Table 67: Rest of Asia Pacific Discount Brokerage Market Revenue (Million) Forecast, by Application 2020 & 2033
- Table 68: Rest of Asia Pacific Discount Brokerage Market Volume (Billion) Forecast, by Application 2020 & 2033
- Table 69: Global Discount Brokerage Market Revenue Million Forecast, by Mode 2020 & 2033
- Table 70: Global Discount Brokerage Market Volume Billion Forecast, by Mode 2020 & 2033
- Table 71: Global Discount Brokerage Market Revenue Million Forecast, by Application 2020 & 2033
- Table 72: Global Discount Brokerage Market Volume Billion Forecast, by Application 2020 & 2033
- Table 73: Global Discount Brokerage Market Revenue Million Forecast, by Services 2020 & 2033
- Table 74: Global Discount Brokerage Market Volume Billion Forecast, by Services 2020 & 2033
- Table 75: Global Discount Brokerage Market Revenue Million Forecast, by Commission 2020 & 2033
- Table 76: Global Discount Brokerage Market Volume Billion Forecast, by Commission 2020 & 2033
- Table 77: Global Discount Brokerage Market Revenue Million Forecast, by Country 2020 & 2033
- Table 78: Global Discount Brokerage Market Volume Billion Forecast, by Country 2020 & 2033
- Table 79: Brazil Discount Brokerage Market Revenue (Million) Forecast, by Application 2020 & 2033
- Table 80: Brazil Discount Brokerage Market Volume (Billion) Forecast, by Application 2020 & 2033
- Table 81: Argentina Discount Brokerage Market Revenue (Million) Forecast, by Application 2020 & 2033
- Table 82: Argentina Discount Brokerage Market Volume (Billion) Forecast, by Application 2020 & 2033
- Table 83: Rest of South America Discount Brokerage Market Revenue (Million) Forecast, by Application 2020 & 2033
- Table 84: Rest of South America Discount Brokerage Market Volume (Billion) Forecast, by Application 2020 & 2033
- Table 85: Global Discount Brokerage Market Revenue Million Forecast, by Mode 2020 & 2033
- Table 86: Global Discount Brokerage Market Volume Billion Forecast, by Mode 2020 & 2033
- Table 87: Global Discount Brokerage Market Revenue Million Forecast, by Application 2020 & 2033
- Table 88: Global Discount Brokerage Market Volume Billion Forecast, by Application 2020 & 2033
- Table 89: Global Discount Brokerage Market Revenue Million Forecast, by Services 2020 & 2033
- Table 90: Global Discount Brokerage Market Volume Billion Forecast, by Services 2020 & 2033
- Table 91: Global Discount Brokerage Market Revenue Million Forecast, by Commission 2020 & 2033
- Table 92: Global Discount Brokerage Market Volume Billion Forecast, by Commission 2020 & 2033
- Table 93: Global Discount Brokerage Market Revenue Million Forecast, by Country 2020 & 2033
- Table 94: Global Discount Brokerage Market Volume Billion Forecast, by Country 2020 & 2033
- Table 95: United Arab Emirates Discount Brokerage Market Revenue (Million) Forecast, by Application 2020 & 2033
- Table 96: United Arab Emirates Discount Brokerage Market Volume (Billion) Forecast, by Application 2020 & 2033
- Table 97: Saudi Arabia Discount Brokerage Market Revenue (Million) Forecast, by Application 2020 & 2033
- Table 98: Saudi Arabia Discount Brokerage Market Volume (Billion) Forecast, by Application 2020 & 2033
- Table 99: Rest of Middle East Discount Brokerage Market Revenue (Million) Forecast, by Application 2020 & 2033
- Table 100: Rest of Middle East Discount Brokerage Market Volume (Billion) Forecast, by Application 2020 & 2033
Frequently Asked Questions
1. What is the projected Compound Annual Growth Rate (CAGR) of the Discount Brokerage Market?
The projected CAGR is approximately 6.29%.
2. Which companies are prominent players in the Discount Brokerage Market?
Key companies in the market include Interactive Brokers, TD Ameritrade, Charles Schwab, ETrade, Fidelity Investments, Robinhood, Vanguard, Ally Invest, Firstrade, DEGIRO**List Not Exhaustive.
3. What are the main segments of the Discount Brokerage Market?
The market segments include Mode, Application, Services , Commission.
4. Can you provide details about the market size?
The market size is estimated to be USD 24.24 Million as of 2022.
5. What are some drivers contributing to market growth?
Low-cost Trading Fee is Driving the Market; Increasing Popularity of Self-directed Investing.
6. What are the notable trends driving market growth?
Increase in Enterprise Market is Fuelling the Market.
7. Are there any restraints impacting market growth?
Low-cost Trading Fee is Driving the Market; Increasing Popularity of Self-directed Investing.
8. Can you provide examples of recent developments in the market?
September 2023: HDFC Securities launched the discount brokerage platform Sky. Through a single fintech platform, the app provides users with a wide range of trading and investment possibilities, including global equities, IPOs, Indian stocks, ETFs, mutual funds, futures and options, currencies, and commodities.
9. What pricing options are available for accessing the report?
Pricing options include single-user, multi-user, and enterprise licenses priced at USD 4750, USD 5250, and USD 8750 respectively.
10. Is the market size provided in terms of value or volume?
The market size is provided in terms of value, measured in Million and volume, measured in Billion.
11. Are there any specific market keywords associated with the report?
Yes, the market keyword associated with the report is "Discount Brokerage Market," which aids in identifying and referencing the specific market segment covered.
12. How do I determine which pricing option suits my needs best?
The pricing options vary based on user requirements and access needs. Individual users may opt for single-user licenses, while businesses requiring broader access may choose multi-user or enterprise licenses for cost-effective access to the report.
13. Are there any additional resources or data provided in the Discount Brokerage Market report?
While the report offers comprehensive insights, it's advisable to review the specific contents or supplementary materials provided to ascertain if additional resources or data are available.
14. How can I stay updated on further developments or reports in the Discount Brokerage Market?
To stay informed about further developments, trends, and reports in the Discount Brokerage Market, consider subscribing to industry newsletters, following relevant companies and organizations, or regularly checking reputable industry news sources and publications.
Methodology
Step 1 - Identification of Relevant Samples Size from Population Database


Step 2 - Approaches for Defining Global Market Size (Value, Volume* & Price*)

Note*: In applicable scenarios
Step 3 - Data Sources
Primary Research
- Web Analytics
- Survey Reports
- Research Institute
- Latest Research Reports
- Opinion Leaders
Secondary Research
- Annual Reports
- White Paper
- Latest Press Release
- Industry Association
- Paid Database
- Investor Presentations

Step 4 - Data Triangulation
Involves using different sources of information in order to increase the validity of a study
These sources are likely to be stakeholders in a program - participants, other researchers, program staff, other community members, and so on.
Then we put all data in single framework & apply various statistical tools to find out the dynamic on the market.
During the analysis stage, feedback from the stakeholder groups would be compared to determine areas of agreement as well as areas of divergence