

Key Insights
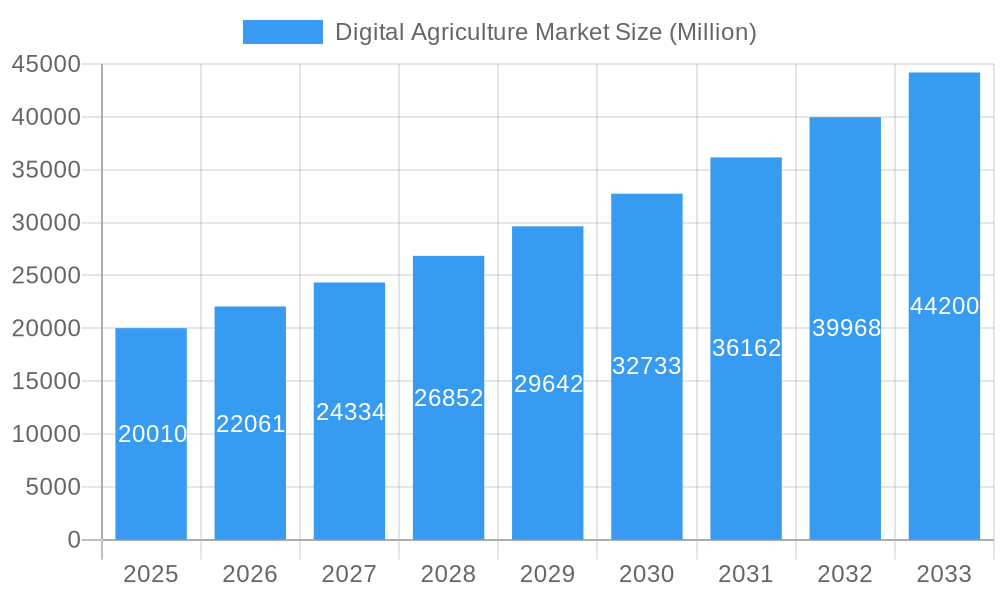
The global digital agriculture market, valued at $20.01 billion in 2021, is experiencing robust growth, projected to expand significantly by 2033. A Compound Annual Growth Rate (CAGR) of 10.50% indicates a substantial increase in market size driven by several key factors. The increasing adoption of precision farming techniques, fueled by advancements in artificial intelligence (AI), drone analytics, and variable rate technology (VRT), is a primary driver. Farmers are increasingly recognizing the benefits of data-driven decision-making for optimizing resource utilization, improving crop yields, and reducing operational costs. Furthermore, government initiatives promoting sustainable agriculture and technological advancements in sensor technologies, IoT devices, and cloud computing are further accelerating market expansion. The market is segmented across various applications, including crop monitoring, precision farming, and other agricultural solutions, each demonstrating unique growth trajectories. North America and Europe currently hold significant market shares, benefiting from early adoption and robust technological infrastructure; however, the Asia-Pacific region is poised for rapid growth due to increasing agricultural activity and expanding technological accessibility. Challenges such as high initial investment costs for implementing digital agriculture technologies and a lack of digital literacy among farmers in certain regions pose potential restraints. However, ongoing innovation and decreasing costs are gradually mitigating these obstacles.
Digital Agriculture Market Market Size (In Billion)
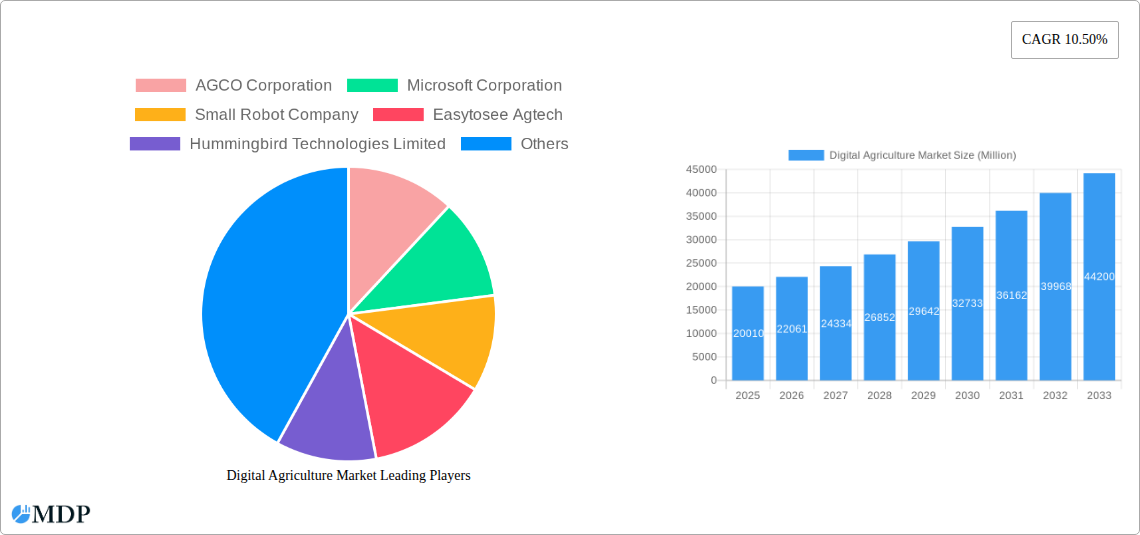
The competitive landscape is characterized by a mix of established agricultural machinery manufacturers like AGCO, Deere & Company, and Case IH, alongside technology giants like Microsoft and IBM, and specialized agri-tech startups like Small Robot Company and Hummingbird Technologies. This diverse range of players fosters innovation and competition, leading to a wider array of solutions for farmers. The market's future growth will likely be influenced by the continued development of more sophisticated AI-powered analytics, the integration of different digital agriculture platforms, and the expanding availability of high-speed internet access in rural areas. The focus on sustainable and environmentally friendly practices will also shape technological advancements within the digital agriculture sector, ultimately driving further market expansion and adoption.
Digital Agriculture Market Company Market Share
Digital Agriculture Market Report: 2019-2033
Unlocking the Potential of Precision Farming: A Comprehensive Analysis of the Digital Agriculture Market
This in-depth report provides a comprehensive analysis of the Digital Agriculture Market from 2019 to 2033, offering invaluable insights for industry stakeholders, investors, and strategic decision-makers. The study period covers the historical period (2019-2024), the base year (2025), and the forecast period (2025-2033), with a focus on the estimated year 2025. The report delves into market dynamics, industry trends, leading segments and regions, product developments, key growth drivers, challenges, and emerging opportunities, providing actionable intelligence to navigate the evolving landscape of digital agriculture. The market is projected to reach xx Million by 2033, exhibiting a CAGR of xx% during the forecast period.
Digital Agriculture Market Market Dynamics & Concentration
The Digital Agriculture market is characterized by a dynamic interplay of factors impacting its concentration and growth trajectory. Market concentration is currently moderate, with several key players holding significant market share, but also featuring a growing number of smaller, specialized companies and startups. The market share of the top five players in 2025 is estimated at xx%. Consolidation through mergers and acquisitions (M&A) is a significant driver, with an estimated xx M&A deals concluded between 2019 and 2024. Innovation is a key driver of market growth, with continuous advancements in data analytics, artificial intelligence (AI), and precision farming technologies fostering new product and service offerings. Regulatory frameworks, varying across different geographies, significantly impact market adoption. The existence of substitute technologies and solutions poses a challenge, but also presents opportunities for innovation and differentiation. End-user trends, primarily driven by the increasing need for enhanced efficiency, sustainability, and profitability in agricultural operations, are pushing market expansion.
- Market Concentration: Moderate, top 5 players hold xx% market share in 2025.
- M&A Activity: xx deals between 2019 and 2024, indicating a trend towards consolidation.
- Innovation Drivers: Advancements in AI, data analytics, and precision farming technologies.
- Regulatory Frameworks: Varying impact across geographies, influencing adoption rates.
- End-User Trends: Growing demand for efficiency, sustainability, and profitability in agriculture.
Digital Agriculture Market Industry Trends & Analysis
The Digital Agriculture market is experiencing rapid growth driven by several key factors. Technological advancements such as the Internet of Things (IoT), cloud computing, and big data analytics are transforming agricultural practices, enabling precise monitoring, data-driven decision-making, and optimized resource utilization. This is leading to increased productivity, reduced input costs, and improved crop yields. Consumer preferences for sustainably produced food are also driving demand for digital agriculture solutions that minimize environmental impact and promote efficient resource management. The competitive landscape is marked by both established players and emerging startups, fostering innovation and competition. The market is witnessing a significant increase in market penetration, with a projected xx% penetration rate by 2033, driven by the increasing affordability and accessibility of digital agriculture technologies.
- Market Growth Drivers: Technological advancements, consumer demand for sustainable food, and government initiatives.
- Technological Disruptions: IoT, cloud computing, AI, and big data analytics are revolutionizing agricultural operations.
- Consumer Preferences: Growing demand for sustainably produced food influences technology adoption.
- Competitive Dynamics: Intense competition between established players and emerging startups.
- CAGR: xx% during the forecast period (2025-2033)
- Market Penetration: Projected xx% by 2033
Leading Markets & Segments in Digital Agriculture Market
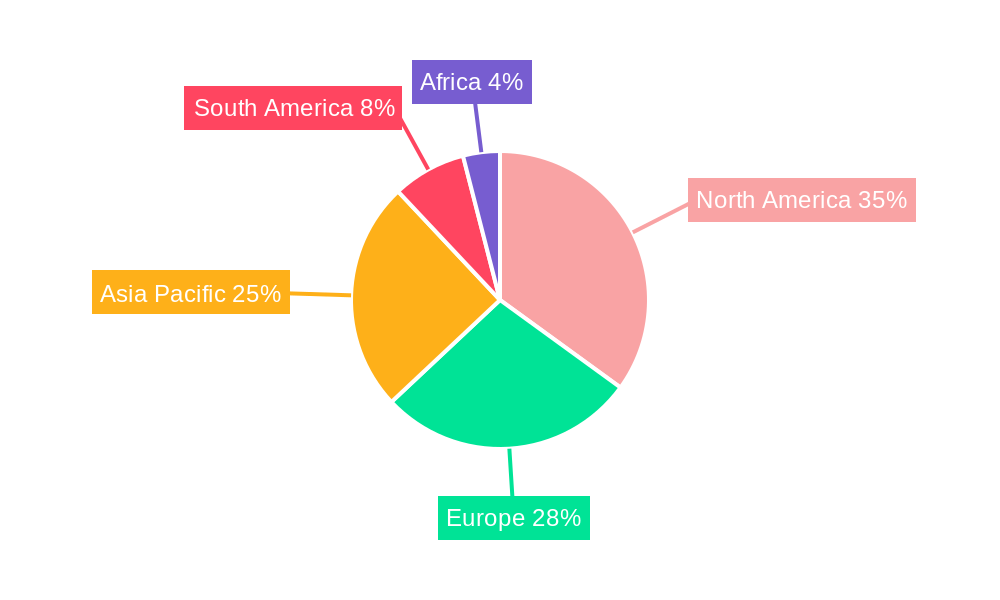
North America is currently the leading market for digital agriculture, followed by Europe and Asia-Pacific. The dominance of North America is primarily attributed to advanced agricultural infrastructure, high technology adoption rates, and strong government support for digital agriculture initiatives. Within segments, precision farming and crop monitoring are the most mature and fastest-growing segments. Variable rate technology solutions are also experiencing significant growth due to their ability to optimize fertilizer and pesticide application, reducing costs and environmental impact. Artificial Intelligence applications are emerging rapidly, promising transformative improvements in yield prediction, pest and disease detection and automation. Drone analytics is becoming crucial for efficient field monitoring and data collection.
Key Drivers:
- North America: Advanced agricultural infrastructure, high technology adoption rates, and strong government support.
- Europe: Growing emphasis on sustainable agriculture and precision farming technologies.
- Asia-Pacific: Expanding agricultural sector, increasing smartphone penetration, and government initiatives.
Dominant Segments:
- Precision Farming: High adoption rates due to proven efficiency gains and ROI.
- Crop Monitoring: Significant growth driven by the need for real-time insights and data-driven decision making.
- Variable Rate Technology: Increasing adoption for optimized resource utilization and cost savings.
- Artificial Intelligence: Rapid growth potential due to its transformative capabilities in various agricultural applications.
Digital Agriculture Market Product Developments
Recent product developments in the digital agriculture market are characterized by a strong focus on integration, AI-driven analytics, and user-friendly interfaces. New solutions integrate multiple technologies, providing comprehensive data management and decision-support systems. The emphasis is on cloud-based platforms offering scalability and accessibility. Competitive advantages are primarily derived from superior data analytics capabilities, accuracy of predictions, and the integration of advanced sensors and IoT devices. The market is rapidly evolving, with new products and services emerging constantly.
Key Drivers of Digital Agriculture Market Growth
Several key factors are driving the growth of the digital agriculture market. Technological advancements, particularly in areas like AI, IoT, and big data analytics, are enabling the development of more efficient and effective agricultural practices. Economic factors, such as increasing demand for food and rising input costs, are pushing farmers to adopt digital technologies to enhance productivity and reduce expenses. Favorable government policies and initiatives aimed at promoting sustainable agriculture and technological innovation are also fueling market growth. For example, various government subsidies and grants for the adoption of precision farming technologies are boosting market expansion in several regions.
Challenges in the Digital Agriculture Market Market
Despite its significant growth potential, the digital agriculture market faces several challenges. High initial investment costs for technology adoption can be a barrier for many farmers, particularly in developing countries. The complexity of implementing and managing digital agriculture solutions can also hinder adoption. Data security and privacy concerns are critical, requiring robust security measures. Furthermore, the lack of reliable internet connectivity in certain regions and the digital literacy gap among farmers pose significant hurdles to widespread adoption. The fragmented nature of the agricultural industry also creates integration challenges.
Emerging Opportunities in Digital Agriculture Market
The long-term growth of the digital agriculture market is expected to be driven by several emerging opportunities. Advancements in AI and machine learning will enable more sophisticated data analysis and predictive modeling, leading to improved decision-making and resource optimization. The increasing use of drones and remote sensing technologies will enhance field monitoring and data collection capabilities. Strategic partnerships between technology companies and agricultural businesses are expected to play a key role in accelerating market growth. Expansion into new geographical markets, particularly in developing countries with large agricultural sectors, presents significant opportunities.
Leading Players in the Digital Agriculture Market Sector
- AGCO Corporation
- Microsoft Corporation
- Small Robot Company
- Easytosee Agtech
- Hummingbird Technologies Limited
- DTN (CLEAR AG SOLUTIONS)
- Conservis Corporation
- Case IH Agriculture (CNH Industrial America LLC)
- Raven Industries
- Deere & Company
- IBM Corporation
- Topcon Positioning Systems
- Trimble Inc
- Gamaya SA
- AgEagle Aerial Systems Inc
- Bayer CropScience AG
Key Milestones in Digital Agriculture Market Industry
- 2020: Increased investment in AI-powered agricultural solutions.
- 2021: Launch of several cloud-based precision farming platforms.
- 2022: Significant advancements in drone technology for agricultural applications.
- 2023: Growth of partnerships between agricultural companies and tech providers.
- 2024: Increased regulatory focus on data security and privacy in digital agriculture.
Strategic Outlook for Digital Agriculture Market Market
The future of the digital agriculture market is promising, with continued growth driven by technological advancements, increasing demand for sustainable agriculture, and favorable government policies. Strategic opportunities lie in developing innovative solutions that address specific needs of farmers, expanding into new geographical markets, and fostering strategic partnerships. Companies that can effectively leverage data analytics, AI, and IoT technologies to enhance agricultural productivity and sustainability will be best positioned for success in this rapidly evolving market.
Digital Agriculture Market Segmentation
- 1. Production Analysis
- 2. Consumption Analysis
- 3. Import Market Analysis (Value & Volume)
- 4. Export Market Analysis (Value & Volume)
- 5. Price Trend Analysis
Digital Agriculture Market Segmentation By Geography
-
1. North America
- 1.1. United States
- 1.2. Canada
- 1.3. Mexico
-
2. South America
- 2.1. Brazil
- 2.2. Argentina
- 2.3. Rest of South America
-
3. Europe
- 3.1. United Kingdom
- 3.2. Germany
- 3.3. France
- 3.4. Italy
- 3.5. Spain
- 3.6. Russia
- 3.7. Benelux
- 3.8. Nordics
- 3.9. Rest of Europe
-
4. Middle East & Africa
- 4.1. Turkey
- 4.2. Israel
- 4.3. GCC
- 4.4. North Africa
- 4.5. South Africa
- 4.6. Rest of Middle East & Africa
-
5. Asia Pacific
- 5.1. China
- 5.2. India
- 5.3. Japan
- 5.4. South Korea
- 5.5. ASEAN
- 5.6. Oceania
- 5.7. Rest of Asia Pacific
Digital Agriculture Market Regional Market Share
Geographic Coverage of Digital Agriculture Market
Digital Agriculture Market REPORT HIGHLIGHTS
| Aspects | Details |
|---|---|
| Study Period | 2020-2034 |
| Base Year | 2025 |
| Estimated Year | 2026 |
| Forecast Period | 2026-2034 |
| Historical Period | 2020-2025 |
| Growth Rate | CAGR of 10.50% from 2020-2034 |
| Segmentation |
|
Table of Contents
- 1. Introduction
- 1.1. Research Scope
- 1.2. Market Segmentation
- 1.3. Research Objective
- 1.4. Definitions and Assumptions
- 2. Executive Summary
- 2.1. Market Snapshot
- 3. Market Dynamics
- 3.1. Market Drivers
- 3.2. Market Restrains
- 3.3. Market Trends
- 3.4. Market Opportunities
- 4. Market Factor Analysis
- 4.1. Porters Five Forces
- 4.1.1. Bargaining Power of Suppliers
- 4.1.2. Bargaining Power of Buyers
- 4.1.3. Threat of New Entrants
- 4.1.4. Threat of Substitutes
- 4.1.5. Competitive Rivalry
- 4.2. PESTEL analysis
- 4.3. BCG Analysis
- 4.3.1. Stars (High Growth, High Market Share)
- 4.3.2. Cash Cows (Low Growth, High Market Share)
- 4.3.3. Question Mark (High Growth, Low Market Share)
- 4.3.4. Dogs (Low Growth, Low Market Share)
- 4.4. Ansoff Matrix Analysis
- 4.5. Supply Chain Analysis
- 4.6. Regulatory Landscape
- 4.7. Current Market Potential and Opportunity Assessment (TAM–SAM–SOM Framework)
- 4.8. MDP Analyst Note
- 4.1. Porters Five Forces
- 5. Market Analysis, Insights and Forecast 2021-2033
- 5.1. Market Analysis, Insights and Forecast - by Production Analysis
- 5.2. Market Analysis, Insights and Forecast - by Consumption Analysis
- 5.3. Market Analysis, Insights and Forecast - by Import Market Analysis (Value & Volume)
- 5.4. Market Analysis, Insights and Forecast - by Export Market Analysis (Value & Volume)
- 5.5. Market Analysis, Insights and Forecast - by Price Trend Analysis
- 5.6. Market Analysis, Insights and Forecast - by Region
- 5.6.1. North America
- 5.6.2. South America
- 5.6.3. Europe
- 5.6.4. Middle East & Africa
- 5.6.5. Asia Pacific
- 6. Global Digital Agriculture Market Analysis, Insights and Forecast, 2021-2033
- 6.1. Market Analysis, Insights and Forecast - by Production Analysis
- 6.2. Market Analysis, Insights and Forecast - by Consumption Analysis
- 6.3. Market Analysis, Insights and Forecast - by Import Market Analysis (Value & Volume)
- 6.4. Market Analysis, Insights and Forecast - by Export Market Analysis (Value & Volume)
- 6.5. Market Analysis, Insights and Forecast - by Price Trend Analysis
- 7. North America Digital Agriculture Market Analysis, Insights and Forecast, 2020-2032
- 7.1. Market Analysis, Insights and Forecast - by Production Analysis
- 7.2. Market Analysis, Insights and Forecast - by Consumption Analysis
- 7.3. Market Analysis, Insights and Forecast - by Import Market Analysis (Value & Volume)
- 7.4. Market Analysis, Insights and Forecast - by Export Market Analysis (Value & Volume)
- 7.5. Market Analysis, Insights and Forecast - by Price Trend Analysis
- 8. South America Digital Agriculture Market Analysis, Insights and Forecast, 2020-2032
- 8.1. Market Analysis, Insights and Forecast - by Production Analysis
- 8.2. Market Analysis, Insights and Forecast - by Consumption Analysis
- 8.3. Market Analysis, Insights and Forecast - by Import Market Analysis (Value & Volume)
- 8.4. Market Analysis, Insights and Forecast - by Export Market Analysis (Value & Volume)
- 8.5. Market Analysis, Insights and Forecast - by Price Trend Analysis
- 9. Europe Digital Agriculture Market Analysis, Insights and Forecast, 2020-2032
- 9.1. Market Analysis, Insights and Forecast - by Production Analysis
- 9.2. Market Analysis, Insights and Forecast - by Consumption Analysis
- 9.3. Market Analysis, Insights and Forecast - by Import Market Analysis (Value & Volume)
- 9.4. Market Analysis, Insights and Forecast - by Export Market Analysis (Value & Volume)
- 9.5. Market Analysis, Insights and Forecast - by Price Trend Analysis
- 10. Middle East & Africa Digital Agriculture Market Analysis, Insights and Forecast, 2020-2032
- 10.1. Market Analysis, Insights and Forecast - by Production Analysis
- 10.2. Market Analysis, Insights and Forecast - by Consumption Analysis
- 10.3. Market Analysis, Insights and Forecast - by Import Market Analysis (Value & Volume)
- 10.4. Market Analysis, Insights and Forecast - by Export Market Analysis (Value & Volume)
- 10.5. Market Analysis, Insights and Forecast - by Price Trend Analysis
- 11. Asia Pacific Digital Agriculture Market Analysis, Insights and Forecast, 2020-2032
- 11.1. Market Analysis, Insights and Forecast - by Production Analysis
- 11.2. Market Analysis, Insights and Forecast - by Consumption Analysis
- 11.3. Market Analysis, Insights and Forecast - by Import Market Analysis (Value & Volume)
- 11.4. Market Analysis, Insights and Forecast - by Export Market Analysis (Value & Volume)
- 11.5. Market Analysis, Insights and Forecast - by Price Trend Analysis
- 12. Competitive Analysis
- 12.1. Company Profiles
- 12.1.1 AGCO Corporation
- 12.1.1.1. Company Overview
- 12.1.1.2. Products
- 12.1.1.3. Company Financials
- 12.1.1.4. SWOT Analysis
- 12.1.2 Microsoft Corporation
- 12.1.2.1. Company Overview
- 12.1.2.2. Products
- 12.1.2.3. Company Financials
- 12.1.2.4. SWOT Analysis
- 12.1.3 Small Robot Company
- 12.1.3.1. Company Overview
- 12.1.3.2. Products
- 12.1.3.3. Company Financials
- 12.1.3.4. SWOT Analysis
- 12.1.4 Easytosee Agtech
- 12.1.4.1. Company Overview
- 12.1.4.2. Products
- 12.1.4.3. Company Financials
- 12.1.4.4. SWOT Analysis
- 12.1.5 Hummingbird Technologies Limited
- 12.1.5.1. Company Overview
- 12.1.5.2. Products
- 12.1.5.3. Company Financials
- 12.1.5.4. SWOT Analysis
- 12.1.6 DTN (CLEAR AG SOLUTIONS)
- 12.1.6.1. Company Overview
- 12.1.6.2. Products
- 12.1.6.3. Company Financials
- 12.1.6.4. SWOT Analysis
- 12.1.7 Conservis Corporation
- 12.1.7.1. Company Overview
- 12.1.7.2. Products
- 12.1.7.3. Company Financials
- 12.1.7.4. SWOT Analysis
- 12.1.8 Case IH Agriculture (CNH Industrial America LLC )
- 12.1.8.1. Company Overview
- 12.1.8.2. Products
- 12.1.8.3. Company Financials
- 12.1.8.4. SWOT Analysis
- 12.1.9 Raven Industries
- 12.1.9.1. Company Overview
- 12.1.9.2. Products
- 12.1.9.3. Company Financials
- 12.1.9.4. SWOT Analysis
- 12.1.10 Deere & Company
- 12.1.10.1. Company Overview
- 12.1.10.2. Products
- 12.1.10.3. Company Financials
- 12.1.10.4. SWOT Analysis
- 12.1.11 IBM Corporation
- 12.1.11.1. Company Overview
- 12.1.11.2. Products
- 12.1.11.3. Company Financials
- 12.1.11.4. SWOT Analysis
- 12.1.12 Topcon Positioning Systems
- 12.1.12.1. Company Overview
- 12.1.12.2. Products
- 12.1.12.3. Company Financials
- 12.1.12.4. SWOT Analysis
- 12.1.13 Trimble Inc
- 12.1.13.1. Company Overview
- 12.1.13.2. Products
- 12.1.13.3. Company Financials
- 12.1.13.4. SWOT Analysis
- 12.1.14 Gamaya SA
- 12.1.14.1. Company Overview
- 12.1.14.2. Products
- 12.1.14.3. Company Financials
- 12.1.14.4. SWOT Analysis
- 12.1.15 AgEagle Aerial Systems Inc
- 12.1.15.1. Company Overview
- 12.1.15.2. Products
- 12.1.15.3. Company Financials
- 12.1.15.4. SWOT Analysis
- 12.1.16 Bayer CropScience AG
- 12.1.16.1. Company Overview
- 12.1.16.2. Products
- 12.1.16.3. Company Financials
- 12.1.16.4. SWOT Analysis
- 12.1.1 AGCO Corporation
- 12.2. Market Entropy
- 12.2.1 Company's Key Areas Served
- 12.2.2 Recent Developments
- 12.3. Company Market Share Analysis 2025
- 12.3.1 Top 5 Companies Market Share Analysis
- 12.3.2 Top 3 Companies Market Share Analysis
- 12.4. List of Potential Customers
- 13. Research Methodology
List of Figures
- Figure 1: Global Digital Agriculture Market Revenue Breakdown (Million, %) by Region 2025 & 2033
- Figure 2: North America Digital Agriculture Market Revenue (Million), by Production Analysis 2025 & 2033
- Figure 3: North America Digital Agriculture Market Revenue Share (%), by Production Analysis 2025 & 2033
- Figure 4: North America Digital Agriculture Market Revenue (Million), by Consumption Analysis 2025 & 2033
- Figure 5: North America Digital Agriculture Market Revenue Share (%), by Consumption Analysis 2025 & 2033
- Figure 6: North America Digital Agriculture Market Revenue (Million), by Import Market Analysis (Value & Volume) 2025 & 2033
- Figure 7: North America Digital Agriculture Market Revenue Share (%), by Import Market Analysis (Value & Volume) 2025 & 2033
- Figure 8: North America Digital Agriculture Market Revenue (Million), by Export Market Analysis (Value & Volume) 2025 & 2033
- Figure 9: North America Digital Agriculture Market Revenue Share (%), by Export Market Analysis (Value & Volume) 2025 & 2033
- Figure 10: North America Digital Agriculture Market Revenue (Million), by Price Trend Analysis 2025 & 2033
- Figure 11: North America Digital Agriculture Market Revenue Share (%), by Price Trend Analysis 2025 & 2033
- Figure 12: North America Digital Agriculture Market Revenue (Million), by Country 2025 & 2033
- Figure 13: North America Digital Agriculture Market Revenue Share (%), by Country 2025 & 2033
- Figure 14: South America Digital Agriculture Market Revenue (Million), by Production Analysis 2025 & 2033
- Figure 15: South America Digital Agriculture Market Revenue Share (%), by Production Analysis 2025 & 2033
- Figure 16: South America Digital Agriculture Market Revenue (Million), by Consumption Analysis 2025 & 2033
- Figure 17: South America Digital Agriculture Market Revenue Share (%), by Consumption Analysis 2025 & 2033
- Figure 18: South America Digital Agriculture Market Revenue (Million), by Import Market Analysis (Value & Volume) 2025 & 2033
- Figure 19: South America Digital Agriculture Market Revenue Share (%), by Import Market Analysis (Value & Volume) 2025 & 2033
- Figure 20: South America Digital Agriculture Market Revenue (Million), by Export Market Analysis (Value & Volume) 2025 & 2033
- Figure 21: South America Digital Agriculture Market Revenue Share (%), by Export Market Analysis (Value & Volume) 2025 & 2033
- Figure 22: South America Digital Agriculture Market Revenue (Million), by Price Trend Analysis 2025 & 2033
- Figure 23: South America Digital Agriculture Market Revenue Share (%), by Price Trend Analysis 2025 & 2033
- Figure 24: South America Digital Agriculture Market Revenue (Million), by Country 2025 & 2033
- Figure 25: South America Digital Agriculture Market Revenue Share (%), by Country 2025 & 2033
- Figure 26: Europe Digital Agriculture Market Revenue (Million), by Production Analysis 2025 & 2033
- Figure 27: Europe Digital Agriculture Market Revenue Share (%), by Production Analysis 2025 & 2033
- Figure 28: Europe Digital Agriculture Market Revenue (Million), by Consumption Analysis 2025 & 2033
- Figure 29: Europe Digital Agriculture Market Revenue Share (%), by Consumption Analysis 2025 & 2033
- Figure 30: Europe Digital Agriculture Market Revenue (Million), by Import Market Analysis (Value & Volume) 2025 & 2033
- Figure 31: Europe Digital Agriculture Market Revenue Share (%), by Import Market Analysis (Value & Volume) 2025 & 2033
- Figure 32: Europe Digital Agriculture Market Revenue (Million), by Export Market Analysis (Value & Volume) 2025 & 2033
- Figure 33: Europe Digital Agriculture Market Revenue Share (%), by Export Market Analysis (Value & Volume) 2025 & 2033
- Figure 34: Europe Digital Agriculture Market Revenue (Million), by Price Trend Analysis 2025 & 2033
- Figure 35: Europe Digital Agriculture Market Revenue Share (%), by Price Trend Analysis 2025 & 2033
- Figure 36: Europe Digital Agriculture Market Revenue (Million), by Country 2025 & 2033
- Figure 37: Europe Digital Agriculture Market Revenue Share (%), by Country 2025 & 2033
- Figure 38: Middle East & Africa Digital Agriculture Market Revenue (Million), by Production Analysis 2025 & 2033
- Figure 39: Middle East & Africa Digital Agriculture Market Revenue Share (%), by Production Analysis 2025 & 2033
- Figure 40: Middle East & Africa Digital Agriculture Market Revenue (Million), by Consumption Analysis 2025 & 2033
- Figure 41: Middle East & Africa Digital Agriculture Market Revenue Share (%), by Consumption Analysis 2025 & 2033
- Figure 42: Middle East & Africa Digital Agriculture Market Revenue (Million), by Import Market Analysis (Value & Volume) 2025 & 2033
- Figure 43: Middle East & Africa Digital Agriculture Market Revenue Share (%), by Import Market Analysis (Value & Volume) 2025 & 2033
- Figure 44: Middle East & Africa Digital Agriculture Market Revenue (Million), by Export Market Analysis (Value & Volume) 2025 & 2033
- Figure 45: Middle East & Africa Digital Agriculture Market Revenue Share (%), by Export Market Analysis (Value & Volume) 2025 & 2033
- Figure 46: Middle East & Africa Digital Agriculture Market Revenue (Million), by Price Trend Analysis 2025 & 2033
- Figure 47: Middle East & Africa Digital Agriculture Market Revenue Share (%), by Price Trend Analysis 2025 & 2033
- Figure 48: Middle East & Africa Digital Agriculture Market Revenue (Million), by Country 2025 & 2033
- Figure 49: Middle East & Africa Digital Agriculture Market Revenue Share (%), by Country 2025 & 2033
- Figure 50: Asia Pacific Digital Agriculture Market Revenue (Million), by Production Analysis 2025 & 2033
- Figure 51: Asia Pacific Digital Agriculture Market Revenue Share (%), by Production Analysis 2025 & 2033
- Figure 52: Asia Pacific Digital Agriculture Market Revenue (Million), by Consumption Analysis 2025 & 2033
- Figure 53: Asia Pacific Digital Agriculture Market Revenue Share (%), by Consumption Analysis 2025 & 2033
- Figure 54: Asia Pacific Digital Agriculture Market Revenue (Million), by Import Market Analysis (Value & Volume) 2025 & 2033
- Figure 55: Asia Pacific Digital Agriculture Market Revenue Share (%), by Import Market Analysis (Value & Volume) 2025 & 2033
- Figure 56: Asia Pacific Digital Agriculture Market Revenue (Million), by Export Market Analysis (Value & Volume) 2025 & 2033
- Figure 57: Asia Pacific Digital Agriculture Market Revenue Share (%), by Export Market Analysis (Value & Volume) 2025 & 2033
- Figure 58: Asia Pacific Digital Agriculture Market Revenue (Million), by Price Trend Analysis 2025 & 2033
- Figure 59: Asia Pacific Digital Agriculture Market Revenue Share (%), by Price Trend Analysis 2025 & 2033
- Figure 60: Asia Pacific Digital Agriculture Market Revenue (Million), by Country 2025 & 2033
- Figure 61: Asia Pacific Digital Agriculture Market Revenue Share (%), by Country 2025 & 2033
List of Tables
- Table 1: Global Digital Agriculture Market Revenue Million Forecast, by Production Analysis 2020 & 2033
- Table 2: Global Digital Agriculture Market Revenue Million Forecast, by Consumption Analysis 2020 & 2033
- Table 3: Global Digital Agriculture Market Revenue Million Forecast, by Import Market Analysis (Value & Volume) 2020 & 2033
- Table 4: Global Digital Agriculture Market Revenue Million Forecast, by Export Market Analysis (Value & Volume) 2020 & 2033
- Table 5: Global Digital Agriculture Market Revenue Million Forecast, by Price Trend Analysis 2020 & 2033
- Table 6: Global Digital Agriculture Market Revenue Million Forecast, by Region 2020 & 2033
- Table 7: Global Digital Agriculture Market Revenue Million Forecast, by Production Analysis 2020 & 2033
- Table 8: Global Digital Agriculture Market Revenue Million Forecast, by Consumption Analysis 2020 & 2033
- Table 9: Global Digital Agriculture Market Revenue Million Forecast, by Import Market Analysis (Value & Volume) 2020 & 2033
- Table 10: Global Digital Agriculture Market Revenue Million Forecast, by Export Market Analysis (Value & Volume) 2020 & 2033
- Table 11: Global Digital Agriculture Market Revenue Million Forecast, by Price Trend Analysis 2020 & 2033
- Table 12: Global Digital Agriculture Market Revenue Million Forecast, by Country 2020 & 2033
- Table 13: United States Digital Agriculture Market Revenue (Million) Forecast, by Application 2020 & 2033
- Table 14: Canada Digital Agriculture Market Revenue (Million) Forecast, by Application 2020 & 2033
- Table 15: Mexico Digital Agriculture Market Revenue (Million) Forecast, by Application 2020 & 2033
- Table 16: Global Digital Agriculture Market Revenue Million Forecast, by Production Analysis 2020 & 2033
- Table 17: Global Digital Agriculture Market Revenue Million Forecast, by Consumption Analysis 2020 & 2033
- Table 18: Global Digital Agriculture Market Revenue Million Forecast, by Import Market Analysis (Value & Volume) 2020 & 2033
- Table 19: Global Digital Agriculture Market Revenue Million Forecast, by Export Market Analysis (Value & Volume) 2020 & 2033
- Table 20: Global Digital Agriculture Market Revenue Million Forecast, by Price Trend Analysis 2020 & 2033
- Table 21: Global Digital Agriculture Market Revenue Million Forecast, by Country 2020 & 2033
- Table 22: Brazil Digital Agriculture Market Revenue (Million) Forecast, by Application 2020 & 2033
- Table 23: Argentina Digital Agriculture Market Revenue (Million) Forecast, by Application 2020 & 2033
- Table 24: Rest of South America Digital Agriculture Market Revenue (Million) Forecast, by Application 2020 & 2033
- Table 25: Global Digital Agriculture Market Revenue Million Forecast, by Production Analysis 2020 & 2033
- Table 26: Global Digital Agriculture Market Revenue Million Forecast, by Consumption Analysis 2020 & 2033
- Table 27: Global Digital Agriculture Market Revenue Million Forecast, by Import Market Analysis (Value & Volume) 2020 & 2033
- Table 28: Global Digital Agriculture Market Revenue Million Forecast, by Export Market Analysis (Value & Volume) 2020 & 2033
- Table 29: Global Digital Agriculture Market Revenue Million Forecast, by Price Trend Analysis 2020 & 2033
- Table 30: Global Digital Agriculture Market Revenue Million Forecast, by Country 2020 & 2033
- Table 31: United Kingdom Digital Agriculture Market Revenue (Million) Forecast, by Application 2020 & 2033
- Table 32: Germany Digital Agriculture Market Revenue (Million) Forecast, by Application 2020 & 2033
- Table 33: France Digital Agriculture Market Revenue (Million) Forecast, by Application 2020 & 2033
- Table 34: Italy Digital Agriculture Market Revenue (Million) Forecast, by Application 2020 & 2033
- Table 35: Spain Digital Agriculture Market Revenue (Million) Forecast, by Application 2020 & 2033
- Table 36: Russia Digital Agriculture Market Revenue (Million) Forecast, by Application 2020 & 2033
- Table 37: Benelux Digital Agriculture Market Revenue (Million) Forecast, by Application 2020 & 2033
- Table 38: Nordics Digital Agriculture Market Revenue (Million) Forecast, by Application 2020 & 2033
- Table 39: Rest of Europe Digital Agriculture Market Revenue (Million) Forecast, by Application 2020 & 2033
- Table 40: Global Digital Agriculture Market Revenue Million Forecast, by Production Analysis 2020 & 2033
- Table 41: Global Digital Agriculture Market Revenue Million Forecast, by Consumption Analysis 2020 & 2033
- Table 42: Global Digital Agriculture Market Revenue Million Forecast, by Import Market Analysis (Value & Volume) 2020 & 2033
- Table 43: Global Digital Agriculture Market Revenue Million Forecast, by Export Market Analysis (Value & Volume) 2020 & 2033
- Table 44: Global Digital Agriculture Market Revenue Million Forecast, by Price Trend Analysis 2020 & 2033
- Table 45: Global Digital Agriculture Market Revenue Million Forecast, by Country 2020 & 2033
- Table 46: Turkey Digital Agriculture Market Revenue (Million) Forecast, by Application 2020 & 2033
- Table 47: Israel Digital Agriculture Market Revenue (Million) Forecast, by Application 2020 & 2033
- Table 48: GCC Digital Agriculture Market Revenue (Million) Forecast, by Application 2020 & 2033
- Table 49: North Africa Digital Agriculture Market Revenue (Million) Forecast, by Application 2020 & 2033
- Table 50: South Africa Digital Agriculture Market Revenue (Million) Forecast, by Application 2020 & 2033
- Table 51: Rest of Middle East & Africa Digital Agriculture Market Revenue (Million) Forecast, by Application 2020 & 2033
- Table 52: Global Digital Agriculture Market Revenue Million Forecast, by Production Analysis 2020 & 2033
- Table 53: Global Digital Agriculture Market Revenue Million Forecast, by Consumption Analysis 2020 & 2033
- Table 54: Global Digital Agriculture Market Revenue Million Forecast, by Import Market Analysis (Value & Volume) 2020 & 2033
- Table 55: Global Digital Agriculture Market Revenue Million Forecast, by Export Market Analysis (Value & Volume) 2020 & 2033
- Table 56: Global Digital Agriculture Market Revenue Million Forecast, by Price Trend Analysis 2020 & 2033
- Table 57: Global Digital Agriculture Market Revenue Million Forecast, by Country 2020 & 2033
- Table 58: China Digital Agriculture Market Revenue (Million) Forecast, by Application 2020 & 2033
- Table 59: India Digital Agriculture Market Revenue (Million) Forecast, by Application 2020 & 2033
- Table 60: Japan Digital Agriculture Market Revenue (Million) Forecast, by Application 2020 & 2033
- Table 61: South Korea Digital Agriculture Market Revenue (Million) Forecast, by Application 2020 & 2033
- Table 62: ASEAN Digital Agriculture Market Revenue (Million) Forecast, by Application 2020 & 2033
- Table 63: Oceania Digital Agriculture Market Revenue (Million) Forecast, by Application 2020 & 2033
- Table 64: Rest of Asia Pacific Digital Agriculture Market Revenue (Million) Forecast, by Application 2020 & 2033
Frequently Asked Questions
1. What is the projected Compound Annual Growth Rate (CAGR) of the Digital Agriculture Market?
The projected CAGR is approximately 10.50%.
2. Which companies are prominent players in the Digital Agriculture Market?
Key companies in the market include AGCO Corporation, Microsoft Corporation, Small Robot Company, Easytosee Agtech, Hummingbird Technologies Limited, DTN (CLEAR AG SOLUTIONS), Conservis Corporation, Case IH Agriculture (CNH Industrial America LLC ), Raven Industries, Deere & Company, IBM Corporation, Topcon Positioning Systems, Trimble Inc, Gamaya SA, AgEagle Aerial Systems Inc, Bayer CropScience AG.
3. What are the main segments of the Digital Agriculture Market?
The market segments include Production Analysis, Consumption Analysis, Import Market Analysis (Value & Volume), Export Market Analysis (Value & Volume), Price Trend Analysis.
4. Can you provide details about the market size?
The market size is estimated to be USD 20.01 Million as of 2022.
5. What are some drivers contributing to market growth?
; Awareness About Health Benefits Associated With Pecan Consumption; Wide Application of Pecan.
6. What are the notable trends driving market growth?
Increasing Pressure for Higher Productivity and Improved Crop Health.
7. Are there any restraints impacting market growth?
; Volatility in the Prices; Adverse Weather Conditions Affecting Yield.
8. Can you provide examples of recent developments in the market?
N/A
9. What pricing options are available for accessing the report?
Pricing options include single-user, multi-user, and enterprise licenses priced at USD 4750, USD 5250, and USD 8750 respectively.
10. Is the market size provided in terms of value or volume?
The market size is provided in terms of value, measured in Million.
11. Are there any specific market keywords associated with the report?
Yes, the market keyword associated with the report is "Digital Agriculture Market," which aids in identifying and referencing the specific market segment covered.
12. How do I determine which pricing option suits my needs best?
The pricing options vary based on user requirements and access needs. Individual users may opt for single-user licenses, while businesses requiring broader access may choose multi-user or enterprise licenses for cost-effective access to the report.
13. Are there any additional resources or data provided in the Digital Agriculture Market report?
While the report offers comprehensive insights, it's advisable to review the specific contents or supplementary materials provided to ascertain if additional resources or data are available.
14. How can I stay updated on further developments or reports in the Digital Agriculture Market?
To stay informed about further developments, trends, and reports in the Digital Agriculture Market, consider subscribing to industry newsletters, following relevant companies and organizations, or regularly checking reputable industry news sources and publications.
Methodology
Step 1 - Identification of Relevant Samples Size from Population Database


Step 2 - Approaches for Defining Global Market Size (Value, Volume* & Price*)

Note*: In applicable scenarios
Step 3 - Data Sources
Primary Research
- Web Analytics
- Survey Reports
- Research Institute
- Latest Research Reports
- Opinion Leaders
Secondary Research
- Annual Reports
- White Paper
- Latest Press Release
- Industry Association
- Paid Database
- Investor Presentations

Step 4 - Data Triangulation
Involves using different sources of information in order to increase the validity of a study
These sources are likely to be stakeholders in a program - participants, other researchers, program staff, other community members, and so on.
Then we put all data in single framework & apply various statistical tools to find out the dynamic on the market.
During the analysis stage, feedback from the stakeholder groups would be compared to determine areas of agreement as well as areas of divergence