

Key Insights
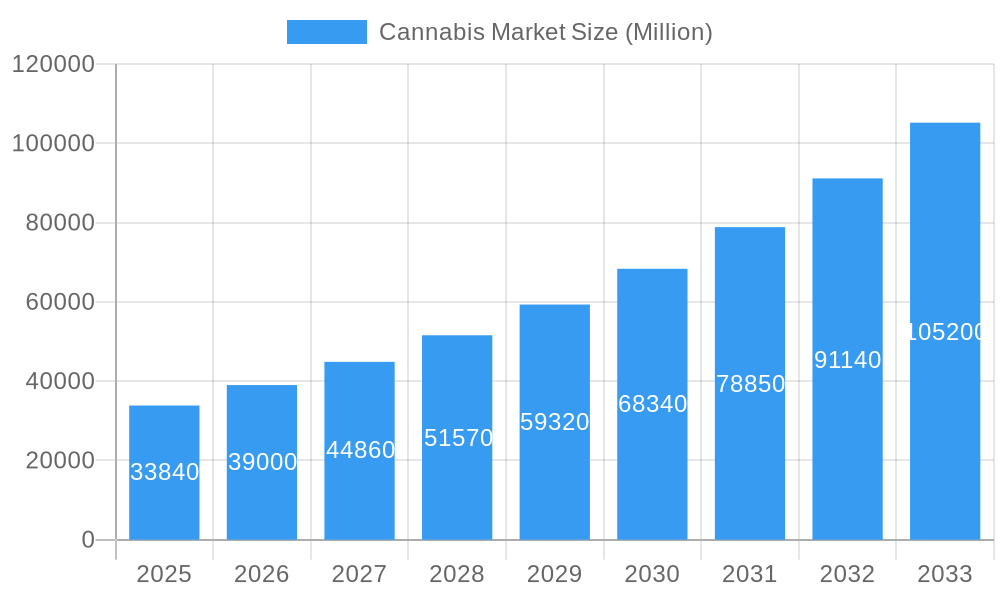
The global cannabis market, valued at $33.84 billion in 2025, is projected to experience robust growth, exhibiting a Compound Annual Growth Rate (CAGR) of 15.40% from 2025 to 2033. This expansion is fueled by several key factors. Increasing legalization and decriminalization efforts across numerous countries are significantly boosting market accessibility. Simultaneously, growing consumer awareness regarding the therapeutic benefits of cannabis, particularly CBD for various medical conditions like chronic pain and anxiety, is driving demand. Furthermore, the expanding research and development in cannabis-based pharmaceuticals is contributing to the market's impressive trajectory. Technological advancements in cultivation and extraction methods are also enhancing product quality and efficiency, making cannabis more accessible and affordable. The market is segmented by product type (capsules, concentrates, edibles, and others), application (medical and recreational), and compound type (THC, CBD, and balanced THC & CBD), reflecting diverse consumer needs and market opportunities. North America currently dominates the market share, due to early legalization and robust consumer demand in the United States and Canada, followed by Europe and Asia Pacific regions.
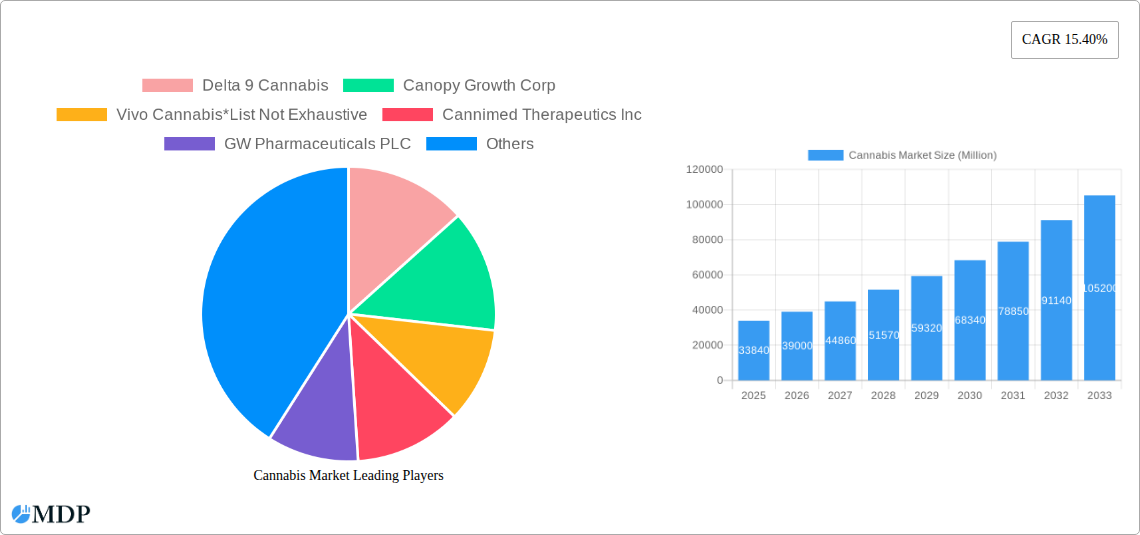
Cannabis Market Market Size (In Billion)
However, despite this significant growth potential, the market faces certain challenges. Stringent regulations and varying legal frameworks across different regions create complexities for businesses operating in this sector. Public perception and concerns regarding potential health risks, especially concerning THC consumption, also pose a significant restraint. Furthermore, the black market continues to compete, impacting the growth of the legitimate cannabis industry. Overcoming these challenges requires a concerted effort to address consumer concerns through transparent labeling and robust quality control measures, as well as supportive policy frameworks that encourage ethical and responsible business practices. The future of the cannabis market hinges on striking a balance between capitalizing on its immense growth potential and proactively managing the associated risks and regulatory hurdles.
Cannabis Market Company Market Share
Cannabis Market: A Comprehensive Report (2019-2033)
This comprehensive report provides an in-depth analysis of the global cannabis market, encompassing market dynamics, industry trends, leading players, and future projections from 2019 to 2033. The study covers key segments including product types (capsules, concentrates, edibles, and other product types), applications (medical and recreational), and compound types (THC, CBD, and balanced THC & CBD). With a focus on actionable insights and data-driven analysis, this report is essential for industry stakeholders, investors, and anyone seeking a thorough understanding of this rapidly evolving market. The report utilizes data from the historical period (2019-2024), the base year (2025), and projects to the estimated year (2025) and the forecast period (2025-2033). Expected market value figures are presented in Millions.
Cannabis Market Market Dynamics & Concentration
The global cannabis market is characterized by dynamic growth fueled by increasing legalization, evolving consumer preferences, and significant technological advancements. Market concentration is moderate, with several key players holding substantial market share, but numerous smaller companies also contributing significantly. The market witnessed xx Million in M&A activities during the historical period (2019-2024), with an average of xx deals per year. Innovation in product formulations, extraction methods, and delivery systems is a crucial driver, alongside the development of more sophisticated analytical techniques for quality control. Regulatory frameworks vary widely across different jurisdictions, significantly influencing market growth and investment decisions. The emergence of CBD-infused products presents a significant area of growth, while competition from other relaxation and wellness products acts as a substitute.
- Market Concentration: The top 5 players hold an estimated xx% market share in 2025.
- M&A Activity: The forecast period (2025-2033) is expected to see an increase in M&A activity driven by market consolidation and expansion strategies. A total of xx Million in M&A deal value is projected.
- Innovation Drivers: Advances in extraction technologies, development of novel delivery systems (e.g., vapes, edibles), and personalized formulations are key drivers.
- Regulatory Frameworks: Differing regulations across regions influence market access and product development strategies.
- Product Substitutes: Alternative relaxation methods such as yoga and meditation, and traditional pharmaceuticals, present competition.
- End-User Trends: Growing consumer awareness of cannabis' potential benefits and increasing acceptance are major market stimulants.
Cannabis Market Industry Trends & Analysis
The cannabis market is experiencing robust growth, projected at a CAGR of xx% during the forecast period (2025-2033). This growth is fueled by several key factors: the ongoing legalization of cannabis in various regions, the expanding acceptance of cannabis as a therapeutic treatment, and innovations leading to a wider range of products targeting diverse consumer needs. Technological advancements, particularly in cultivation techniques and extraction processes, contribute to increased efficiency and product quality. Consumer preferences are shifting toward higher-quality products, premium offerings, and personalized consumption experiences. The market's competitive landscape is dynamic, characterized by both large multinational corporations and smaller, specialized companies. Market penetration, especially in newly legalized markets, shows significant potential for future expansion. The increasing acceptance of cannabis for both recreational and medical purposes is a key market driver.
Leading Markets & Segments in Cannabis Market
The North American market currently dominates the global cannabis market, with the United States and Canada leading in terms of revenue generation and market size. Within the product segments, Edibles and Concentrates are experiencing the fastest growth, driven by increasing consumer demand for convenient and diverse consumption options. The Medical segment remains substantial, with a projected growth driven by ongoing research into the therapeutic potential of cannabis and CBD.
Key Drivers:
- North America: Progressive legalization policies and a large consumer base have created significant market opportunities.
- Edibles: Convenience and varied consumption methods fuel the popularity of edibles.
- Concentrates: High THC content and diverse product formats (e.g., oils, waxes) drive demand.
- Medical Cannabis: Ongoing research and increasing acceptance of cannabis for medical conditions.
Dominance Analysis: The United States holds the largest market share in the forecast period owing to its large population and varied state-level legalization strategies. Canada's established legal framework and early adoption of cannabis regulations also contribute to its significant market position.
Cannabis Market Product Developments
Recent product innovations focus on enhancing convenience, creating diverse product formats (e.g., infused beverages, topical creams, transdermal patches), and improving the overall consumer experience. Technological advancements in extraction and purification methods are leading to higher-quality products with more precise cannabinoid profiles. Companies are exploring new delivery methods and formulations to cater to specific consumer needs and preferences. The market is witnessing an increased focus on CBD-infused products that cater to a broader range of consumers seeking wellness benefits.
Key Drivers of Cannabis Market Growth
Several factors drive the cannabis market's expansion: Firstly, the increasing legalization and acceptance of cannabis for recreational and medicinal use are fundamental drivers. Secondly, technological advancements in cultivation, extraction, and formulation are enhancing product quality and driving innovation. Thirdly, evolving consumer preferences and the emergence of various product forms, from edibles to vapes, fuels market expansion. Finally, strategic partnerships, mergers and acquisitions, and investment in research and development contribute to overall market growth.
Challenges in the Cannabis Market Market
Significant challenges remain within the cannabis industry. Strict regulations, differing across jurisdictions, create hurdles for market entry and expansion. Supply chain complexities, from cultivation to distribution, pose logistical and cost challenges. The highly competitive market landscape with a blend of large corporations and smaller, agile businesses intensifies competition. These combined factors could potentially limit market growth in certain regions. The stigma associated with cannabis use still presents a barrier to full market acceptance.
Emerging Opportunities in Cannabis Market
The cannabis market presents numerous promising opportunities. Further research into the therapeutic benefits of cannabis and CBD will expand its medical applications. Strategic partnerships and collaborations between established players and emerging companies will accelerate innovation and market penetration. Expansion into new international markets with progressive legalization policies will drive revenue and overall growth. Technological advancements will continue to improve product quality, efficacy, and safety.
Leading Players in the Cannabis Market Sector
- Delta 9 Cannabis
- Canopy Growth Corp
- Vivo Cannabis
- Cannimed Therapeutics Inc
- GW Pharmaceuticals PLC
- Aphria Inc
- Tilray
- CV Sciences Inc
- MedReLeaf Corp
- Aurora Cannabis Inc
Key Milestones in Cannabis Market Industry
- May 2023: Toast and Nirvana Group partnered to launch innovative products in Oklahoma and New Mexico. This signifies expansion into new markets and an increased focus on product diversification.
- April 2023: Hello Juice and Smoothie partnered with Beleaf Co. to introduce CBD-infused juice shots. This demonstrates the increasing integration of CBD into various consumer products.
- May 2022: Canopy Growth launched new flavors of cannabis-infused carbonated drinks. This highlights the ongoing innovation in product offerings to cater to evolving consumer preferences.
Strategic Outlook for Cannabis Market Market
The cannabis market holds immense long-term growth potential, driven by continued legalization, technological advancements, and increasing consumer acceptance. Strategic investments in research and development, strategic partnerships, and expansion into new markets will be crucial for companies seeking to capitalize on this growth. The focus on product innovation, particularly in targeted formulations and delivery systems, will be key to securing a competitive advantage. The market's long-term prospects remain positive, with significant opportunities for expansion and innovation across various segments.
Cannabis Market Segmentation
- 1. Production Analysis
- 2. Consumption Analysis
- 3. Import Market Analysis (Value & Volume)
- 4. Export Market Analysis (Value & Volume)
- 5. Price Trend Analysis
Cannabis Market Segmentation By Geography
-
1. North America
- 1.1. United States
- 1.2. Canada
- 1.3. Mexico
-
2. South America
- 2.1. Brazil
- 2.2. Argentina
- 2.3. Rest of South America
-
3. Europe
- 3.1. United Kingdom
- 3.2. Germany
- 3.3. France
- 3.4. Italy
- 3.5. Spain
- 3.6. Russia
- 3.7. Benelux
- 3.8. Nordics
- 3.9. Rest of Europe
-
4. Middle East & Africa
- 4.1. Turkey
- 4.2. Israel
- 4.3. GCC
- 4.4. North Africa
- 4.5. South Africa
- 4.6. Rest of Middle East & Africa
-
5. Asia Pacific
- 5.1. China
- 5.2. India
- 5.3. Japan
- 5.4. South Korea
- 5.5. ASEAN
- 5.6. Oceania
- 5.7. Rest of Asia Pacific
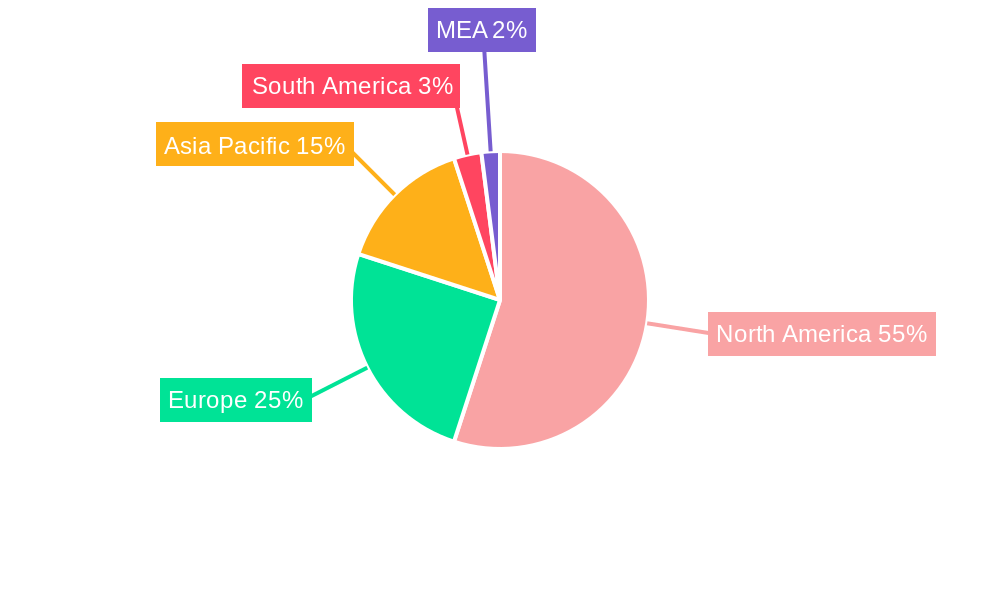
Cannabis Market Regional Market Share
Geographic Coverage of Cannabis Market
Cannabis Market REPORT HIGHLIGHTS
| Aspects | Details |
|---|---|
| Study Period | 2020-2034 |
| Base Year | 2025 |
| Estimated Year | 2026 |
| Forecast Period | 2026-2034 |
| Historical Period | 2020-2025 |
| Growth Rate | CAGR of 15.40% from 2020-2034 |
| Segmentation |
|
Table of Contents
- 1. Introduction
- 1.1. Research Scope
- 1.2. Market Segmentation
- 1.3. Research Objective
- 1.4. Definitions and Assumptions
- 2. Executive Summary
- 2.1. Market Snapshot
- 3. Market Dynamics
- 3.1. Market Drivers
- 3.2. Market Restrains
- 3.3. Market Trends
- 3.4. Market Opportunities
- 4. Market Factor Analysis
- 4.1. Porters Five Forces
- 4.1.1. Bargaining Power of Suppliers
- 4.1.2. Bargaining Power of Buyers
- 4.1.3. Threat of New Entrants
- 4.1.4. Threat of Substitutes
- 4.1.5. Competitive Rivalry
- 4.2. PESTEL analysis
- 4.3. BCG Analysis
- 4.3.1. Stars (High Growth, High Market Share)
- 4.3.2. Cash Cows (Low Growth, High Market Share)
- 4.3.3. Question Mark (High Growth, Low Market Share)
- 4.3.4. Dogs (Low Growth, Low Market Share)
- 4.4. Ansoff Matrix Analysis
- 4.5. Supply Chain Analysis
- 4.6. Regulatory Landscape
- 4.7. Current Market Potential and Opportunity Assessment (TAM–SAM–SOM Framework)
- 4.8. MDP Analyst Note
- 4.1. Porters Five Forces
- 5. Market Analysis, Insights and Forecast 2021-2033
- 5.1. Market Analysis, Insights and Forecast - by Production Analysis
- 5.2. Market Analysis, Insights and Forecast - by Consumption Analysis
- 5.3. Market Analysis, Insights and Forecast - by Import Market Analysis (Value & Volume)
- 5.4. Market Analysis, Insights and Forecast - by Export Market Analysis (Value & Volume)
- 5.5. Market Analysis, Insights and Forecast - by Price Trend Analysis
- 5.6. Market Analysis, Insights and Forecast - by Region
- 5.6.1. North America
- 5.6.2. South America
- 5.6.3. Europe
- 5.6.4. Middle East & Africa
- 5.6.5. Asia Pacific
- 6. Global Cannabis Market Analysis, Insights and Forecast, 2021-2033
- 6.1. Market Analysis, Insights and Forecast - by Production Analysis
- 6.2. Market Analysis, Insights and Forecast - by Consumption Analysis
- 6.3. Market Analysis, Insights and Forecast - by Import Market Analysis (Value & Volume)
- 6.4. Market Analysis, Insights and Forecast - by Export Market Analysis (Value & Volume)
- 6.5. Market Analysis, Insights and Forecast - by Price Trend Analysis
- 7. North America Cannabis Market Analysis, Insights and Forecast, 2020-2032
- 7.1. Market Analysis, Insights and Forecast - by Production Analysis
- 7.2. Market Analysis, Insights and Forecast - by Consumption Analysis
- 7.3. Market Analysis, Insights and Forecast - by Import Market Analysis (Value & Volume)
- 7.4. Market Analysis, Insights and Forecast - by Export Market Analysis (Value & Volume)
- 7.5. Market Analysis, Insights and Forecast - by Price Trend Analysis
- 8. South America Cannabis Market Analysis, Insights and Forecast, 2020-2032
- 8.1. Market Analysis, Insights and Forecast - by Production Analysis
- 8.2. Market Analysis, Insights and Forecast - by Consumption Analysis
- 8.3. Market Analysis, Insights and Forecast - by Import Market Analysis (Value & Volume)
- 8.4. Market Analysis, Insights and Forecast - by Export Market Analysis (Value & Volume)
- 8.5. Market Analysis, Insights and Forecast - by Price Trend Analysis
- 9. Europe Cannabis Market Analysis, Insights and Forecast, 2020-2032
- 9.1. Market Analysis, Insights and Forecast - by Production Analysis
- 9.2. Market Analysis, Insights and Forecast - by Consumption Analysis
- 9.3. Market Analysis, Insights and Forecast - by Import Market Analysis (Value & Volume)
- 9.4. Market Analysis, Insights and Forecast - by Export Market Analysis (Value & Volume)
- 9.5. Market Analysis, Insights and Forecast - by Price Trend Analysis
- 10. Middle East & Africa Cannabis Market Analysis, Insights and Forecast, 2020-2032
- 10.1. Market Analysis, Insights and Forecast - by Production Analysis
- 10.2. Market Analysis, Insights and Forecast - by Consumption Analysis
- 10.3. Market Analysis, Insights and Forecast - by Import Market Analysis (Value & Volume)
- 10.4. Market Analysis, Insights and Forecast - by Export Market Analysis (Value & Volume)
- 10.5. Market Analysis, Insights and Forecast - by Price Trend Analysis
- 11. Asia Pacific Cannabis Market Analysis, Insights and Forecast, 2020-2032
- 11.1. Market Analysis, Insights and Forecast - by Production Analysis
- 11.2. Market Analysis, Insights and Forecast - by Consumption Analysis
- 11.3. Market Analysis, Insights and Forecast - by Import Market Analysis (Value & Volume)
- 11.4. Market Analysis, Insights and Forecast - by Export Market Analysis (Value & Volume)
- 11.5. Market Analysis, Insights and Forecast - by Price Trend Analysis
- 12. Competitive Analysis
- 12.1. Company Profiles
- 12.1.1 Delta 9 Cannabis
- 12.1.1.1. Company Overview
- 12.1.1.2. Products
- 12.1.1.3. Company Financials
- 12.1.1.4. SWOT Analysis
- 12.1.2 Canopy Growth Corp
- 12.1.2.1. Company Overview
- 12.1.2.2. Products
- 12.1.2.3. Company Financials
- 12.1.2.4. SWOT Analysis
- 12.1.3 Vivo Cannabis*List Not Exhaustive
- 12.1.3.1. Company Overview
- 12.1.3.2. Products
- 12.1.3.3. Company Financials
- 12.1.3.4. SWOT Analysis
- 12.1.4 Cannimed Therapeutics Inc
- 12.1.4.1. Company Overview
- 12.1.4.2. Products
- 12.1.4.3. Company Financials
- 12.1.4.4. SWOT Analysis
- 12.1.5 GW Pharmaceuticals PLC
- 12.1.5.1. Company Overview
- 12.1.5.2. Products
- 12.1.5.3. Company Financials
- 12.1.5.4. SWOT Analysis
- 12.1.6 Aphria Inc
- 12.1.6.1. Company Overview
- 12.1.6.2. Products
- 12.1.6.3. Company Financials
- 12.1.6.4. SWOT Analysis
- 12.1.7 Tilray
- 12.1.7.1. Company Overview
- 12.1.7.2. Products
- 12.1.7.3. Company Financials
- 12.1.7.4. SWOT Analysis
- 12.1.8 CV Sciences Inc
- 12.1.8.1. Company Overview
- 12.1.8.2. Products
- 12.1.8.3. Company Financials
- 12.1.8.4. SWOT Analysis
- 12.1.9 MedReLeaf Corp
- 12.1.9.1. Company Overview
- 12.1.9.2. Products
- 12.1.9.3. Company Financials
- 12.1.9.4. SWOT Analysis
- 12.1.10 Aurora Cannabis Inc
- 12.1.10.1. Company Overview
- 12.1.10.2. Products
- 12.1.10.3. Company Financials
- 12.1.10.4. SWOT Analysis
- 12.1.1 Delta 9 Cannabis
- 12.2. Market Entropy
- 12.2.1 Company's Key Areas Served
- 12.2.2 Recent Developments
- 12.3. Company Market Share Analysis 2025
- 12.3.1 Top 5 Companies Market Share Analysis
- 12.3.2 Top 3 Companies Market Share Analysis
- 12.4. List of Potential Customers
- 13. Research Methodology
List of Figures
- Figure 1: Global Cannabis Market Revenue Breakdown (Million, %) by Region 2025 & 2033
- Figure 2: Global Cannabis Market Volume Breakdown (Kiloton, %) by Region 2025 & 2033
- Figure 3: North America Cannabis Market Revenue (Million), by Production Analysis 2025 & 2033
- Figure 4: North America Cannabis Market Volume (Kiloton), by Production Analysis 2025 & 2033
- Figure 5: North America Cannabis Market Revenue Share (%), by Production Analysis 2025 & 2033
- Figure 6: North America Cannabis Market Volume Share (%), by Production Analysis 2025 & 2033
- Figure 7: North America Cannabis Market Revenue (Million), by Consumption Analysis 2025 & 2033
- Figure 8: North America Cannabis Market Volume (Kiloton), by Consumption Analysis 2025 & 2033
- Figure 9: North America Cannabis Market Revenue Share (%), by Consumption Analysis 2025 & 2033
- Figure 10: North America Cannabis Market Volume Share (%), by Consumption Analysis 2025 & 2033
- Figure 11: North America Cannabis Market Revenue (Million), by Import Market Analysis (Value & Volume) 2025 & 2033
- Figure 12: North America Cannabis Market Volume (Kiloton), by Import Market Analysis (Value & Volume) 2025 & 2033
- Figure 13: North America Cannabis Market Revenue Share (%), by Import Market Analysis (Value & Volume) 2025 & 2033
- Figure 14: North America Cannabis Market Volume Share (%), by Import Market Analysis (Value & Volume) 2025 & 2033
- Figure 15: North America Cannabis Market Revenue (Million), by Export Market Analysis (Value & Volume) 2025 & 2033
- Figure 16: North America Cannabis Market Volume (Kiloton), by Export Market Analysis (Value & Volume) 2025 & 2033
- Figure 17: North America Cannabis Market Revenue Share (%), by Export Market Analysis (Value & Volume) 2025 & 2033
- Figure 18: North America Cannabis Market Volume Share (%), by Export Market Analysis (Value & Volume) 2025 & 2033
- Figure 19: North America Cannabis Market Revenue (Million), by Price Trend Analysis 2025 & 2033
- Figure 20: North America Cannabis Market Volume (Kiloton), by Price Trend Analysis 2025 & 2033
- Figure 21: North America Cannabis Market Revenue Share (%), by Price Trend Analysis 2025 & 2033
- Figure 22: North America Cannabis Market Volume Share (%), by Price Trend Analysis 2025 & 2033
- Figure 23: North America Cannabis Market Revenue (Million), by Country 2025 & 2033
- Figure 24: North America Cannabis Market Volume (Kiloton), by Country 2025 & 2033
- Figure 25: North America Cannabis Market Revenue Share (%), by Country 2025 & 2033
- Figure 26: North America Cannabis Market Volume Share (%), by Country 2025 & 2033
- Figure 27: South America Cannabis Market Revenue (Million), by Production Analysis 2025 & 2033
- Figure 28: South America Cannabis Market Volume (Kiloton), by Production Analysis 2025 & 2033
- Figure 29: South America Cannabis Market Revenue Share (%), by Production Analysis 2025 & 2033
- Figure 30: South America Cannabis Market Volume Share (%), by Production Analysis 2025 & 2033
- Figure 31: South America Cannabis Market Revenue (Million), by Consumption Analysis 2025 & 2033
- Figure 32: South America Cannabis Market Volume (Kiloton), by Consumption Analysis 2025 & 2033
- Figure 33: South America Cannabis Market Revenue Share (%), by Consumption Analysis 2025 & 2033
- Figure 34: South America Cannabis Market Volume Share (%), by Consumption Analysis 2025 & 2033
- Figure 35: South America Cannabis Market Revenue (Million), by Import Market Analysis (Value & Volume) 2025 & 2033
- Figure 36: South America Cannabis Market Volume (Kiloton), by Import Market Analysis (Value & Volume) 2025 & 2033
- Figure 37: South America Cannabis Market Revenue Share (%), by Import Market Analysis (Value & Volume) 2025 & 2033
- Figure 38: South America Cannabis Market Volume Share (%), by Import Market Analysis (Value & Volume) 2025 & 2033
- Figure 39: South America Cannabis Market Revenue (Million), by Export Market Analysis (Value & Volume) 2025 & 2033
- Figure 40: South America Cannabis Market Volume (Kiloton), by Export Market Analysis (Value & Volume) 2025 & 2033
- Figure 41: South America Cannabis Market Revenue Share (%), by Export Market Analysis (Value & Volume) 2025 & 2033
- Figure 42: South America Cannabis Market Volume Share (%), by Export Market Analysis (Value & Volume) 2025 & 2033
- Figure 43: South America Cannabis Market Revenue (Million), by Price Trend Analysis 2025 & 2033
- Figure 44: South America Cannabis Market Volume (Kiloton), by Price Trend Analysis 2025 & 2033
- Figure 45: South America Cannabis Market Revenue Share (%), by Price Trend Analysis 2025 & 2033
- Figure 46: South America Cannabis Market Volume Share (%), by Price Trend Analysis 2025 & 2033
- Figure 47: South America Cannabis Market Revenue (Million), by Country 2025 & 2033
- Figure 48: South America Cannabis Market Volume (Kiloton), by Country 2025 & 2033
- Figure 49: South America Cannabis Market Revenue Share (%), by Country 2025 & 2033
- Figure 50: South America Cannabis Market Volume Share (%), by Country 2025 & 2033
- Figure 51: Europe Cannabis Market Revenue (Million), by Production Analysis 2025 & 2033
- Figure 52: Europe Cannabis Market Volume (Kiloton), by Production Analysis 2025 & 2033
- Figure 53: Europe Cannabis Market Revenue Share (%), by Production Analysis 2025 & 2033
- Figure 54: Europe Cannabis Market Volume Share (%), by Production Analysis 2025 & 2033
- Figure 55: Europe Cannabis Market Revenue (Million), by Consumption Analysis 2025 & 2033
- Figure 56: Europe Cannabis Market Volume (Kiloton), by Consumption Analysis 2025 & 2033
- Figure 57: Europe Cannabis Market Revenue Share (%), by Consumption Analysis 2025 & 2033
- Figure 58: Europe Cannabis Market Volume Share (%), by Consumption Analysis 2025 & 2033
- Figure 59: Europe Cannabis Market Revenue (Million), by Import Market Analysis (Value & Volume) 2025 & 2033
- Figure 60: Europe Cannabis Market Volume (Kiloton), by Import Market Analysis (Value & Volume) 2025 & 2033
- Figure 61: Europe Cannabis Market Revenue Share (%), by Import Market Analysis (Value & Volume) 2025 & 2033
- Figure 62: Europe Cannabis Market Volume Share (%), by Import Market Analysis (Value & Volume) 2025 & 2033
- Figure 63: Europe Cannabis Market Revenue (Million), by Export Market Analysis (Value & Volume) 2025 & 2033
- Figure 64: Europe Cannabis Market Volume (Kiloton), by Export Market Analysis (Value & Volume) 2025 & 2033
- Figure 65: Europe Cannabis Market Revenue Share (%), by Export Market Analysis (Value & Volume) 2025 & 2033
- Figure 66: Europe Cannabis Market Volume Share (%), by Export Market Analysis (Value & Volume) 2025 & 2033
- Figure 67: Europe Cannabis Market Revenue (Million), by Price Trend Analysis 2025 & 2033
- Figure 68: Europe Cannabis Market Volume (Kiloton), by Price Trend Analysis 2025 & 2033
- Figure 69: Europe Cannabis Market Revenue Share (%), by Price Trend Analysis 2025 & 2033
- Figure 70: Europe Cannabis Market Volume Share (%), by Price Trend Analysis 2025 & 2033
- Figure 71: Europe Cannabis Market Revenue (Million), by Country 2025 & 2033
- Figure 72: Europe Cannabis Market Volume (Kiloton), by Country 2025 & 2033
- Figure 73: Europe Cannabis Market Revenue Share (%), by Country 2025 & 2033
- Figure 74: Europe Cannabis Market Volume Share (%), by Country 2025 & 2033
- Figure 75: Middle East & Africa Cannabis Market Revenue (Million), by Production Analysis 2025 & 2033
- Figure 76: Middle East & Africa Cannabis Market Volume (Kiloton), by Production Analysis 2025 & 2033
- Figure 77: Middle East & Africa Cannabis Market Revenue Share (%), by Production Analysis 2025 & 2033
- Figure 78: Middle East & Africa Cannabis Market Volume Share (%), by Production Analysis 2025 & 2033
- Figure 79: Middle East & Africa Cannabis Market Revenue (Million), by Consumption Analysis 2025 & 2033
- Figure 80: Middle East & Africa Cannabis Market Volume (Kiloton), by Consumption Analysis 2025 & 2033
- Figure 81: Middle East & Africa Cannabis Market Revenue Share (%), by Consumption Analysis 2025 & 2033
- Figure 82: Middle East & Africa Cannabis Market Volume Share (%), by Consumption Analysis 2025 & 2033
- Figure 83: Middle East & Africa Cannabis Market Revenue (Million), by Import Market Analysis (Value & Volume) 2025 & 2033
- Figure 84: Middle East & Africa Cannabis Market Volume (Kiloton), by Import Market Analysis (Value & Volume) 2025 & 2033
- Figure 85: Middle East & Africa Cannabis Market Revenue Share (%), by Import Market Analysis (Value & Volume) 2025 & 2033
- Figure 86: Middle East & Africa Cannabis Market Volume Share (%), by Import Market Analysis (Value & Volume) 2025 & 2033
- Figure 87: Middle East & Africa Cannabis Market Revenue (Million), by Export Market Analysis (Value & Volume) 2025 & 2033
- Figure 88: Middle East & Africa Cannabis Market Volume (Kiloton), by Export Market Analysis (Value & Volume) 2025 & 2033
- Figure 89: Middle East & Africa Cannabis Market Revenue Share (%), by Export Market Analysis (Value & Volume) 2025 & 2033
- Figure 90: Middle East & Africa Cannabis Market Volume Share (%), by Export Market Analysis (Value & Volume) 2025 & 2033
- Figure 91: Middle East & Africa Cannabis Market Revenue (Million), by Price Trend Analysis 2025 & 2033
- Figure 92: Middle East & Africa Cannabis Market Volume (Kiloton), by Price Trend Analysis 2025 & 2033
- Figure 93: Middle East & Africa Cannabis Market Revenue Share (%), by Price Trend Analysis 2025 & 2033
- Figure 94: Middle East & Africa Cannabis Market Volume Share (%), by Price Trend Analysis 2025 & 2033
- Figure 95: Middle East & Africa Cannabis Market Revenue (Million), by Country 2025 & 2033
- Figure 96: Middle East & Africa Cannabis Market Volume (Kiloton), by Country 2025 & 2033
- Figure 97: Middle East & Africa Cannabis Market Revenue Share (%), by Country 2025 & 2033
- Figure 98: Middle East & Africa Cannabis Market Volume Share (%), by Country 2025 & 2033
- Figure 99: Asia Pacific Cannabis Market Revenue (Million), by Production Analysis 2025 & 2033
- Figure 100: Asia Pacific Cannabis Market Volume (Kiloton), by Production Analysis 2025 & 2033
- Figure 101: Asia Pacific Cannabis Market Revenue Share (%), by Production Analysis 2025 & 2033
- Figure 102: Asia Pacific Cannabis Market Volume Share (%), by Production Analysis 2025 & 2033
- Figure 103: Asia Pacific Cannabis Market Revenue (Million), by Consumption Analysis 2025 & 2033
- Figure 104: Asia Pacific Cannabis Market Volume (Kiloton), by Consumption Analysis 2025 & 2033
- Figure 105: Asia Pacific Cannabis Market Revenue Share (%), by Consumption Analysis 2025 & 2033
- Figure 106: Asia Pacific Cannabis Market Volume Share (%), by Consumption Analysis 2025 & 2033
- Figure 107: Asia Pacific Cannabis Market Revenue (Million), by Import Market Analysis (Value & Volume) 2025 & 2033
- Figure 108: Asia Pacific Cannabis Market Volume (Kiloton), by Import Market Analysis (Value & Volume) 2025 & 2033
- Figure 109: Asia Pacific Cannabis Market Revenue Share (%), by Import Market Analysis (Value & Volume) 2025 & 2033
- Figure 110: Asia Pacific Cannabis Market Volume Share (%), by Import Market Analysis (Value & Volume) 2025 & 2033
- Figure 111: Asia Pacific Cannabis Market Revenue (Million), by Export Market Analysis (Value & Volume) 2025 & 2033
- Figure 112: Asia Pacific Cannabis Market Volume (Kiloton), by Export Market Analysis (Value & Volume) 2025 & 2033
- Figure 113: Asia Pacific Cannabis Market Revenue Share (%), by Export Market Analysis (Value & Volume) 2025 & 2033
- Figure 114: Asia Pacific Cannabis Market Volume Share (%), by Export Market Analysis (Value & Volume) 2025 & 2033
- Figure 115: Asia Pacific Cannabis Market Revenue (Million), by Price Trend Analysis 2025 & 2033
- Figure 116: Asia Pacific Cannabis Market Volume (Kiloton), by Price Trend Analysis 2025 & 2033
- Figure 117: Asia Pacific Cannabis Market Revenue Share (%), by Price Trend Analysis 2025 & 2033
- Figure 118: Asia Pacific Cannabis Market Volume Share (%), by Price Trend Analysis 2025 & 2033
- Figure 119: Asia Pacific Cannabis Market Revenue (Million), by Country 2025 & 2033
- Figure 120: Asia Pacific Cannabis Market Volume (Kiloton), by Country 2025 & 2033
- Figure 121: Asia Pacific Cannabis Market Revenue Share (%), by Country 2025 & 2033
- Figure 122: Asia Pacific Cannabis Market Volume Share (%), by Country 2025 & 2033
List of Tables
- Table 1: Global Cannabis Market Revenue Million Forecast, by Production Analysis 2020 & 2033
- Table 2: Global Cannabis Market Volume Kiloton Forecast, by Production Analysis 2020 & 2033
- Table 3: Global Cannabis Market Revenue Million Forecast, by Consumption Analysis 2020 & 2033
- Table 4: Global Cannabis Market Volume Kiloton Forecast, by Consumption Analysis 2020 & 2033
- Table 5: Global Cannabis Market Revenue Million Forecast, by Import Market Analysis (Value & Volume) 2020 & 2033
- Table 6: Global Cannabis Market Volume Kiloton Forecast, by Import Market Analysis (Value & Volume) 2020 & 2033
- Table 7: Global Cannabis Market Revenue Million Forecast, by Export Market Analysis (Value & Volume) 2020 & 2033
- Table 8: Global Cannabis Market Volume Kiloton Forecast, by Export Market Analysis (Value & Volume) 2020 & 2033
- Table 9: Global Cannabis Market Revenue Million Forecast, by Price Trend Analysis 2020 & 2033
- Table 10: Global Cannabis Market Volume Kiloton Forecast, by Price Trend Analysis 2020 & 2033
- Table 11: Global Cannabis Market Revenue Million Forecast, by Region 2020 & 2033
- Table 12: Global Cannabis Market Volume Kiloton Forecast, by Region 2020 & 2033
- Table 13: Global Cannabis Market Revenue Million Forecast, by Production Analysis 2020 & 2033
- Table 14: Global Cannabis Market Volume Kiloton Forecast, by Production Analysis 2020 & 2033
- Table 15: Global Cannabis Market Revenue Million Forecast, by Consumption Analysis 2020 & 2033
- Table 16: Global Cannabis Market Volume Kiloton Forecast, by Consumption Analysis 2020 & 2033
- Table 17: Global Cannabis Market Revenue Million Forecast, by Import Market Analysis (Value & Volume) 2020 & 2033
- Table 18: Global Cannabis Market Volume Kiloton Forecast, by Import Market Analysis (Value & Volume) 2020 & 2033
- Table 19: Global Cannabis Market Revenue Million Forecast, by Export Market Analysis (Value & Volume) 2020 & 2033
- Table 20: Global Cannabis Market Volume Kiloton Forecast, by Export Market Analysis (Value & Volume) 2020 & 2033
- Table 21: Global Cannabis Market Revenue Million Forecast, by Price Trend Analysis 2020 & 2033
- Table 22: Global Cannabis Market Volume Kiloton Forecast, by Price Trend Analysis 2020 & 2033
- Table 23: Global Cannabis Market Revenue Million Forecast, by Country 2020 & 2033
- Table 24: Global Cannabis Market Volume Kiloton Forecast, by Country 2020 & 2033
- Table 25: United States Cannabis Market Revenue (Million) Forecast, by Application 2020 & 2033
- Table 26: United States Cannabis Market Volume (Kiloton) Forecast, by Application 2020 & 2033
- Table 27: Canada Cannabis Market Revenue (Million) Forecast, by Application 2020 & 2033
- Table 28: Canada Cannabis Market Volume (Kiloton) Forecast, by Application 2020 & 2033
- Table 29: Mexico Cannabis Market Revenue (Million) Forecast, by Application 2020 & 2033
- Table 30: Mexico Cannabis Market Volume (Kiloton) Forecast, by Application 2020 & 2033
- Table 31: Global Cannabis Market Revenue Million Forecast, by Production Analysis 2020 & 2033
- Table 32: Global Cannabis Market Volume Kiloton Forecast, by Production Analysis 2020 & 2033
- Table 33: Global Cannabis Market Revenue Million Forecast, by Consumption Analysis 2020 & 2033
- Table 34: Global Cannabis Market Volume Kiloton Forecast, by Consumption Analysis 2020 & 2033
- Table 35: Global Cannabis Market Revenue Million Forecast, by Import Market Analysis (Value & Volume) 2020 & 2033
- Table 36: Global Cannabis Market Volume Kiloton Forecast, by Import Market Analysis (Value & Volume) 2020 & 2033
- Table 37: Global Cannabis Market Revenue Million Forecast, by Export Market Analysis (Value & Volume) 2020 & 2033
- Table 38: Global Cannabis Market Volume Kiloton Forecast, by Export Market Analysis (Value & Volume) 2020 & 2033
- Table 39: Global Cannabis Market Revenue Million Forecast, by Price Trend Analysis 2020 & 2033
- Table 40: Global Cannabis Market Volume Kiloton Forecast, by Price Trend Analysis 2020 & 2033
- Table 41: Global Cannabis Market Revenue Million Forecast, by Country 2020 & 2033
- Table 42: Global Cannabis Market Volume Kiloton Forecast, by Country 2020 & 2033
- Table 43: Brazil Cannabis Market Revenue (Million) Forecast, by Application 2020 & 2033
- Table 44: Brazil Cannabis Market Volume (Kiloton) Forecast, by Application 2020 & 2033
- Table 45: Argentina Cannabis Market Revenue (Million) Forecast, by Application 2020 & 2033
- Table 46: Argentina Cannabis Market Volume (Kiloton) Forecast, by Application 2020 & 2033
- Table 47: Rest of South America Cannabis Market Revenue (Million) Forecast, by Application 2020 & 2033
- Table 48: Rest of South America Cannabis Market Volume (Kiloton) Forecast, by Application 2020 & 2033
- Table 49: Global Cannabis Market Revenue Million Forecast, by Production Analysis 2020 & 2033
- Table 50: Global Cannabis Market Volume Kiloton Forecast, by Production Analysis 2020 & 2033
- Table 51: Global Cannabis Market Revenue Million Forecast, by Consumption Analysis 2020 & 2033
- Table 52: Global Cannabis Market Volume Kiloton Forecast, by Consumption Analysis 2020 & 2033
- Table 53: Global Cannabis Market Revenue Million Forecast, by Import Market Analysis (Value & Volume) 2020 & 2033
- Table 54: Global Cannabis Market Volume Kiloton Forecast, by Import Market Analysis (Value & Volume) 2020 & 2033
- Table 55: Global Cannabis Market Revenue Million Forecast, by Export Market Analysis (Value & Volume) 2020 & 2033
- Table 56: Global Cannabis Market Volume Kiloton Forecast, by Export Market Analysis (Value & Volume) 2020 & 2033
- Table 57: Global Cannabis Market Revenue Million Forecast, by Price Trend Analysis 2020 & 2033
- Table 58: Global Cannabis Market Volume Kiloton Forecast, by Price Trend Analysis 2020 & 2033
- Table 59: Global Cannabis Market Revenue Million Forecast, by Country 2020 & 2033
- Table 60: Global Cannabis Market Volume Kiloton Forecast, by Country 2020 & 2033
- Table 61: United Kingdom Cannabis Market Revenue (Million) Forecast, by Application 2020 & 2033
- Table 62: United Kingdom Cannabis Market Volume (Kiloton) Forecast, by Application 2020 & 2033
- Table 63: Germany Cannabis Market Revenue (Million) Forecast, by Application 2020 & 2033
- Table 64: Germany Cannabis Market Volume (Kiloton) Forecast, by Application 2020 & 2033
- Table 65: France Cannabis Market Revenue (Million) Forecast, by Application 2020 & 2033
- Table 66: France Cannabis Market Volume (Kiloton) Forecast, by Application 2020 & 2033
- Table 67: Italy Cannabis Market Revenue (Million) Forecast, by Application 2020 & 2033
- Table 68: Italy Cannabis Market Volume (Kiloton) Forecast, by Application 2020 & 2033
- Table 69: Spain Cannabis Market Revenue (Million) Forecast, by Application 2020 & 2033
- Table 70: Spain Cannabis Market Volume (Kiloton) Forecast, by Application 2020 & 2033
- Table 71: Russia Cannabis Market Revenue (Million) Forecast, by Application 2020 & 2033
- Table 72: Russia Cannabis Market Volume (Kiloton) Forecast, by Application 2020 & 2033
- Table 73: Benelux Cannabis Market Revenue (Million) Forecast, by Application 2020 & 2033
- Table 74: Benelux Cannabis Market Volume (Kiloton) Forecast, by Application 2020 & 2033
- Table 75: Nordics Cannabis Market Revenue (Million) Forecast, by Application 2020 & 2033
- Table 76: Nordics Cannabis Market Volume (Kiloton) Forecast, by Application 2020 & 2033
- Table 77: Rest of Europe Cannabis Market Revenue (Million) Forecast, by Application 2020 & 2033
- Table 78: Rest of Europe Cannabis Market Volume (Kiloton) Forecast, by Application 2020 & 2033
- Table 79: Global Cannabis Market Revenue Million Forecast, by Production Analysis 2020 & 2033
- Table 80: Global Cannabis Market Volume Kiloton Forecast, by Production Analysis 2020 & 2033
- Table 81: Global Cannabis Market Revenue Million Forecast, by Consumption Analysis 2020 & 2033
- Table 82: Global Cannabis Market Volume Kiloton Forecast, by Consumption Analysis 2020 & 2033
- Table 83: Global Cannabis Market Revenue Million Forecast, by Import Market Analysis (Value & Volume) 2020 & 2033
- Table 84: Global Cannabis Market Volume Kiloton Forecast, by Import Market Analysis (Value & Volume) 2020 & 2033
- Table 85: Global Cannabis Market Revenue Million Forecast, by Export Market Analysis (Value & Volume) 2020 & 2033
- Table 86: Global Cannabis Market Volume Kiloton Forecast, by Export Market Analysis (Value & Volume) 2020 & 2033
- Table 87: Global Cannabis Market Revenue Million Forecast, by Price Trend Analysis 2020 & 2033
- Table 88: Global Cannabis Market Volume Kiloton Forecast, by Price Trend Analysis 2020 & 2033
- Table 89: Global Cannabis Market Revenue Million Forecast, by Country 2020 & 2033
- Table 90: Global Cannabis Market Volume Kiloton Forecast, by Country 2020 & 2033
- Table 91: Turkey Cannabis Market Revenue (Million) Forecast, by Application 2020 & 2033
- Table 92: Turkey Cannabis Market Volume (Kiloton) Forecast, by Application 2020 & 2033
- Table 93: Israel Cannabis Market Revenue (Million) Forecast, by Application 2020 & 2033
- Table 94: Israel Cannabis Market Volume (Kiloton) Forecast, by Application 2020 & 2033
- Table 95: GCC Cannabis Market Revenue (Million) Forecast, by Application 2020 & 2033
- Table 96: GCC Cannabis Market Volume (Kiloton) Forecast, by Application 2020 & 2033
- Table 97: North Africa Cannabis Market Revenue (Million) Forecast, by Application 2020 & 2033
- Table 98: North Africa Cannabis Market Volume (Kiloton) Forecast, by Application 2020 & 2033
- Table 99: South Africa Cannabis Market Revenue (Million) Forecast, by Application 2020 & 2033
- Table 100: South Africa Cannabis Market Volume (Kiloton) Forecast, by Application 2020 & 2033
- Table 101: Rest of Middle East & Africa Cannabis Market Revenue (Million) Forecast, by Application 2020 & 2033
- Table 102: Rest of Middle East & Africa Cannabis Market Volume (Kiloton) Forecast, by Application 2020 & 2033
- Table 103: Global Cannabis Market Revenue Million Forecast, by Production Analysis 2020 & 2033
- Table 104: Global Cannabis Market Volume Kiloton Forecast, by Production Analysis 2020 & 2033
- Table 105: Global Cannabis Market Revenue Million Forecast, by Consumption Analysis 2020 & 2033
- Table 106: Global Cannabis Market Volume Kiloton Forecast, by Consumption Analysis 2020 & 2033
- Table 107: Global Cannabis Market Revenue Million Forecast, by Import Market Analysis (Value & Volume) 2020 & 2033
- Table 108: Global Cannabis Market Volume Kiloton Forecast, by Import Market Analysis (Value & Volume) 2020 & 2033
- Table 109: Global Cannabis Market Revenue Million Forecast, by Export Market Analysis (Value & Volume) 2020 & 2033
- Table 110: Global Cannabis Market Volume Kiloton Forecast, by Export Market Analysis (Value & Volume) 2020 & 2033
- Table 111: Global Cannabis Market Revenue Million Forecast, by Price Trend Analysis 2020 & 2033
- Table 112: Global Cannabis Market Volume Kiloton Forecast, by Price Trend Analysis 2020 & 2033
- Table 113: Global Cannabis Market Revenue Million Forecast, by Country 2020 & 2033
- Table 114: Global Cannabis Market Volume Kiloton Forecast, by Country 2020 & 2033
- Table 115: China Cannabis Market Revenue (Million) Forecast, by Application 2020 & 2033
- Table 116: China Cannabis Market Volume (Kiloton) Forecast, by Application 2020 & 2033
- Table 117: India Cannabis Market Revenue (Million) Forecast, by Application 2020 & 2033
- Table 118: India Cannabis Market Volume (Kiloton) Forecast, by Application 2020 & 2033
- Table 119: Japan Cannabis Market Revenue (Million) Forecast, by Application 2020 & 2033
- Table 120: Japan Cannabis Market Volume (Kiloton) Forecast, by Application 2020 & 2033
- Table 121: South Korea Cannabis Market Revenue (Million) Forecast, by Application 2020 & 2033
- Table 122: South Korea Cannabis Market Volume (Kiloton) Forecast, by Application 2020 & 2033
- Table 123: ASEAN Cannabis Market Revenue (Million) Forecast, by Application 2020 & 2033
- Table 124: ASEAN Cannabis Market Volume (Kiloton) Forecast, by Application 2020 & 2033
- Table 125: Oceania Cannabis Market Revenue (Million) Forecast, by Application 2020 & 2033
- Table 126: Oceania Cannabis Market Volume (Kiloton) Forecast, by Application 2020 & 2033
- Table 127: Rest of Asia Pacific Cannabis Market Revenue (Million) Forecast, by Application 2020 & 2033
- Table 128: Rest of Asia Pacific Cannabis Market Volume (Kiloton) Forecast, by Application 2020 & 2033
Frequently Asked Questions
1. What is the projected Compound Annual Growth Rate (CAGR) of the Cannabis Market?
The projected CAGR is approximately 15.40%.
2. Which companies are prominent players in the Cannabis Market?
Key companies in the market include Delta 9 Cannabis, Canopy Growth Corp, Vivo Cannabis*List Not Exhaustive, Cannimed Therapeutics Inc, GW Pharmaceuticals PLC, Aphria Inc, Tilray, CV Sciences Inc, MedReLeaf Corp, Aurora Cannabis Inc.
3. What are the main segments of the Cannabis Market?
The market segments include Production Analysis, Consumption Analysis, Import Market Analysis (Value & Volume), Export Market Analysis (Value & Volume), Price Trend Analysis.
4. Can you provide details about the market size?
The market size is estimated to be USD 33.84 Million as of 2022.
5. What are some drivers contributing to market growth?
Increasing Legalization of Cannabis; Growing Focus on Health Benefits of Cannabis.
6. What are the notable trends driving market growth?
Legalization of Cannabis.
7. Are there any restraints impacting market growth?
Lack of Data on Dosages and Results; Lack of Access to Financial Assistance.
8. Can you provide examples of recent developments in the market?
May 2023: Toast and Nirvana Group formed a partnership to introduce innovative products for patients and consumers in Oklahoma and New Mexico.
9. What pricing options are available for accessing the report?
Pricing options include single-user, multi-user, and enterprise licenses priced at USD 4750, USD 5250, and USD 8750 respectively.
10. Is the market size provided in terms of value or volume?
The market size is provided in terms of value, measured in Million and volume, measured in Kiloton.
11. Are there any specific market keywords associated with the report?
Yes, the market keyword associated with the report is "Cannabis Market," which aids in identifying and referencing the specific market segment covered.
12. How do I determine which pricing option suits my needs best?
The pricing options vary based on user requirements and access needs. Individual users may opt for single-user licenses, while businesses requiring broader access may choose multi-user or enterprise licenses for cost-effective access to the report.
13. Are there any additional resources or data provided in the Cannabis Market report?
While the report offers comprehensive insights, it's advisable to review the specific contents or supplementary materials provided to ascertain if additional resources or data are available.
14. How can I stay updated on further developments or reports in the Cannabis Market?
To stay informed about further developments, trends, and reports in the Cannabis Market, consider subscribing to industry newsletters, following relevant companies and organizations, or regularly checking reputable industry news sources and publications.
Methodology
Step 1 - Identification of Relevant Samples Size from Population Database


Step 2 - Approaches for Defining Global Market Size (Value, Volume* & Price*)

Note*: In applicable scenarios
Step 3 - Data Sources
Primary Research
- Web Analytics
- Survey Reports
- Research Institute
- Latest Research Reports
- Opinion Leaders
Secondary Research
- Annual Reports
- White Paper
- Latest Press Release
- Industry Association
- Paid Database
- Investor Presentations

Step 4 - Data Triangulation
Involves using different sources of information in order to increase the validity of a study
These sources are likely to be stakeholders in a program - participants, other researchers, program staff, other community members, and so on.
Then we put all data in single framework & apply various statistical tools to find out the dynamic on the market.
During the analysis stage, feedback from the stakeholder groups would be compared to determine areas of agreement as well as areas of divergence