

Key Insights
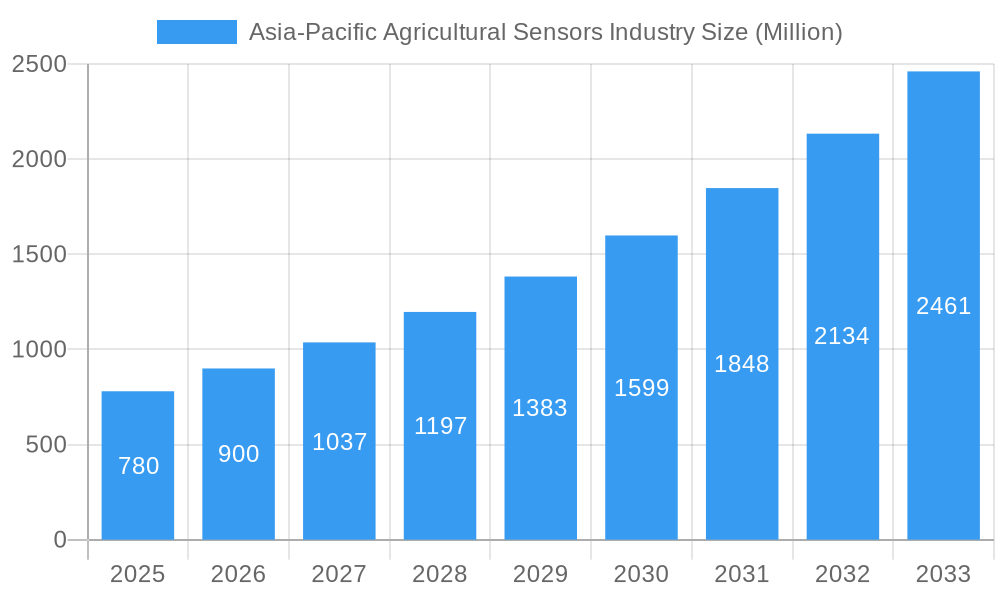
The Asia-Pacific agricultural sensors market, valued at $0.78 billion in 2025, is projected to experience robust growth, driven by increasing adoption of precision agriculture techniques and the rising demand for efficient resource management in the region's expansive agricultural sector. Factors such as government initiatives promoting technological advancements in farming, coupled with the increasing awareness of sustainable agricultural practices among farmers, are key catalysts for market expansion. The market is segmented by sensor type, with pressure, temperature, location, and optical sensors dominating the landscape. China, India, and Japan are major contributors to the overall market size, fueled by their substantial agricultural output and investment in technological upgrades. However, challenges such as high initial investment costs for sensor technology and a lack of technical expertise among some farmers could potentially restrain market growth to some extent. The forecast period (2025-2033) anticipates a Compound Annual Growth Rate (CAGR) of 15.40%, indicating a significant market expansion driven by continuous technological innovation and the growing adoption of smart farming solutions across the region. This growth is expected to be fueled by the introduction of more advanced, cost-effective, and user-friendly sensor technologies, further accelerating their adoption among smallholder and large-scale farmers alike. The increasing integration of IoT (Internet of Things) and AI (Artificial Intelligence) capabilities within agricultural sensors further enhances their market appeal and contributes significantly to the projected growth.
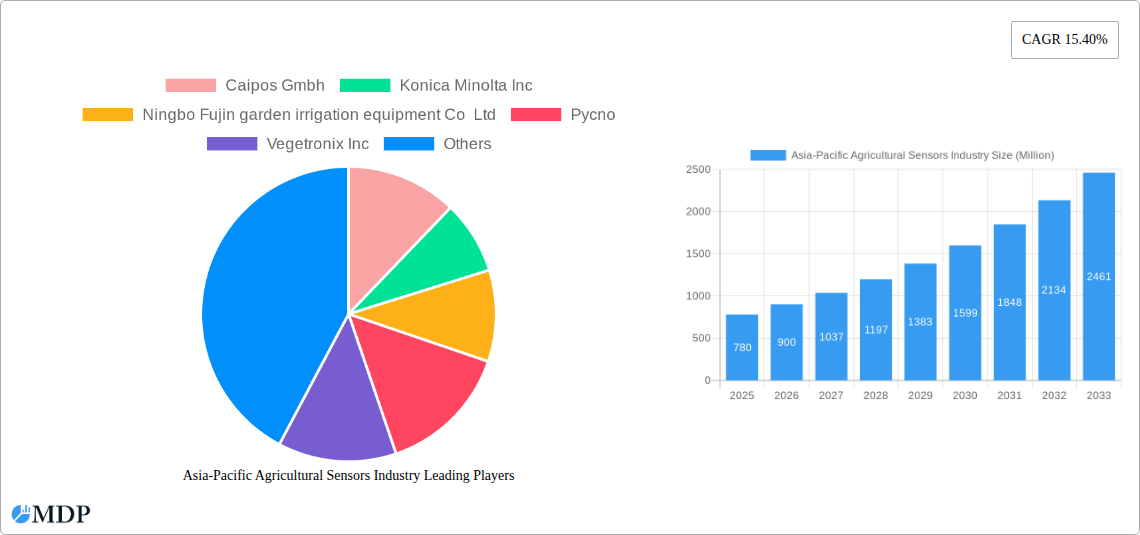
Asia-Pacific Agricultural Sensors Industry Market Size (In Million)
The competitive landscape includes both established international players and regional companies specializing in agricultural sensor technology. Companies are focusing on strategic partnerships, product innovation, and expansion into emerging markets to gain a competitive edge. The market’s future trajectory depends on factors like the advancement of sensor technology, government support for precision agriculture initiatives, and the overall economic growth within the Asia-Pacific region. The continued rise in demand for food security and the need for optimized resource utilization will likely propel further growth in the adoption of agricultural sensors, making it a lucrative market for companies operating in this space. Further research into specific regional nuances and the impact of external factors such as climate change on agricultural practices will be crucial for accurate forecasting and strategic planning.
Asia-Pacific Agricultural Sensors Industry Company Market Share
Asia-Pacific Agricultural Sensors Market: A Comprehensive Report (2019-2033)
This comprehensive report provides an in-depth analysis of the Asia-Pacific agricultural sensors industry, offering invaluable insights for stakeholders, investors, and industry professionals. The report covers market dynamics, leading players, technological advancements, and future growth prospects, providing a detailed roadmap for navigating this rapidly evolving sector. With a study period spanning 2019-2033, a base year of 2025, and a forecast period of 2025-2033, this report offers a robust historical overview and precise future predictions. The market size is projected to reach xx Million by 2033.
Asia-Pacific Agricultural Sensors Industry Market Dynamics & Concentration
The Asia-Pacific agricultural sensors market exhibits a moderately concentrated landscape, with a few key players holding significant market share. While exact figures for market share are proprietary data within the full report, key players like Trimble Inc and Konica Minolta Inc have established strong positions through strategic acquisitions and technological innovation. The market is characterized by continuous innovation driven by the need for precision agriculture and enhanced crop yields. Regulatory frameworks supporting sustainable agriculture practices further propel market growth. The emergence of affordable sensor technologies and increasing availability of IoT-enabled solutions serve as substitutes for traditional farming methods. End-user trends indicate a growing preference for data-driven decision-making and automation in farming practices, which has triggered considerable merger and acquisition (M&A) activity in recent years, with an estimated xx M&A deals taking place between 2019-2024. This consolidation is expected to further shape market dynamics in the coming years.
- Market Concentration: Moderately Concentrated
- Innovation Drivers: Precision agriculture, sustainable farming, data analytics
- Regulatory Frameworks: Government initiatives promoting technology adoption in agriculture
- Product Substitutes: Traditional farming methods
- End-User Trends: Increased adoption of data-driven decision making
- M&A Activities: xx M&A deals (2019-2024)
Asia-Pacific Agricultural Sensors Industry Industry Trends & Analysis
The Asia-Pacific agricultural sensors market is experiencing robust growth, fueled by several key trends. Technological advancements, particularly in IoT and AI, are driving higher market penetration of sensor technologies across various farming applications. Consumer preferences are shifting towards high-quality, sustainably produced food, creating demand for precision agriculture techniques that optimize resource use. The rising adoption of precision farming techniques is a major driver of market expansion. This adoption is propelled by factors such as increasing labor costs, a rising demand for high-quality food products and the need for improved resource efficiency. This trend is resulting in a considerable increase in the adoption of agricultural sensors across the region. The overall market is projected to expand at a CAGR of xx% during the forecast period (2025-2033), with market penetration expected to reach xx% by 2033. Competitive dynamics are intensifying as both established players and new entrants strive to capture market share.
Leading Markets & Segments in Asia-Pacific Agricultural Sensors Industry
The report identifies China and India as the leading markets in the Asia-Pacific region for agricultural sensors. Their large agricultural sectors and supportive government policies contribute to this dominance. Within the "By Type" segmentation, pressure sensors currently hold the largest market share followed closely by temperature sensors.
- Key Drivers for Dominant Segments & Regions:
- China and India: Large agricultural land area, government support for technological adoption, growing middle class increasing demand for high quality agricultural produce.
- Pressure Sensors: Critical for irrigation management and soil monitoring
- Temperature Sensors: Essential for monitoring environmental conditions and optimizing crop growth
The dominance of these segments and regions is analyzed in detail within the report, examining factors such as economic policies, infrastructure development, and farmer awareness levels. The influence of government subsidies and agricultural extension services is also explored, outlining their impact on market penetration and technological adoption.
Asia-Pacific Agricultural Sensors Industry Product Developments
Recent product innovations in the Asia-Pacific agricultural sensor market focus on miniaturization, improved accuracy, wireless connectivity, and data analytics capabilities. Sensors are being integrated into smart farming systems, providing real-time insights for efficient resource management and optimized crop yields. This enhanced functionality offers competitive advantages by enabling precise irrigation, targeted fertilization, and early disease detection. The market is witnessing a shift towards sophisticated sensor networks and cloud-based platforms for data aggregation and analysis.
Key Drivers of Asia-Pacific Agricultural Sensors Industry Growth
Several factors are driving the growth of the Asia-Pacific agricultural sensors industry. Technological advancements, including the development of smaller, more affordable, and more accurate sensors, play a significant role. Government initiatives promoting sustainable agriculture and precision farming create supportive policy environments. Furthermore, increasing awareness among farmers of the benefits of data-driven decision-making fuels demand for sensor-based solutions.
Challenges in the Asia-Pacific Agricultural Sensors Industry Market
The Asia-Pacific agricultural sensors market faces challenges including high initial investment costs for sensor technologies, the need for robust internet connectivity, particularly in rural areas, and a lack of skilled workforce to operate and maintain these sophisticated systems. Furthermore, data security and privacy concerns associated with the collection and use of agricultural data pose potential restraints on market growth. These factors can significantly affect the adoption rate of agricultural sensor technologies. The variability in weather conditions across the region also necessitates high sensor robustness.
Emerging Opportunities in Asia-Pacific Agricultural Sensors Industry
Significant long-term growth opportunities exist within the Asia-Pacific agricultural sensors market. The rising adoption of IoT and AI in agriculture, coupled with increasing investments in research and development, is expected to fuel innovation in sensor technology. Strategic partnerships between sensor manufacturers, agricultural technology companies, and farming communities can accelerate market expansion. The development of tailored sensor solutions targeting specific crops and farming practices presents considerable potential.
Leading Players in the Asia-Pacific Agricultural Sensors Industry Sector
- Caipos GmbH
- Konica Minolta Inc
- Ningbo Fujin garden irrigation equipment Co Ltd
- Pycno
- Vegetronix Inc
- TekBox Digital Solutions Vietnam Co Lt
- Libelium Comunicaciones Distribuidas Sl
- Trimble Inc
Key Milestones in Asia-Pacific Agricultural Sensors Industry Industry
- 2020: Increased investment in agricultural technology research across several Asian countries
- 2021: Launch of several new sensor-based precision farming solutions.
- 2022: Several key partnerships between technology providers and agricultural cooperatives.
- 2023: Government initiatives to promote the adoption of smart farming technologies.
Strategic Outlook for Asia-Pacific Agricultural Sensors Industry Market
The Asia-Pacific agricultural sensors market presents significant growth potential, driven by technological advancements and increasing demand for sustainable agriculture practices. Strategic partnerships and investments in research and development will be crucial for success. Focusing on developing cost-effective, user-friendly solutions tailored to the specific needs of local farming communities is essential for capturing market share in this rapidly expanding sector. The integration of AI and machine learning capabilities to improve data analysis and decision-making will be key differentiators for future market leaders.
Asia-Pacific Agricultural Sensors Industry Segmentation
- 1. Production Analysis
- 2. Consumption Analysis
- 3. Import Market Analysis (Value & Volume)
- 4. Export Market Analysis (Value & Volume)
- 5. Price Trend Analysis
Asia-Pacific Agricultural Sensors Industry Segmentation By Geography
-
1. Asia Pacific
- 1.1. China
- 1.2. Japan
- 1.3. South Korea
- 1.4. India
- 1.5. Australia
- 1.6. New Zealand
- 1.7. Indonesia
- 1.8. Malaysia
- 1.9. Singapore
- 1.10. Thailand
- 1.11. Vietnam
- 1.12. Philippines
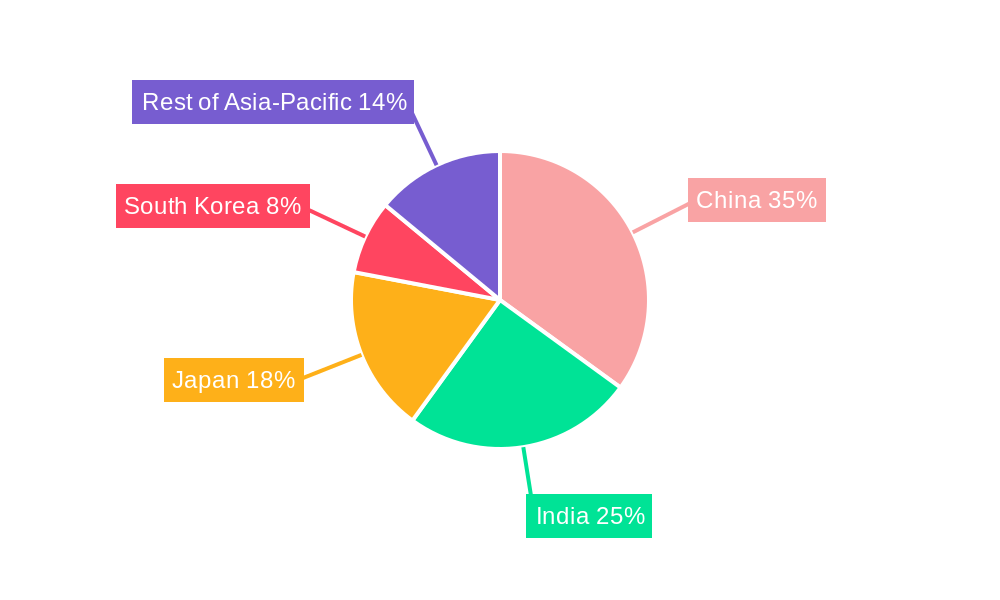
Asia-Pacific Agricultural Sensors Industry Regional Market Share
Geographic Coverage of Asia-Pacific Agricultural Sensors Industry
Asia-Pacific Agricultural Sensors Industry REPORT HIGHLIGHTS
| Aspects | Details |
|---|---|
| Study Period | 2020-2034 |
| Base Year | 2025 |
| Estimated Year | 2026 |
| Forecast Period | 2026-2034 |
| Historical Period | 2020-2025 |
| Growth Rate | CAGR of 15.40% from 2020-2034 |
| Segmentation |
|
Table of Contents
- 1. Introduction
- 1.1. Research Scope
- 1.2. Market Segmentation
- 1.3. Research Objective
- 1.4. Definitions and Assumptions
- 2. Executive Summary
- 2.1. Market Snapshot
- 3. Market Dynamics
- 3.1. Market Drivers
- 3.2. Market Restrains
- 3.3. Market Trends
- 3.4. Market Opportunities
- 4. Market Factor Analysis
- 4.1. Porters Five Forces
- 4.1.1. Bargaining Power of Suppliers
- 4.1.2. Bargaining Power of Buyers
- 4.1.3. Threat of New Entrants
- 4.1.4. Threat of Substitutes
- 4.1.5. Competitive Rivalry
- 4.2. PESTEL analysis
- 4.3. BCG Analysis
- 4.3.1. Stars (High Growth, High Market Share)
- 4.3.2. Cash Cows (Low Growth, High Market Share)
- 4.3.3. Question Mark (High Growth, Low Market Share)
- 4.3.4. Dogs (Low Growth, Low Market Share)
- 4.4. Ansoff Matrix Analysis
- 4.5. Supply Chain Analysis
- 4.6. Regulatory Landscape
- 4.7. Current Market Potential and Opportunity Assessment (TAM–SAM–SOM Framework)
- 4.8. MDP Analyst Note
- 4.1. Porters Five Forces
- 5. Market Analysis, Insights and Forecast 2021-2033
- 5.1. Market Analysis, Insights and Forecast - by Production Analysis
- 5.2. Market Analysis, Insights and Forecast - by Consumption Analysis
- 5.3. Market Analysis, Insights and Forecast - by Import Market Analysis (Value & Volume)
- 5.4. Market Analysis, Insights and Forecast - by Export Market Analysis (Value & Volume)
- 5.5. Market Analysis, Insights and Forecast - by Price Trend Analysis
- 5.6. Market Analysis, Insights and Forecast - by Region
- 5.6.1. Asia Pacific
- 6. Asia-Pacific Agricultural Sensors Industry Analysis, Insights and Forecast, 2021-2033
- 6.1. Market Analysis, Insights and Forecast - by Production Analysis
- 6.2. Market Analysis, Insights and Forecast - by Consumption Analysis
- 6.3. Market Analysis, Insights and Forecast - by Import Market Analysis (Value & Volume)
- 6.4. Market Analysis, Insights and Forecast - by Export Market Analysis (Value & Volume)
- 6.5. Market Analysis, Insights and Forecast - by Price Trend Analysis
- 7. Competitive Analysis
- 7.1. Company Profiles
- 7.1.1 Caipos Gmbh
- 7.1.1.1. Company Overview
- 7.1.1.2. Products
- 7.1.1.3. Company Financials
- 7.1.1.4. SWOT Analysis
- 7.1.2 Konica Minolta Inc
- 7.1.2.1. Company Overview
- 7.1.2.2. Products
- 7.1.2.3. Company Financials
- 7.1.2.4. SWOT Analysis
- 7.1.3 Ningbo Fujin garden irrigation equipment Co Ltd
- 7.1.3.1. Company Overview
- 7.1.3.2. Products
- 7.1.3.3. Company Financials
- 7.1.3.4. SWOT Analysis
- 7.1.4 Pycno
- 7.1.4.1. Company Overview
- 7.1.4.2. Products
- 7.1.4.3. Company Financials
- 7.1.4.4. SWOT Analysis
- 7.1.5 Vegetronix Inc
- 7.1.5.1. Company Overview
- 7.1.5.2. Products
- 7.1.5.3. Company Financials
- 7.1.5.4. SWOT Analysis
- 7.1.6 TekBox Digital Solutions Vietnam Co Lt
- 7.1.6.1. Company Overview
- 7.1.6.2. Products
- 7.1.6.3. Company Financials
- 7.1.6.4. SWOT Analysis
- 7.1.7 Libelium Comunicaciones Distribuidas Sl
- 7.1.7.1. Company Overview
- 7.1.7.2. Products
- 7.1.7.3. Company Financials
- 7.1.7.4. SWOT Analysis
- 7.1.8 Trimble Inc
- 7.1.8.1. Company Overview
- 7.1.8.2. Products
- 7.1.8.3. Company Financials
- 7.1.8.4. SWOT Analysis
- 7.1.1 Caipos Gmbh
- 7.2. Market Entropy
- 7.2.1 Company's Key Areas Served
- 7.2.2 Recent Developments
- 7.3. Company Market Share Analysis 2025
- 7.3.1 Top 5 Companies Market Share Analysis
- 7.3.2 Top 3 Companies Market Share Analysis
- 7.4. List of Potential Customers
- 8. Research Methodology
List of Figures
- Figure 1: Asia-Pacific Agricultural Sensors Industry Revenue Breakdown (Million, %) by Product 2025 & 2033
- Figure 2: Asia-Pacific Agricultural Sensors Industry Share (%) by Company 2025
List of Tables
- Table 1: Asia-Pacific Agricultural Sensors Industry Revenue Million Forecast, by Production Analysis 2020 & 2033
- Table 2: Asia-Pacific Agricultural Sensors Industry Volume Kiloton Forecast, by Production Analysis 2020 & 2033
- Table 3: Asia-Pacific Agricultural Sensors Industry Revenue Million Forecast, by Consumption Analysis 2020 & 2033
- Table 4: Asia-Pacific Agricultural Sensors Industry Volume Kiloton Forecast, by Consumption Analysis 2020 & 2033
- Table 5: Asia-Pacific Agricultural Sensors Industry Revenue Million Forecast, by Import Market Analysis (Value & Volume) 2020 & 2033
- Table 6: Asia-Pacific Agricultural Sensors Industry Volume Kiloton Forecast, by Import Market Analysis (Value & Volume) 2020 & 2033
- Table 7: Asia-Pacific Agricultural Sensors Industry Revenue Million Forecast, by Export Market Analysis (Value & Volume) 2020 & 2033
- Table 8: Asia-Pacific Agricultural Sensors Industry Volume Kiloton Forecast, by Export Market Analysis (Value & Volume) 2020 & 2033
- Table 9: Asia-Pacific Agricultural Sensors Industry Revenue Million Forecast, by Price Trend Analysis 2020 & 2033
- Table 10: Asia-Pacific Agricultural Sensors Industry Volume Kiloton Forecast, by Price Trend Analysis 2020 & 2033
- Table 11: Asia-Pacific Agricultural Sensors Industry Revenue Million Forecast, by Region 2020 & 2033
- Table 12: Asia-Pacific Agricultural Sensors Industry Volume Kiloton Forecast, by Region 2020 & 2033
- Table 13: Asia-Pacific Agricultural Sensors Industry Revenue Million Forecast, by Production Analysis 2020 & 2033
- Table 14: Asia-Pacific Agricultural Sensors Industry Volume Kiloton Forecast, by Production Analysis 2020 & 2033
- Table 15: Asia-Pacific Agricultural Sensors Industry Revenue Million Forecast, by Consumption Analysis 2020 & 2033
- Table 16: Asia-Pacific Agricultural Sensors Industry Volume Kiloton Forecast, by Consumption Analysis 2020 & 2033
- Table 17: Asia-Pacific Agricultural Sensors Industry Revenue Million Forecast, by Import Market Analysis (Value & Volume) 2020 & 2033
- Table 18: Asia-Pacific Agricultural Sensors Industry Volume Kiloton Forecast, by Import Market Analysis (Value & Volume) 2020 & 2033
- Table 19: Asia-Pacific Agricultural Sensors Industry Revenue Million Forecast, by Export Market Analysis (Value & Volume) 2020 & 2033
- Table 20: Asia-Pacific Agricultural Sensors Industry Volume Kiloton Forecast, by Export Market Analysis (Value & Volume) 2020 & 2033
- Table 21: Asia-Pacific Agricultural Sensors Industry Revenue Million Forecast, by Price Trend Analysis 2020 & 2033
- Table 22: Asia-Pacific Agricultural Sensors Industry Volume Kiloton Forecast, by Price Trend Analysis 2020 & 2033
- Table 23: Asia-Pacific Agricultural Sensors Industry Revenue Million Forecast, by Country 2020 & 2033
- Table 24: Asia-Pacific Agricultural Sensors Industry Volume Kiloton Forecast, by Country 2020 & 2033
- Table 25: China Asia-Pacific Agricultural Sensors Industry Revenue (Million) Forecast, by Application 2020 & 2033
- Table 26: China Asia-Pacific Agricultural Sensors Industry Volume (Kiloton) Forecast, by Application 2020 & 2033
- Table 27: Japan Asia-Pacific Agricultural Sensors Industry Revenue (Million) Forecast, by Application 2020 & 2033
- Table 28: Japan Asia-Pacific Agricultural Sensors Industry Volume (Kiloton) Forecast, by Application 2020 & 2033
- Table 29: South Korea Asia-Pacific Agricultural Sensors Industry Revenue (Million) Forecast, by Application 2020 & 2033
- Table 30: South Korea Asia-Pacific Agricultural Sensors Industry Volume (Kiloton) Forecast, by Application 2020 & 2033
- Table 31: India Asia-Pacific Agricultural Sensors Industry Revenue (Million) Forecast, by Application 2020 & 2033
- Table 32: India Asia-Pacific Agricultural Sensors Industry Volume (Kiloton) Forecast, by Application 2020 & 2033
- Table 33: Australia Asia-Pacific Agricultural Sensors Industry Revenue (Million) Forecast, by Application 2020 & 2033
- Table 34: Australia Asia-Pacific Agricultural Sensors Industry Volume (Kiloton) Forecast, by Application 2020 & 2033
- Table 35: New Zealand Asia-Pacific Agricultural Sensors Industry Revenue (Million) Forecast, by Application 2020 & 2033
- Table 36: New Zealand Asia-Pacific Agricultural Sensors Industry Volume (Kiloton) Forecast, by Application 2020 & 2033
- Table 37: Indonesia Asia-Pacific Agricultural Sensors Industry Revenue (Million) Forecast, by Application 2020 & 2033
- Table 38: Indonesia Asia-Pacific Agricultural Sensors Industry Volume (Kiloton) Forecast, by Application 2020 & 2033
- Table 39: Malaysia Asia-Pacific Agricultural Sensors Industry Revenue (Million) Forecast, by Application 2020 & 2033
- Table 40: Malaysia Asia-Pacific Agricultural Sensors Industry Volume (Kiloton) Forecast, by Application 2020 & 2033
- Table 41: Singapore Asia-Pacific Agricultural Sensors Industry Revenue (Million) Forecast, by Application 2020 & 2033
- Table 42: Singapore Asia-Pacific Agricultural Sensors Industry Volume (Kiloton) Forecast, by Application 2020 & 2033
- Table 43: Thailand Asia-Pacific Agricultural Sensors Industry Revenue (Million) Forecast, by Application 2020 & 2033
- Table 44: Thailand Asia-Pacific Agricultural Sensors Industry Volume (Kiloton) Forecast, by Application 2020 & 2033
- Table 45: Vietnam Asia-Pacific Agricultural Sensors Industry Revenue (Million) Forecast, by Application 2020 & 2033
- Table 46: Vietnam Asia-Pacific Agricultural Sensors Industry Volume (Kiloton) Forecast, by Application 2020 & 2033
- Table 47: Philippines Asia-Pacific Agricultural Sensors Industry Revenue (Million) Forecast, by Application 2020 & 2033
- Table 48: Philippines Asia-Pacific Agricultural Sensors Industry Volume (Kiloton) Forecast, by Application 2020 & 2033
Frequently Asked Questions
1. What is the projected Compound Annual Growth Rate (CAGR) of the Asia-Pacific Agricultural Sensors Industry?
The projected CAGR is approximately 15.40%.
2. Which companies are prominent players in the Asia-Pacific Agricultural Sensors Industry?
Key companies in the market include Caipos Gmbh, Konica Minolta Inc, Ningbo Fujin garden irrigation equipment Co Ltd, Pycno, Vegetronix Inc, TekBox Digital Solutions Vietnam Co Lt, Libelium Comunicaciones Distribuidas Sl, Trimble Inc.
3. What are the main segments of the Asia-Pacific Agricultural Sensors Industry?
The market segments include Production Analysis, Consumption Analysis, Import Market Analysis (Value & Volume), Export Market Analysis (Value & Volume), Price Trend Analysis.
4. Can you provide details about the market size?
The market size is estimated to be USD 0.78 Million as of 2022.
5. What are some drivers contributing to market growth?
Increasing Legalization of Cannabis; Growing Focus on Health Benefits of Cannabis.
6. What are the notable trends driving market growth?
Increasing Farm Mechanization Rates.
7. Are there any restraints impacting market growth?
Lack of Data on Dosages and Results; Lack of Access to Financial Assistance.
8. Can you provide examples of recent developments in the market?
N/A
9. What pricing options are available for accessing the report?
Pricing options include single-user, multi-user, and enterprise licenses priced at USD 4750, USD 5250, and USD 8750 respectively.
10. Is the market size provided in terms of value or volume?
The market size is provided in terms of value, measured in Million and volume, measured in Kiloton.
11. Are there any specific market keywords associated with the report?
Yes, the market keyword associated with the report is "Asia-Pacific Agricultural Sensors Industry," which aids in identifying and referencing the specific market segment covered.
12. How do I determine which pricing option suits my needs best?
The pricing options vary based on user requirements and access needs. Individual users may opt for single-user licenses, while businesses requiring broader access may choose multi-user or enterprise licenses for cost-effective access to the report.
13. Are there any additional resources or data provided in the Asia-Pacific Agricultural Sensors Industry report?
While the report offers comprehensive insights, it's advisable to review the specific contents or supplementary materials provided to ascertain if additional resources or data are available.
14. How can I stay updated on further developments or reports in the Asia-Pacific Agricultural Sensors Industry?
To stay informed about further developments, trends, and reports in the Asia-Pacific Agricultural Sensors Industry, consider subscribing to industry newsletters, following relevant companies and organizations, or regularly checking reputable industry news sources and publications.
Methodology
Step 1 - Identification of Relevant Samples Size from Population Database


Step 2 - Approaches for Defining Global Market Size (Value, Volume* & Price*)

Note*: In applicable scenarios
Step 3 - Data Sources
Primary Research
- Web Analytics
- Survey Reports
- Research Institute
- Latest Research Reports
- Opinion Leaders
Secondary Research
- Annual Reports
- White Paper
- Latest Press Release
- Industry Association
- Paid Database
- Investor Presentations

Step 4 - Data Triangulation
Involves using different sources of information in order to increase the validity of a study
These sources are likely to be stakeholders in a program - participants, other researchers, program staff, other community members, and so on.
Then we put all data in single framework & apply various statistical tools to find out the dynamic on the market.
During the analysis stage, feedback from the stakeholder groups would be compared to determine areas of agreement as well as areas of divergence