

Key Insights
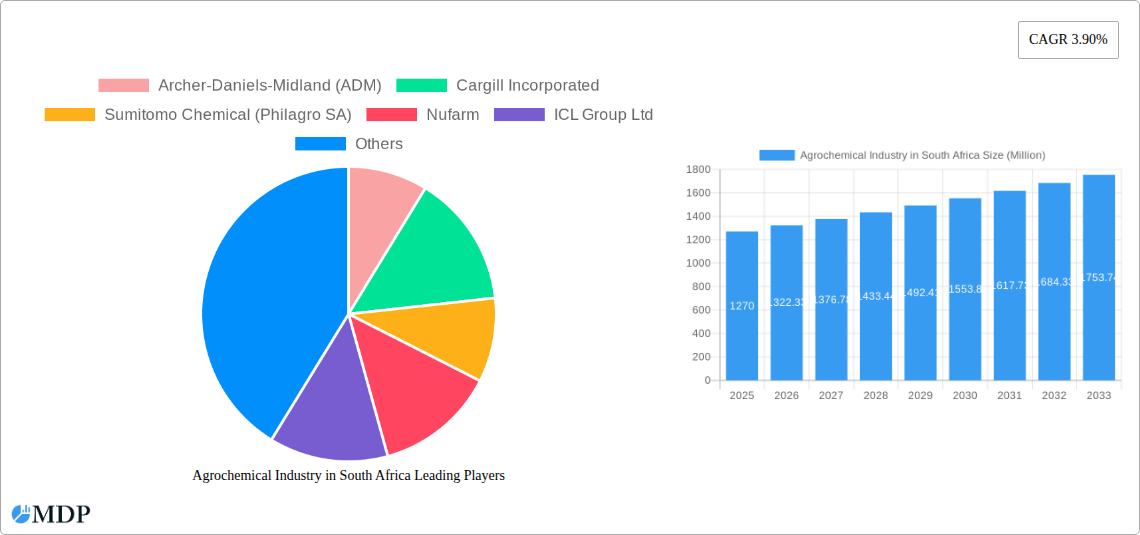
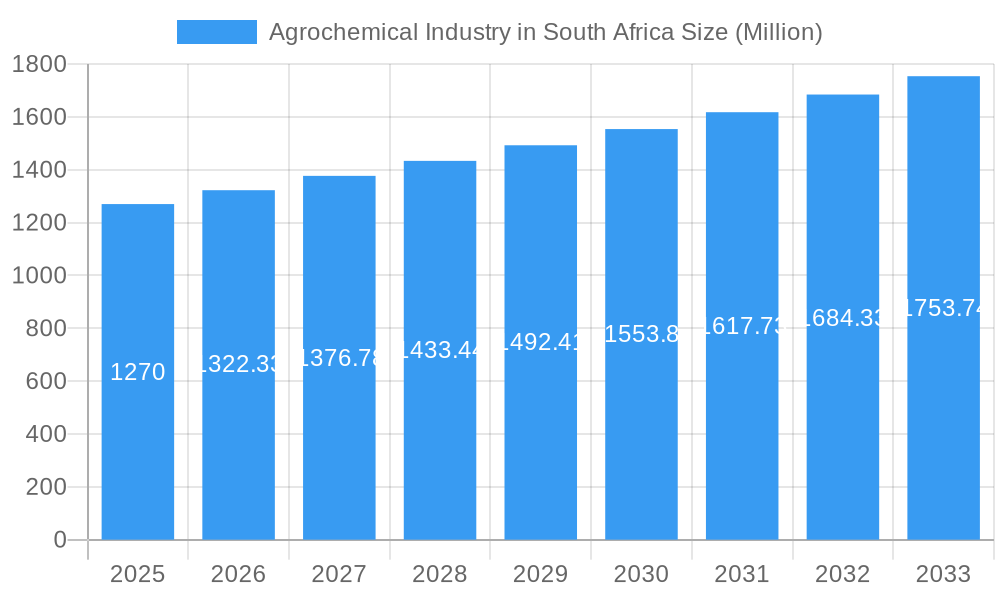
The South African agrochemical market, valued at approximately $1.27 billion in 2025, is projected to experience steady growth, driven by increasing agricultural output and the adoption of modern farming techniques to enhance crop yields and combat pests and diseases. The market's Compound Annual Growth Rate (CAGR) of 3.90% from 2025 to 2033 indicates a consistent expansion, with significant potential for further growth. Key drivers include rising demand for high-quality food products, government initiatives promoting agricultural modernization, and the increasing prevalence of crop diseases and pest infestations necessitating effective agrochemical solutions. The market is segmented by product type (fertilizers, pesticides, adjuvants, plant growth regulators) and application (crop-based, fruits and vegetables, turf and ornamental grass, other major crops). While precise market share data for each segment within South Africa is unavailable, analysis suggests that crop-based applications will likely dominate, given the country's focus on major agricultural exports like maize, sugarcane, and citrus fruits. Furthermore, the growing demand for aesthetically pleasing landscapes in urban areas suggests a notable contribution from the turf and ornamental grass segment. Leading companies such as Bayer CropScience AG, Syngenta AG, and others already established in the region are expected to capitalize on this growth, while smaller, local players might face challenges due to competition and price pressures from multinational corporations. The presence of established international players suggests a competitive landscape with ongoing innovation and the introduction of advanced agrochemical solutions.
Agrochemical Industry in South Africa Market Size (In Billion)
The South African agrochemical market's growth trajectory is subject to certain restraints, including climate change impacts affecting crop production, fluctuating commodity prices, and potential regulatory changes concerning agrochemical use. Sustainable and environmentally friendly agricultural practices are gaining traction, influencing the demand for bio-pesticides and other eco-friendly agrochemical options. This presents an opportunity for companies that can offer sustainable solutions while maintaining efficacy. Furthermore, access to finance and technology may limit growth among smallholder farmers, who make up a significant segment of the agricultural industry. Targeted interventions by government and private sector actors promoting sustainable agriculture and access to innovative technologies can effectively address these limitations, ensuring the continued expansion of the South African agrochemical market and enhancing agricultural productivity.
Agrochemical Industry in South Africa Company Market Share
South Africa's Agrochemical Industry: A Comprehensive Market Report (2019-2033)
This comprehensive report provides a detailed analysis of South Africa's agrochemical industry, covering market dynamics, leading players, and future growth prospects. The study period spans from 2019 to 2033, with 2025 serving as the base and estimated year. The report leverages data from the historical period (2019-2024) to forecast market trends from 2025 to 2033, providing invaluable insights for stakeholders. Key segments analyzed include fertilizers, pesticides, adjuvants, and plant growth regulators, across crop-based, fruit & vegetable, turf & ornamental grass, and other major crop applications. The report explores the activities of major players such as Archer Daniels Midland (ADM), Cargill, Sumitomo Chemical (Philagro SA), and many more, offering a detailed understanding of the competitive landscape. This in-depth analysis is essential for strategic decision-making, investment planning, and navigating the complexities of this dynamic market.
Agrochemical Industry in South Africa Market Dynamics & Concentration
South Africa's agrochemical market is characterized by a moderate level of concentration, with a few multinational corporations holding significant market share. The estimated market size in 2025 is approximately ZAR xx Million. The industry is driven by innovation in product formulations to address pest and disease resistance, improve crop yields, and meet sustainability goals. Stringent regulatory frameworks govern the registration and use of agrochemicals, impacting market access and product development. Substitutes, such as biopesticides and integrated pest management techniques, are gaining traction, posing both a challenge and an opportunity for traditional agrochemical companies. End-user trends, particularly towards precision agriculture and sustainable farming practices, are shaping product demand. M&A activity has been relatively moderate in recent years, with an estimated xx M&A deals concluded between 2019 and 2024.
- Market Share: The top 5 players hold an estimated xx% of the market share in 2025.
- M&A Activity: xx deals in the period 2019-2024, with a projected xx deals from 2025-2033.
- Regulatory Landscape: Stringent regulations regarding pesticide registration and usage are in place, impacting market access and product lifecycle.
- Innovation Drivers: Growing demand for higher crop yields, resistance to existing pesticides, and focus on sustainable agriculture are driving innovation.
Agrochemical Industry in South Africa Industry Trends & Analysis
The South African agrochemical market is projected to experience a Compound Annual Growth Rate (CAGR) of xx% during the forecast period (2025-2033). This growth is fueled by several factors, including increasing agricultural production, rising consumer demand for food, and government initiatives supporting agricultural development. Technological advancements, such as precision agriculture technologies and data-driven decision-making, are improving efficiency and optimizing agrochemical usage. Shifting consumer preferences toward organically produced food are impacting the demand for certain agrochemicals. Competitive dynamics are intensifying, with both established players and new entrants vying for market share. Market penetration of new technologies and products is steadily growing, contributing to this overall growth and potential for future expansion.
Leading Markets & Segments in Agrochemical Industry in South Africa
The dominant segments within the South African agrochemical market are Fertilizers and Pesticides, accounting for an estimated xx% and xx% of the total market value in 2025, respectively. Crop-based applications dominate, owing to the significant contribution of major crops such as maize, sugarcane, and wheat to the agricultural economy. The key drivers for this dominance include favorable climatic conditions in specific regions, well-established irrigation infrastructure in some areas, and supportive government policies aimed at increasing agricultural output. The Western Cape region displays significant growth potential for the fruit and vegetable sub-segment due to its established horticultural industry.
- Key Drivers for Fertilizers Dominance: Intensive farming practices, soil nutrient depletion, and government support for fertilizer usage.
- Key Drivers for Pesticide Dominance: Prevalence of crop diseases and pests, increasing crop yields and quality.
- Key Drivers for Crop-Based Applications: Large acreage under cultivation of major crops, government support for commercial agriculture.
- Regional Dominance: Western Cape for Fruits and Vegetables; Mpumalanga & KwaZulu-Natal for Crop-based applications.
Agrochemical Industry in South Africa Product Developments
Recent product developments focus on enhancing efficacy, reducing environmental impact, and improving application methods. New formulations offer improved target specificity, reducing off-target effects. Technological advancements are producing biopesticides and other environmentally friendly options. These innovations are tailored to address specific pest and disease challenges, whilst improving sustainability and increasing profitability for farmers.
Key Drivers of Agrochemical Industry in South Africa Growth
Several factors are driving the growth of South Africa's agrochemical industry. Technological advancements in precision agriculture, enabling optimized agrochemical usage and reducing waste, are key. Government initiatives supporting agricultural development and promoting efficient farming practices also contribute. Favorable economic conditions, including increased investment in the agricultural sector, further boost market growth. Finally, rising consumer demand for food and the need to improve crop yields contribute to the market expansion.
Challenges in the Agrochemical Industry in South Africa Market
The industry faces challenges including stringent regulatory requirements for product registration and usage, which increase development costs and timelines. Supply chain disruptions and fluctuations in raw material prices also impact profitability. Intense competition among established players and the emergence of new entrants create pricing pressures. These factors collectively impact market growth and operational efficiency.
Emerging Opportunities in Agrochemical Industry in South Africa
The long-term growth of South Africa's agrochemical industry is fueled by several opportunities. Advancements in biotechnology and precision agriculture are poised to transform the sector, increasing efficiency and sustainability. Strategic partnerships between agrochemical companies and farmers are improving access to innovative solutions. Expanding into new markets and segments presents potential for future market growth and improved revenue streams.
Leading Players in the Agrochemical Industry in South Africa Sector
- Archer-Daniels-Midland (ADM)
- Cargill Incorporated
- Sumitomo Chemical (Philagro SA)
- Nufarm
- ICL Group Ltd
- UPL Limited
- BASF SE
- FMC Corporation
- Sociedad Química y Minera de Chile (SQM)
- Belaruskali
- Sasol Limited
- K+S AG
- ADAMA Ltd
- Uralkal
- CF Industries Holdings
- OCP Group
- Land O' Lakes (Villa Crop Protection (Pty) Ltd)
- Yara International ASA
- Syngenta AG
- Nutrien Ltd
- Corteva Agriscience
- Bayer CropScience AG
Key Milestones in Agrochemical Industry in South Africa Industry
- 2020: Introduction of new regulations on pesticide registration.
- 2021: Launch of a precision agriculture initiative by the government.
- 2022: Acquisition of a local agrochemical company by a multinational corporation.
- 2023: Increased investment in research and development of biopesticides.
- 2024: Launch of a new sustainable farming program by a major player.
Strategic Outlook for Agrochemical Industry in South Africa Market
The future of South Africa's agrochemical market is bright, driven by increasing agricultural output, technological advancements, and supportive government policies. Strategic partnerships, focus on sustainable solutions, and efficient regulatory frameworks will foster industry growth and innovation. Companies that adapt to changing consumer preferences, adopt sustainable practices, and embrace technological advancements are well-positioned to capitalize on the significant opportunities in this dynamic market.
Agrochemical Industry in South Africa Segmentation
- 1. Production Analysis
- 2. Consumption Analysis
- 3. Import Market Analysis (Value & Volume)
- 4. Export Market Analysis (Value & Volume)
- 5. Price Trend Analysis
Agrochemical Industry in South Africa Segmentation By Geography
-
1. North America
- 1.1. United States
- 1.2. Canada
- 1.3. Mexico
-
2. South America
- 2.1. Brazil
- 2.2. Argentina
- 2.3. Rest of South America
-
3. Europe
- 3.1. United Kingdom
- 3.2. Germany
- 3.3. France
- 3.4. Italy
- 3.5. Spain
- 3.6. Russia
- 3.7. Benelux
- 3.8. Nordics
- 3.9. Rest of Europe
-
4. Middle East & Africa
- 4.1. Turkey
- 4.2. Israel
- 4.3. GCC
- 4.4. North Africa
- 4.5. South Africa
- 4.6. Rest of Middle East & Africa
-
5. Asia Pacific
- 5.1. China
- 5.2. India
- 5.3. Japan
- 5.4. South Korea
- 5.5. ASEAN
- 5.6. Oceania
- 5.7. Rest of Asia Pacific
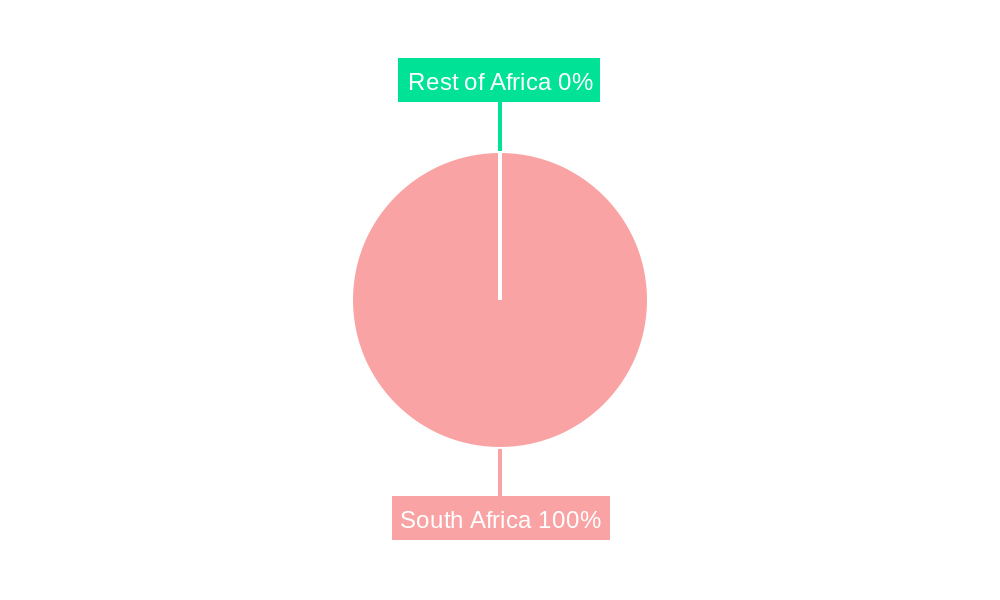
Agrochemical Industry in South Africa Regional Market Share
Geographic Coverage of Agrochemical Industry in South Africa
Agrochemical Industry in South Africa REPORT HIGHLIGHTS
| Aspects | Details |
|---|---|
| Study Period | 2020-2034 |
| Base Year | 2025 |
| Estimated Year | 2026 |
| Forecast Period | 2026-2034 |
| Historical Period | 2020-2025 |
| Growth Rate | CAGR of 3.90% from 2020-2034 |
| Segmentation |
|
Table of Contents
- 1. Introduction
- 1.1. Research Scope
- 1.2. Market Segmentation
- 1.3. Research Objective
- 1.4. Definitions and Assumptions
- 2. Executive Summary
- 2.1. Market Snapshot
- 3. Market Dynamics
- 3.1. Market Drivers
- 3.2. Market Restrains
- 3.3. Market Trends
- 3.4. Market Opportunities
- 4. Market Factor Analysis
- 4.1. Porters Five Forces
- 4.1.1. Bargaining Power of Suppliers
- 4.1.2. Bargaining Power of Buyers
- 4.1.3. Threat of New Entrants
- 4.1.4. Threat of Substitutes
- 4.1.5. Competitive Rivalry
- 4.2. PESTEL analysis
- 4.3. BCG Analysis
- 4.3.1. Stars (High Growth, High Market Share)
- 4.3.2. Cash Cows (Low Growth, High Market Share)
- 4.3.3. Question Mark (High Growth, Low Market Share)
- 4.3.4. Dogs (Low Growth, Low Market Share)
- 4.4. Ansoff Matrix Analysis
- 4.5. Supply Chain Analysis
- 4.6. Regulatory Landscape
- 4.7. Current Market Potential and Opportunity Assessment (TAM–SAM–SOM Framework)
- 4.8. MDP Analyst Note
- 4.1. Porters Five Forces
- 5. Market Analysis, Insights and Forecast 2021-2033
- 5.1. Market Analysis, Insights and Forecast - by Production Analysis
- 5.2. Market Analysis, Insights and Forecast - by Consumption Analysis
- 5.3. Market Analysis, Insights and Forecast - by Import Market Analysis (Value & Volume)
- 5.4. Market Analysis, Insights and Forecast - by Export Market Analysis (Value & Volume)
- 5.5. Market Analysis, Insights and Forecast - by Price Trend Analysis
- 5.6. Market Analysis, Insights and Forecast - by Region
- 5.6.1. North America
- 5.6.2. South America
- 5.6.3. Europe
- 5.6.4. Middle East & Africa
- 5.6.5. Asia Pacific
- 6. Global Agrochemical Industry in South Africa Analysis, Insights and Forecast, 2021-2033
- 6.1. Market Analysis, Insights and Forecast - by Production Analysis
- 6.2. Market Analysis, Insights and Forecast - by Consumption Analysis
- 6.3. Market Analysis, Insights and Forecast - by Import Market Analysis (Value & Volume)
- 6.4. Market Analysis, Insights and Forecast - by Export Market Analysis (Value & Volume)
- 6.5. Market Analysis, Insights and Forecast - by Price Trend Analysis
- 7. North America Agrochemical Industry in South Africa Analysis, Insights and Forecast, 2020-2032
- 7.1. Market Analysis, Insights and Forecast - by Production Analysis
- 7.2. Market Analysis, Insights and Forecast - by Consumption Analysis
- 7.3. Market Analysis, Insights and Forecast - by Import Market Analysis (Value & Volume)
- 7.4. Market Analysis, Insights and Forecast - by Export Market Analysis (Value & Volume)
- 7.5. Market Analysis, Insights and Forecast - by Price Trend Analysis
- 8. South America Agrochemical Industry in South Africa Analysis, Insights and Forecast, 2020-2032
- 8.1. Market Analysis, Insights and Forecast - by Production Analysis
- 8.2. Market Analysis, Insights and Forecast - by Consumption Analysis
- 8.3. Market Analysis, Insights and Forecast - by Import Market Analysis (Value & Volume)
- 8.4. Market Analysis, Insights and Forecast - by Export Market Analysis (Value & Volume)
- 8.5. Market Analysis, Insights and Forecast - by Price Trend Analysis
- 9. Europe Agrochemical Industry in South Africa Analysis, Insights and Forecast, 2020-2032
- 9.1. Market Analysis, Insights and Forecast - by Production Analysis
- 9.2. Market Analysis, Insights and Forecast - by Consumption Analysis
- 9.3. Market Analysis, Insights and Forecast - by Import Market Analysis (Value & Volume)
- 9.4. Market Analysis, Insights and Forecast - by Export Market Analysis (Value & Volume)
- 9.5. Market Analysis, Insights and Forecast - by Price Trend Analysis
- 10. Middle East & Africa Agrochemical Industry in South Africa Analysis, Insights and Forecast, 2020-2032
- 10.1. Market Analysis, Insights and Forecast - by Production Analysis
- 10.2. Market Analysis, Insights and Forecast - by Consumption Analysis
- 10.3. Market Analysis, Insights and Forecast - by Import Market Analysis (Value & Volume)
- 10.4. Market Analysis, Insights and Forecast - by Export Market Analysis (Value & Volume)
- 10.5. Market Analysis, Insights and Forecast - by Price Trend Analysis
- 11. Asia Pacific Agrochemical Industry in South Africa Analysis, Insights and Forecast, 2020-2032
- 11.1. Market Analysis, Insights and Forecast - by Production Analysis
- 11.2. Market Analysis, Insights and Forecast - by Consumption Analysis
- 11.3. Market Analysis, Insights and Forecast - by Import Market Analysis (Value & Volume)
- 11.4. Market Analysis, Insights and Forecast - by Export Market Analysis (Value & Volume)
- 11.5. Market Analysis, Insights and Forecast - by Price Trend Analysis
- 12. Competitive Analysis
- 12.1. Company Profiles
- 12.1.1 Archer-Daniels-Midland (ADM)
- 12.1.1.1. Company Overview
- 12.1.1.2. Products
- 12.1.1.3. Company Financials
- 12.1.1.4. SWOT Analysis
- 12.1.2 Cargill Incorporated
- 12.1.2.1. Company Overview
- 12.1.2.2. Products
- 12.1.2.3. Company Financials
- 12.1.2.4. SWOT Analysis
- 12.1.3 Sumitomo Chemical (Philagro SA)
- 12.1.3.1. Company Overview
- 12.1.3.2. Products
- 12.1.3.3. Company Financials
- 12.1.3.4. SWOT Analysis
- 12.1.4 Nufarm
- 12.1.4.1. Company Overview
- 12.1.4.2. Products
- 12.1.4.3. Company Financials
- 12.1.4.4. SWOT Analysis
- 12.1.5 ICL Group Ltd
- 12.1.5.1. Company Overview
- 12.1.5.2. Products
- 12.1.5.3. Company Financials
- 12.1.5.4. SWOT Analysis
- 12.1.6 UPL Limited
- 12.1.6.1. Company Overview
- 12.1.6.2. Products
- 12.1.6.3. Company Financials
- 12.1.6.4. SWOT Analysis
- 12.1.7 BASF SE
- 12.1.7.1. Company Overview
- 12.1.7.2. Products
- 12.1.7.3. Company Financials
- 12.1.7.4. SWOT Analysis
- 12.1.8 FMC Corporation
- 12.1.8.1. Company Overview
- 12.1.8.2. Products
- 12.1.8.3. Company Financials
- 12.1.8.4. SWOT Analysis
- 12.1.9 Sociedad Química y Minera de Chile (SQM)
- 12.1.9.1. Company Overview
- 12.1.9.2. Products
- 12.1.9.3. Company Financials
- 12.1.9.4. SWOT Analysis
- 12.1.10 Belaruskali
- 12.1.10.1. Company Overview
- 12.1.10.2. Products
- 12.1.10.3. Company Financials
- 12.1.10.4. SWOT Analysis
- 12.1.11 Sasol Limited
- 12.1.11.1. Company Overview
- 12.1.11.2. Products
- 12.1.11.3. Company Financials
- 12.1.11.4. SWOT Analysis
- 12.1.12 K+S AG
- 12.1.12.1. Company Overview
- 12.1.12.2. Products
- 12.1.12.3. Company Financials
- 12.1.12.4. SWOT Analysis
- 12.1.13 ADAMA Ltd
- 12.1.13.1. Company Overview
- 12.1.13.2. Products
- 12.1.13.3. Company Financials
- 12.1.13.4. SWOT Analysis
- 12.1.14 Uralkal
- 12.1.14.1. Company Overview
- 12.1.14.2. Products
- 12.1.14.3. Company Financials
- 12.1.14.4. SWOT Analysis
- 12.1.15 CF Industries Holdings
- 12.1.15.1. Company Overview
- 12.1.15.2. Products
- 12.1.15.3. Company Financials
- 12.1.15.4. SWOT Analysis
- 12.1.16 OCP Group
- 12.1.16.1. Company Overview
- 12.1.16.2. Products
- 12.1.16.3. Company Financials
- 12.1.16.4. SWOT Analysis
- 12.1.17 Land O' Lakes (Villa Crop Protection (Pty) Ltd
- 12.1.17.1. Company Overview
- 12.1.17.2. Products
- 12.1.17.3. Company Financials
- 12.1.17.4. SWOT Analysis
- 12.1.18 Yara International ASA
- 12.1.18.1. Company Overview
- 12.1.18.2. Products
- 12.1.18.3. Company Financials
- 12.1.18.4. SWOT Analysis
- 12.1.19 Syngenta AG
- 12.1.19.1. Company Overview
- 12.1.19.2. Products
- 12.1.19.3. Company Financials
- 12.1.19.4. SWOT Analysis
- 12.1.20 Nutrien Ltd
- 12.1.20.1. Company Overview
- 12.1.20.2. Products
- 12.1.20.3. Company Financials
- 12.1.20.4. SWOT Analysis
- 12.1.21 Corteva Agriscience
- 12.1.21.1. Company Overview
- 12.1.21.2. Products
- 12.1.21.3. Company Financials
- 12.1.21.4. SWOT Analysis
- 12.1.22 Bayer CropScience AG
- 12.1.22.1. Company Overview
- 12.1.22.2. Products
- 12.1.22.3. Company Financials
- 12.1.22.4. SWOT Analysis
- 12.1.1 Archer-Daniels-Midland (ADM)
- 12.2. Market Entropy
- 12.2.1 Company's Key Areas Served
- 12.2.2 Recent Developments
- 12.3. Company Market Share Analysis 2025
- 12.3.1 Top 5 Companies Market Share Analysis
- 12.3.2 Top 3 Companies Market Share Analysis
- 12.4. List of Potential Customers
- 13. Research Methodology
List of Figures
- Figure 1: Global Agrochemical Industry in South Africa Revenue Breakdown (Million, %) by Region 2025 & 2033
- Figure 2: North America Agrochemical Industry in South Africa Revenue (Million), by Production Analysis 2025 & 2033
- Figure 3: North America Agrochemical Industry in South Africa Revenue Share (%), by Production Analysis 2025 & 2033
- Figure 4: North America Agrochemical Industry in South Africa Revenue (Million), by Consumption Analysis 2025 & 2033
- Figure 5: North America Agrochemical Industry in South Africa Revenue Share (%), by Consumption Analysis 2025 & 2033
- Figure 6: North America Agrochemical Industry in South Africa Revenue (Million), by Import Market Analysis (Value & Volume) 2025 & 2033
- Figure 7: North America Agrochemical Industry in South Africa Revenue Share (%), by Import Market Analysis (Value & Volume) 2025 & 2033
- Figure 8: North America Agrochemical Industry in South Africa Revenue (Million), by Export Market Analysis (Value & Volume) 2025 & 2033
- Figure 9: North America Agrochemical Industry in South Africa Revenue Share (%), by Export Market Analysis (Value & Volume) 2025 & 2033
- Figure 10: North America Agrochemical Industry in South Africa Revenue (Million), by Price Trend Analysis 2025 & 2033
- Figure 11: North America Agrochemical Industry in South Africa Revenue Share (%), by Price Trend Analysis 2025 & 2033
- Figure 12: North America Agrochemical Industry in South Africa Revenue (Million), by Country 2025 & 2033
- Figure 13: North America Agrochemical Industry in South Africa Revenue Share (%), by Country 2025 & 2033
- Figure 14: South America Agrochemical Industry in South Africa Revenue (Million), by Production Analysis 2025 & 2033
- Figure 15: South America Agrochemical Industry in South Africa Revenue Share (%), by Production Analysis 2025 & 2033
- Figure 16: South America Agrochemical Industry in South Africa Revenue (Million), by Consumption Analysis 2025 & 2033
- Figure 17: South America Agrochemical Industry in South Africa Revenue Share (%), by Consumption Analysis 2025 & 2033
- Figure 18: South America Agrochemical Industry in South Africa Revenue (Million), by Import Market Analysis (Value & Volume) 2025 & 2033
- Figure 19: South America Agrochemical Industry in South Africa Revenue Share (%), by Import Market Analysis (Value & Volume) 2025 & 2033
- Figure 20: South America Agrochemical Industry in South Africa Revenue (Million), by Export Market Analysis (Value & Volume) 2025 & 2033
- Figure 21: South America Agrochemical Industry in South Africa Revenue Share (%), by Export Market Analysis (Value & Volume) 2025 & 2033
- Figure 22: South America Agrochemical Industry in South Africa Revenue (Million), by Price Trend Analysis 2025 & 2033
- Figure 23: South America Agrochemical Industry in South Africa Revenue Share (%), by Price Trend Analysis 2025 & 2033
- Figure 24: South America Agrochemical Industry in South Africa Revenue (Million), by Country 2025 & 2033
- Figure 25: South America Agrochemical Industry in South Africa Revenue Share (%), by Country 2025 & 2033
- Figure 26: Europe Agrochemical Industry in South Africa Revenue (Million), by Production Analysis 2025 & 2033
- Figure 27: Europe Agrochemical Industry in South Africa Revenue Share (%), by Production Analysis 2025 & 2033
- Figure 28: Europe Agrochemical Industry in South Africa Revenue (Million), by Consumption Analysis 2025 & 2033
- Figure 29: Europe Agrochemical Industry in South Africa Revenue Share (%), by Consumption Analysis 2025 & 2033
- Figure 30: Europe Agrochemical Industry in South Africa Revenue (Million), by Import Market Analysis (Value & Volume) 2025 & 2033
- Figure 31: Europe Agrochemical Industry in South Africa Revenue Share (%), by Import Market Analysis (Value & Volume) 2025 & 2033
- Figure 32: Europe Agrochemical Industry in South Africa Revenue (Million), by Export Market Analysis (Value & Volume) 2025 & 2033
- Figure 33: Europe Agrochemical Industry in South Africa Revenue Share (%), by Export Market Analysis (Value & Volume) 2025 & 2033
- Figure 34: Europe Agrochemical Industry in South Africa Revenue (Million), by Price Trend Analysis 2025 & 2033
- Figure 35: Europe Agrochemical Industry in South Africa Revenue Share (%), by Price Trend Analysis 2025 & 2033
- Figure 36: Europe Agrochemical Industry in South Africa Revenue (Million), by Country 2025 & 2033
- Figure 37: Europe Agrochemical Industry in South Africa Revenue Share (%), by Country 2025 & 2033
- Figure 38: Middle East & Africa Agrochemical Industry in South Africa Revenue (Million), by Production Analysis 2025 & 2033
- Figure 39: Middle East & Africa Agrochemical Industry in South Africa Revenue Share (%), by Production Analysis 2025 & 2033
- Figure 40: Middle East & Africa Agrochemical Industry in South Africa Revenue (Million), by Consumption Analysis 2025 & 2033
- Figure 41: Middle East & Africa Agrochemical Industry in South Africa Revenue Share (%), by Consumption Analysis 2025 & 2033
- Figure 42: Middle East & Africa Agrochemical Industry in South Africa Revenue (Million), by Import Market Analysis (Value & Volume) 2025 & 2033
- Figure 43: Middle East & Africa Agrochemical Industry in South Africa Revenue Share (%), by Import Market Analysis (Value & Volume) 2025 & 2033
- Figure 44: Middle East & Africa Agrochemical Industry in South Africa Revenue (Million), by Export Market Analysis (Value & Volume) 2025 & 2033
- Figure 45: Middle East & Africa Agrochemical Industry in South Africa Revenue Share (%), by Export Market Analysis (Value & Volume) 2025 & 2033
- Figure 46: Middle East & Africa Agrochemical Industry in South Africa Revenue (Million), by Price Trend Analysis 2025 & 2033
- Figure 47: Middle East & Africa Agrochemical Industry in South Africa Revenue Share (%), by Price Trend Analysis 2025 & 2033
- Figure 48: Middle East & Africa Agrochemical Industry in South Africa Revenue (Million), by Country 2025 & 2033
- Figure 49: Middle East & Africa Agrochemical Industry in South Africa Revenue Share (%), by Country 2025 & 2033
- Figure 50: Asia Pacific Agrochemical Industry in South Africa Revenue (Million), by Production Analysis 2025 & 2033
- Figure 51: Asia Pacific Agrochemical Industry in South Africa Revenue Share (%), by Production Analysis 2025 & 2033
- Figure 52: Asia Pacific Agrochemical Industry in South Africa Revenue (Million), by Consumption Analysis 2025 & 2033
- Figure 53: Asia Pacific Agrochemical Industry in South Africa Revenue Share (%), by Consumption Analysis 2025 & 2033
- Figure 54: Asia Pacific Agrochemical Industry in South Africa Revenue (Million), by Import Market Analysis (Value & Volume) 2025 & 2033
- Figure 55: Asia Pacific Agrochemical Industry in South Africa Revenue Share (%), by Import Market Analysis (Value & Volume) 2025 & 2033
- Figure 56: Asia Pacific Agrochemical Industry in South Africa Revenue (Million), by Export Market Analysis (Value & Volume) 2025 & 2033
- Figure 57: Asia Pacific Agrochemical Industry in South Africa Revenue Share (%), by Export Market Analysis (Value & Volume) 2025 & 2033
- Figure 58: Asia Pacific Agrochemical Industry in South Africa Revenue (Million), by Price Trend Analysis 2025 & 2033
- Figure 59: Asia Pacific Agrochemical Industry in South Africa Revenue Share (%), by Price Trend Analysis 2025 & 2033
- Figure 60: Asia Pacific Agrochemical Industry in South Africa Revenue (Million), by Country 2025 & 2033
- Figure 61: Asia Pacific Agrochemical Industry in South Africa Revenue Share (%), by Country 2025 & 2033
List of Tables
- Table 1: Global Agrochemical Industry in South Africa Revenue Million Forecast, by Production Analysis 2020 & 2033
- Table 2: Global Agrochemical Industry in South Africa Revenue Million Forecast, by Consumption Analysis 2020 & 2033
- Table 3: Global Agrochemical Industry in South Africa Revenue Million Forecast, by Import Market Analysis (Value & Volume) 2020 & 2033
- Table 4: Global Agrochemical Industry in South Africa Revenue Million Forecast, by Export Market Analysis (Value & Volume) 2020 & 2033
- Table 5: Global Agrochemical Industry in South Africa Revenue Million Forecast, by Price Trend Analysis 2020 & 2033
- Table 6: Global Agrochemical Industry in South Africa Revenue Million Forecast, by Region 2020 & 2033
- Table 7: Global Agrochemical Industry in South Africa Revenue Million Forecast, by Production Analysis 2020 & 2033
- Table 8: Global Agrochemical Industry in South Africa Revenue Million Forecast, by Consumption Analysis 2020 & 2033
- Table 9: Global Agrochemical Industry in South Africa Revenue Million Forecast, by Import Market Analysis (Value & Volume) 2020 & 2033
- Table 10: Global Agrochemical Industry in South Africa Revenue Million Forecast, by Export Market Analysis (Value & Volume) 2020 & 2033
- Table 11: Global Agrochemical Industry in South Africa Revenue Million Forecast, by Price Trend Analysis 2020 & 2033
- Table 12: Global Agrochemical Industry in South Africa Revenue Million Forecast, by Country 2020 & 2033
- Table 13: United States Agrochemical Industry in South Africa Revenue (Million) Forecast, by Application 2020 & 2033
- Table 14: Canada Agrochemical Industry in South Africa Revenue (Million) Forecast, by Application 2020 & 2033
- Table 15: Mexico Agrochemical Industry in South Africa Revenue (Million) Forecast, by Application 2020 & 2033
- Table 16: Global Agrochemical Industry in South Africa Revenue Million Forecast, by Production Analysis 2020 & 2033
- Table 17: Global Agrochemical Industry in South Africa Revenue Million Forecast, by Consumption Analysis 2020 & 2033
- Table 18: Global Agrochemical Industry in South Africa Revenue Million Forecast, by Import Market Analysis (Value & Volume) 2020 & 2033
- Table 19: Global Agrochemical Industry in South Africa Revenue Million Forecast, by Export Market Analysis (Value & Volume) 2020 & 2033
- Table 20: Global Agrochemical Industry in South Africa Revenue Million Forecast, by Price Trend Analysis 2020 & 2033
- Table 21: Global Agrochemical Industry in South Africa Revenue Million Forecast, by Country 2020 & 2033
- Table 22: Brazil Agrochemical Industry in South Africa Revenue (Million) Forecast, by Application 2020 & 2033
- Table 23: Argentina Agrochemical Industry in South Africa Revenue (Million) Forecast, by Application 2020 & 2033
- Table 24: Rest of South America Agrochemical Industry in South Africa Revenue (Million) Forecast, by Application 2020 & 2033
- Table 25: Global Agrochemical Industry in South Africa Revenue Million Forecast, by Production Analysis 2020 & 2033
- Table 26: Global Agrochemical Industry in South Africa Revenue Million Forecast, by Consumption Analysis 2020 & 2033
- Table 27: Global Agrochemical Industry in South Africa Revenue Million Forecast, by Import Market Analysis (Value & Volume) 2020 & 2033
- Table 28: Global Agrochemical Industry in South Africa Revenue Million Forecast, by Export Market Analysis (Value & Volume) 2020 & 2033
- Table 29: Global Agrochemical Industry in South Africa Revenue Million Forecast, by Price Trend Analysis 2020 & 2033
- Table 30: Global Agrochemical Industry in South Africa Revenue Million Forecast, by Country 2020 & 2033
- Table 31: United Kingdom Agrochemical Industry in South Africa Revenue (Million) Forecast, by Application 2020 & 2033
- Table 32: Germany Agrochemical Industry in South Africa Revenue (Million) Forecast, by Application 2020 & 2033
- Table 33: France Agrochemical Industry in South Africa Revenue (Million) Forecast, by Application 2020 & 2033
- Table 34: Italy Agrochemical Industry in South Africa Revenue (Million) Forecast, by Application 2020 & 2033
- Table 35: Spain Agrochemical Industry in South Africa Revenue (Million) Forecast, by Application 2020 & 2033
- Table 36: Russia Agrochemical Industry in South Africa Revenue (Million) Forecast, by Application 2020 & 2033
- Table 37: Benelux Agrochemical Industry in South Africa Revenue (Million) Forecast, by Application 2020 & 2033
- Table 38: Nordics Agrochemical Industry in South Africa Revenue (Million) Forecast, by Application 2020 & 2033
- Table 39: Rest of Europe Agrochemical Industry in South Africa Revenue (Million) Forecast, by Application 2020 & 2033
- Table 40: Global Agrochemical Industry in South Africa Revenue Million Forecast, by Production Analysis 2020 & 2033
- Table 41: Global Agrochemical Industry in South Africa Revenue Million Forecast, by Consumption Analysis 2020 & 2033
- Table 42: Global Agrochemical Industry in South Africa Revenue Million Forecast, by Import Market Analysis (Value & Volume) 2020 & 2033
- Table 43: Global Agrochemical Industry in South Africa Revenue Million Forecast, by Export Market Analysis (Value & Volume) 2020 & 2033
- Table 44: Global Agrochemical Industry in South Africa Revenue Million Forecast, by Price Trend Analysis 2020 & 2033
- Table 45: Global Agrochemical Industry in South Africa Revenue Million Forecast, by Country 2020 & 2033
- Table 46: Turkey Agrochemical Industry in South Africa Revenue (Million) Forecast, by Application 2020 & 2033
- Table 47: Israel Agrochemical Industry in South Africa Revenue (Million) Forecast, by Application 2020 & 2033
- Table 48: GCC Agrochemical Industry in South Africa Revenue (Million) Forecast, by Application 2020 & 2033
- Table 49: North Africa Agrochemical Industry in South Africa Revenue (Million) Forecast, by Application 2020 & 2033
- Table 50: South Africa Agrochemical Industry in South Africa Revenue (Million) Forecast, by Application 2020 & 2033
- Table 51: Rest of Middle East & Africa Agrochemical Industry in South Africa Revenue (Million) Forecast, by Application 2020 & 2033
- Table 52: Global Agrochemical Industry in South Africa Revenue Million Forecast, by Production Analysis 2020 & 2033
- Table 53: Global Agrochemical Industry in South Africa Revenue Million Forecast, by Consumption Analysis 2020 & 2033
- Table 54: Global Agrochemical Industry in South Africa Revenue Million Forecast, by Import Market Analysis (Value & Volume) 2020 & 2033
- Table 55: Global Agrochemical Industry in South Africa Revenue Million Forecast, by Export Market Analysis (Value & Volume) 2020 & 2033
- Table 56: Global Agrochemical Industry in South Africa Revenue Million Forecast, by Price Trend Analysis 2020 & 2033
- Table 57: Global Agrochemical Industry in South Africa Revenue Million Forecast, by Country 2020 & 2033
- Table 58: China Agrochemical Industry in South Africa Revenue (Million) Forecast, by Application 2020 & 2033
- Table 59: India Agrochemical Industry in South Africa Revenue (Million) Forecast, by Application 2020 & 2033
- Table 60: Japan Agrochemical Industry in South Africa Revenue (Million) Forecast, by Application 2020 & 2033
- Table 61: South Korea Agrochemical Industry in South Africa Revenue (Million) Forecast, by Application 2020 & 2033
- Table 62: ASEAN Agrochemical Industry in South Africa Revenue (Million) Forecast, by Application 2020 & 2033
- Table 63: Oceania Agrochemical Industry in South Africa Revenue (Million) Forecast, by Application 2020 & 2033
- Table 64: Rest of Asia Pacific Agrochemical Industry in South Africa Revenue (Million) Forecast, by Application 2020 & 2033
Frequently Asked Questions
1. What is the projected Compound Annual Growth Rate (CAGR) of the Agrochemical Industry in South Africa?
The projected CAGR is approximately 3.90%.
2. Which companies are prominent players in the Agrochemical Industry in South Africa?
Key companies in the market include Archer-Daniels-Midland (ADM), Cargill Incorporated, Sumitomo Chemical (Philagro SA), Nufarm, ICL Group Ltd, UPL Limited, BASF SE, FMC Corporation, Sociedad Química y Minera de Chile (SQM), Belaruskali, Sasol Limited, K+S AG, ADAMA Ltd, Uralkal, CF Industries Holdings, OCP Group, Land O' Lakes (Villa Crop Protection (Pty) Ltd, Yara International ASA, Syngenta AG, Nutrien Ltd, Corteva Agriscience, Bayer CropScience AG.
3. What are the main segments of the Agrochemical Industry in South Africa?
The market segments include Production Analysis, Consumption Analysis, Import Market Analysis (Value & Volume), Export Market Analysis (Value & Volume), Price Trend Analysis.
4. Can you provide details about the market size?
The market size is estimated to be USD 1.27 Million as of 2022.
5. What are some drivers contributing to market growth?
Adoption of Organic and Eco-friendly Farming Practices; Declining Area of Arable Land and Rising Food Security Concerns.
6. What are the notable trends driving market growth?
Increasing Adoption of Bio-based Agrochemicals.
7. Are there any restraints impacting market growth?
High Demand for Conventional and Synthetic Products; Lack of Awareness and Other Factors Limiting the Adoption of Agricultural Inoculants.
8. Can you provide examples of recent developments in the market?
N/A
9. What pricing options are available for accessing the report?
Pricing options include single-user, multi-user, and enterprise licenses priced at USD 3800, USD 4500, and USD 5800 respectively.
10. Is the market size provided in terms of value or volume?
The market size is provided in terms of value, measured in Million.
11. Are there any specific market keywords associated with the report?
Yes, the market keyword associated with the report is "Agrochemical Industry in South Africa," which aids in identifying and referencing the specific market segment covered.
12. How do I determine which pricing option suits my needs best?
The pricing options vary based on user requirements and access needs. Individual users may opt for single-user licenses, while businesses requiring broader access may choose multi-user or enterprise licenses for cost-effective access to the report.
13. Are there any additional resources or data provided in the Agrochemical Industry in South Africa report?
While the report offers comprehensive insights, it's advisable to review the specific contents or supplementary materials provided to ascertain if additional resources or data are available.
14. How can I stay updated on further developments or reports in the Agrochemical Industry in South Africa?
To stay informed about further developments, trends, and reports in the Agrochemical Industry in South Africa, consider subscribing to industry newsletters, following relevant companies and organizations, or regularly checking reputable industry news sources and publications.
Methodology
Step 1 - Identification of Relevant Samples Size from Population Database


Step 2 - Approaches for Defining Global Market Size (Value, Volume* & Price*)

Note*: In applicable scenarios
Step 3 - Data Sources
Primary Research
- Web Analytics
- Survey Reports
- Research Institute
- Latest Research Reports
- Opinion Leaders
Secondary Research
- Annual Reports
- White Paper
- Latest Press Release
- Industry Association
- Paid Database
- Investor Presentations

Step 4 - Data Triangulation
Involves using different sources of information in order to increase the validity of a study
These sources are likely to be stakeholders in a program - participants, other researchers, program staff, other community members, and so on.
Then we put all data in single framework & apply various statistical tools to find out the dynamic on the market.
During the analysis stage, feedback from the stakeholder groups would be compared to determine areas of agreement as well as areas of divergence