

Key Insights
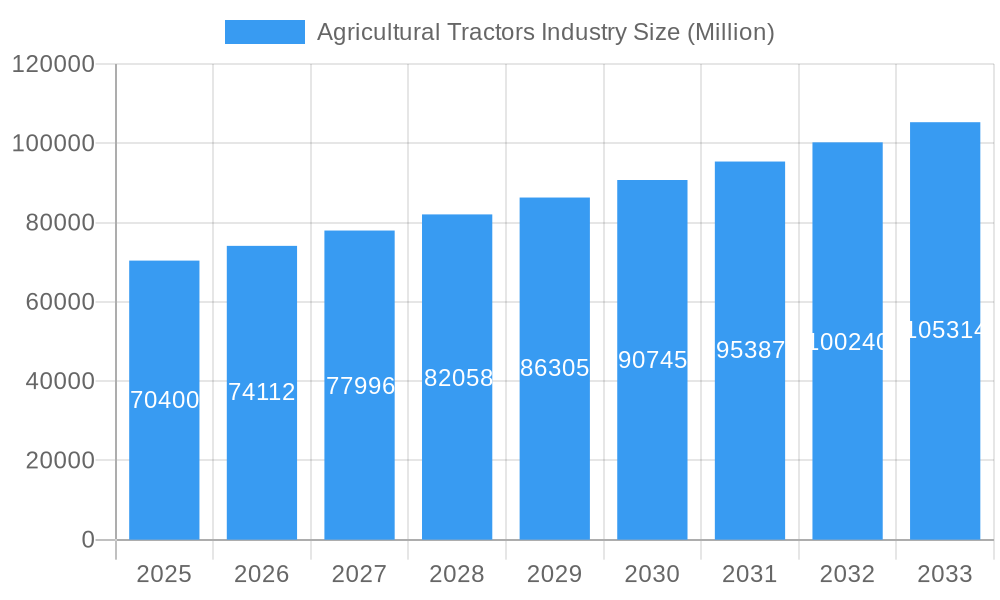
The global agricultural tractors market, valued at $70.40 billion in 2025, is projected to experience robust growth, driven by a Compound Annual Growth Rate (CAGR) of 5.20% from 2025 to 2033. This expansion is fueled by several key factors. Firstly, the increasing global population necessitates higher agricultural output, creating a strong demand for efficient and technologically advanced tractors. Secondly, the ongoing trend towards mechanization in agriculture, particularly in developing economies, is significantly boosting market growth. Farmers are increasingly adopting tractors to improve productivity, reduce labor costs, and enhance operational efficiency. Technological advancements, such as the integration of precision farming technologies (GPS, sensors, auto-steering) and the development of fuel-efficient engines, are further driving market expansion. Furthermore, government initiatives promoting agricultural modernization and providing subsidies for tractor purchases contribute to market growth, particularly in regions like Asia Pacific and South America. However, factors such as high initial investment costs, volatile fuel prices, and the impact of weather patterns on agricultural yields could pose challenges to the market's growth trajectory. The market is segmented by horsepower (ranging from less than 40 HP to greater than 350 HP) and type (orchard tractors, row-crop tractors, and others), reflecting the diverse needs of various agricultural operations. Key players like Deere & Company, Kubota Corporation, and Mahindra & Mahindra Ltd. are actively engaged in innovation and expansion to capitalize on these market opportunities. The regional market is diverse; North America and Europe currently hold significant market share, but the Asia Pacific region is poised for significant growth due to its expanding agricultural sector and increasing mechanization.
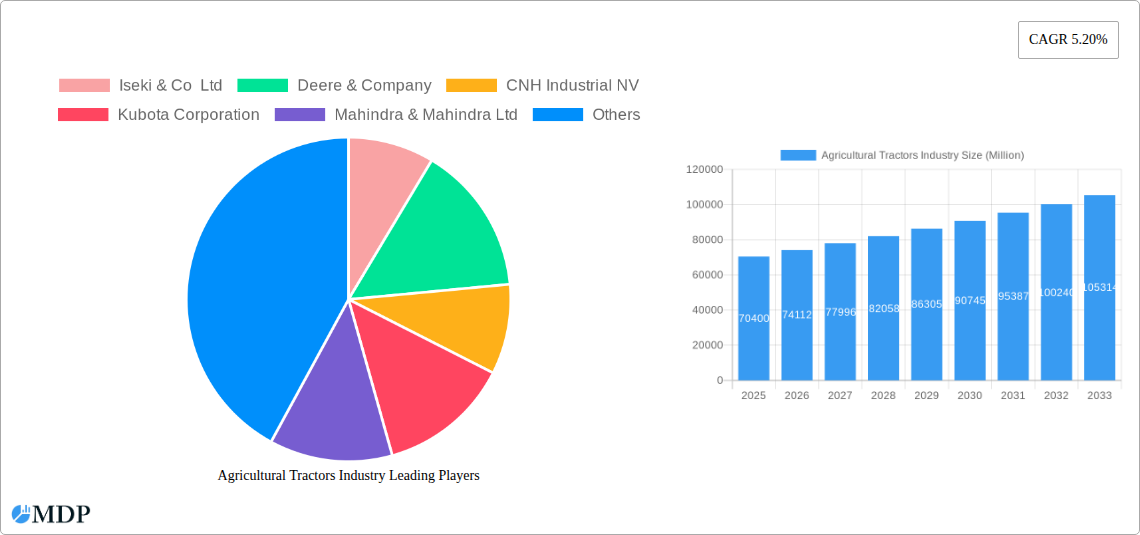
Agricultural Tractors Industry Market Size (In Billion)
The agricultural tractor market's segmentation offers diverse investment and growth opportunities. The higher horsepower segments (100 HP and above) are likely to witness significant growth driven by large-scale farming operations demanding greater power and efficiency. The demand for specialized tractors, such as orchard tractors, will also experience growth as farming techniques become more precise and specialized. Competition among manufacturers is intense, with leading companies focusing on technological innovation, strategic partnerships, and geographic expansion to maintain a competitive edge. Future growth will be shaped by factors such as the adoption of autonomous tractors, advancements in data analytics for precision farming, and the increasing focus on sustainable agricultural practices. The market is expected to witness further consolidation as larger companies acquire smaller players to expand their market reach and product portfolio. The continuous evolution of agricultural technology and shifting global agricultural practices will significantly influence the market's dynamics over the forecast period.
Agricultural Tractors Industry Company Market Share
Agricultural Tractors Industry Market Report: 2019-2033
Unlocking Growth in the Thriving Agricultural Tractors Market: A Comprehensive Analysis
This comprehensive report provides an in-depth analysis of the global agricultural tractors industry, offering invaluable insights for stakeholders across the value chain. Covering the period 2019-2033, with a focus on 2025, this report meticulously examines market dynamics, trends, leading players, and future opportunities. Expect detailed segmentation by horsepower (less than 40 HP, 40-99 HP, 100-150 HP, 151-200 HP, 201-270 HP, 271-350 HP, >350 HP) and tractor type (Orchard, Row-crop, Other), providing a granular understanding of this vital sector. The report also features key companies like Deere & Company, CNH Industrial NV, Kubota Corporation, Mahindra & Mahindra Ltd, and more. With a projected market value reaching xx Million by 2033, this report is essential for strategic decision-making.
Agricultural Tractors Industry Market Dynamics & Concentration
The agricultural tractors market is characterized by a moderately concentrated landscape, with a few major players holding significant market share. Innovation is a key driver, with companies continuously investing in advanced technologies like precision farming tools and automation to enhance efficiency and productivity. Stringent regulatory frameworks governing emissions and safety standards influence product development and market access. Substitute products, such as smaller machinery or manual labor, exist but are often less efficient for large-scale farming. End-user trends favor increased mechanization, driven by labor shortages and the need for higher yields. Mergers and acquisitions (M&A) activity is relatively frequent, as larger players seek to expand their market reach and product portfolios. Over the historical period (2019-2024), the number of M&A deals averaged approximately xx per year, with a combined deal value of approximately xx Million. Market share for the top 5 players is estimated at xx% in 2025.
- Market Concentration: Moderately concentrated, with top 5 players holding xx% market share (2025).
- Innovation Drivers: Precision farming technologies, automation, emission reduction solutions.
- Regulatory Frameworks: Emissions standards, safety regulations, and import/export policies.
- Product Substitutes: Smaller machinery, manual labor.
- End-User Trends: Growing demand for mechanization driven by labor scarcity and yield improvement needs.
- M&A Activity: Average xx deals annually (2019-2024) with a total value of approximately xx Million.
Agricultural Tractors Industry Industry Trends & Analysis
The agricultural tractors market exhibits a robust growth trajectory, driven primarily by the increasing global demand for food and feed, coupled with a rising adoption of mechanization in farming practices. Technological advancements, such as GPS-guided tractors and autonomous systems, are disrupting traditional farming methods, boosting productivity and efficiency. Consumer preferences are shifting towards fuel-efficient, technologically advanced tractors that require less maintenance. Intense competition among major players fuels innovation and price optimization, benefiting farmers. The industry is witnessing a steady shift toward larger and more powerful tractors, especially in developed regions. The Compound Annual Growth Rate (CAGR) for the forecast period (2025-2033) is projected to be xx%, with a market penetration rate of xx% by 2033 in key markets. This reflects the industry's ability to adapt to evolving agricultural needs and technological breakthroughs.
Leading Markets & Segments in Agricultural Tractors Industry
The North American market currently holds a dominant position in the global agricultural tractor industry, primarily due to its extensive agricultural land and high levels of mechanization. Within the horsepower segments, the 40-99 HP category exhibits the highest market share, catering to the majority of small-to-medium farms. The row-crop tractor segment is dominant in terms of tractor type, reflecting the prevalence of row-crop farming practices.
Key Drivers:
- North America: Large agricultural land area, high level of mechanization, advanced farming practices.
- 40-99 HP Segment: Suitable for a wide range of farming operations, cost-effective for medium-sized farms.
- Row-crop Tractors: High demand due to widespread adoption in row-crop farming practices.
Dominance Analysis: North America’s large agricultural sector and advanced farming techniques lead to its dominance. The 40-99 HP segment benefits from its broad applicability. The high demand for row-crop tractors reflects the prevalence of row-crop farming globally.
Agricultural Tractors Industry Product Developments
Recent product innovations focus on enhancing efficiency, precision, and sustainability. This includes advancements in autonomous driving, precision seeding and spraying technologies, and the integration of data analytics for optimized farm management. These developments target the growing needs for increased yields, reduced operating costs, and improved environmental sustainability. The market fit is strong due to the increased demand for technological advancements in farming.
Key Drivers of Agricultural Tractors Industry Growth
Technological advancements in automation, precision farming, and connectivity are key drivers, offering higher efficiency and lower operating costs. Economic factors like rising food demand and increasing disposable incomes in emerging markets fuel tractor adoption. Supportive government policies promoting agricultural mechanization also contribute to market growth. For example, subsidies for tractor purchases in developing nations stimulate industry expansion.
Challenges in the Agricultural Tractors Industry Market
Fluctuations in commodity prices directly impact farmer purchasing power, affecting tractor demand. Supply chain disruptions, particularly related to crucial components like electronics and engines, pose challenges to production and delivery. Intense competition from both established and emerging players requires continuous innovation and cost management. The global chip shortage during 2021-2022 resulted in a xx% decrease in production for some manufacturers.
Emerging Opportunities in Agricultural Tractors Industry
The integration of artificial intelligence (AI) and machine learning (ML) into tractor systems offers significant opportunities for precision agriculture and automation. Strategic partnerships between tractor manufacturers and agricultural technology companies are driving innovation and market expansion. Expanding into emerging markets with growing agricultural sectors presents significant growth potential.
Leading Players in the Agricultural Tractors Industry Sector
Key Milestones in Agricultural Tractors Industry Industry
- June 2022: Solis Yanmar launched three new <30 HP tractor models for the Turkish market, exported from India.
- July 2021: New Holland North America launched the T7 Heavy-duty Tractor with PLM Intelligence.
- November 2022: VST Tillers Tractors Ltd and ZETOR TRACTORS unveiled two new 45 HP and 50 HP tractors at CII Agro Tech India 2022.
Strategic Outlook for Agricultural Tractors Industry Market
The future of the agricultural tractors market is bright, driven by continued technological advancements, increased demand for food security, and the adoption of sustainable farming practices. Strategic partnerships, expansion into emerging markets, and the development of innovative solutions are key factors for long-term growth. The industry is poised for significant expansion, particularly in regions with expanding agricultural sectors and growing adoption of advanced farming technologies.
Agricultural Tractors Industry Segmentation
- 1. Production Analysis
- 2. Consumption Analysis
- 3. Import Market Analysis (Value & Volume)
- 4. Export Market Analysis (Value & Volume)
- 5. Price Trend Analysis
Agricultural Tractors Industry Segmentation By Geography
-
1. North America
- 1.1. United States
- 1.2. Canada
- 1.3. Mexico
-
2. South America
- 2.1. Brazil
- 2.2. Argentina
- 2.3. Rest of South America
-
3. Europe
- 3.1. United Kingdom
- 3.2. Germany
- 3.3. France
- 3.4. Italy
- 3.5. Spain
- 3.6. Russia
- 3.7. Benelux
- 3.8. Nordics
- 3.9. Rest of Europe
-
4. Middle East & Africa
- 4.1. Turkey
- 4.2. Israel
- 4.3. GCC
- 4.4. North Africa
- 4.5. South Africa
- 4.6. Rest of Middle East & Africa
-
5. Asia Pacific
- 5.1. China
- 5.2. India
- 5.3. Japan
- 5.4. South Korea
- 5.5. ASEAN
- 5.6. Oceania
- 5.7. Rest of Asia Pacific
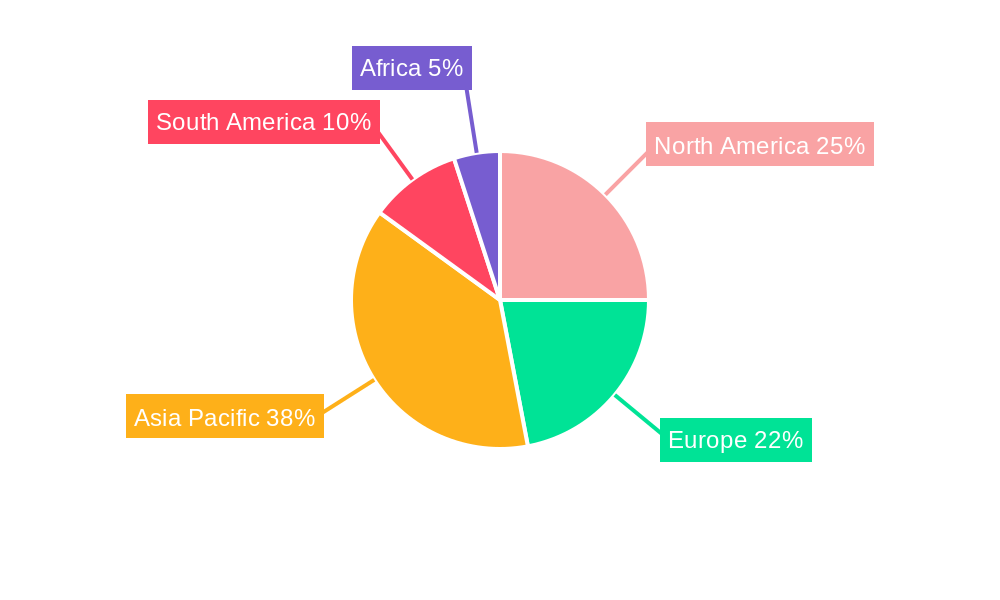
Agricultural Tractors Industry Regional Market Share
Geographic Coverage of Agricultural Tractors Industry
Agricultural Tractors Industry REPORT HIGHLIGHTS
| Aspects | Details |
|---|---|
| Study Period | 2020-2034 |
| Base Year | 2025 |
| Estimated Year | 2026 |
| Forecast Period | 2026-2034 |
| Historical Period | 2020-2025 |
| Growth Rate | CAGR of 5.20% from 2020-2034 |
| Segmentation |
|
Table of Contents
- 1. Introduction
- 1.1. Research Scope
- 1.2. Market Segmentation
- 1.3. Research Objective
- 1.4. Definitions and Assumptions
- 2. Executive Summary
- 2.1. Market Snapshot
- 3. Market Dynamics
- 3.1. Market Drivers
- 3.2. Market Restrains
- 3.3. Market Trends
- 3.4. Market Opportunities
- 4. Market Factor Analysis
- 4.1. Porters Five Forces
- 4.1.1. Bargaining Power of Suppliers
- 4.1.2. Bargaining Power of Buyers
- 4.1.3. Threat of New Entrants
- 4.1.4. Threat of Substitutes
- 4.1.5. Competitive Rivalry
- 4.2. PESTEL analysis
- 4.3. BCG Analysis
- 4.3.1. Stars (High Growth, High Market Share)
- 4.3.2. Cash Cows (Low Growth, High Market Share)
- 4.3.3. Question Mark (High Growth, Low Market Share)
- 4.3.4. Dogs (Low Growth, Low Market Share)
- 4.4. Ansoff Matrix Analysis
- 4.5. Supply Chain Analysis
- 4.6. Regulatory Landscape
- 4.7. Current Market Potential and Opportunity Assessment (TAM–SAM–SOM Framework)
- 4.8. MDP Analyst Note
- 4.1. Porters Five Forces
- 5. Market Analysis, Insights and Forecast 2021-2033
- 5.1. Market Analysis, Insights and Forecast - by Production Analysis
- 5.2. Market Analysis, Insights and Forecast - by Consumption Analysis
- 5.3. Market Analysis, Insights and Forecast - by Import Market Analysis (Value & Volume)
- 5.4. Market Analysis, Insights and Forecast - by Export Market Analysis (Value & Volume)
- 5.5. Market Analysis, Insights and Forecast - by Price Trend Analysis
- 5.6. Market Analysis, Insights and Forecast - by Region
- 5.6.1. North America
- 5.6.2. South America
- 5.6.3. Europe
- 5.6.4. Middle East & Africa
- 5.6.5. Asia Pacific
- 6. Global Agricultural Tractors Industry Analysis, Insights and Forecast, 2021-2033
- 6.1. Market Analysis, Insights and Forecast - by Production Analysis
- 6.2. Market Analysis, Insights and Forecast - by Consumption Analysis
- 6.3. Market Analysis, Insights and Forecast - by Import Market Analysis (Value & Volume)
- 6.4. Market Analysis, Insights and Forecast - by Export Market Analysis (Value & Volume)
- 6.5. Market Analysis, Insights and Forecast - by Price Trend Analysis
- 7. North America Agricultural Tractors Industry Analysis, Insights and Forecast, 2020-2032
- 7.1. Market Analysis, Insights and Forecast - by Production Analysis
- 7.2. Market Analysis, Insights and Forecast - by Consumption Analysis
- 7.3. Market Analysis, Insights and Forecast - by Import Market Analysis (Value & Volume)
- 7.4. Market Analysis, Insights and Forecast - by Export Market Analysis (Value & Volume)
- 7.5. Market Analysis, Insights and Forecast - by Price Trend Analysis
- 8. South America Agricultural Tractors Industry Analysis, Insights and Forecast, 2020-2032
- 8.1. Market Analysis, Insights and Forecast - by Production Analysis
- 8.2. Market Analysis, Insights and Forecast - by Consumption Analysis
- 8.3. Market Analysis, Insights and Forecast - by Import Market Analysis (Value & Volume)
- 8.4. Market Analysis, Insights and Forecast - by Export Market Analysis (Value & Volume)
- 8.5. Market Analysis, Insights and Forecast - by Price Trend Analysis
- 9. Europe Agricultural Tractors Industry Analysis, Insights and Forecast, 2020-2032
- 9.1. Market Analysis, Insights and Forecast - by Production Analysis
- 9.2. Market Analysis, Insights and Forecast - by Consumption Analysis
- 9.3. Market Analysis, Insights and Forecast - by Import Market Analysis (Value & Volume)
- 9.4. Market Analysis, Insights and Forecast - by Export Market Analysis (Value & Volume)
- 9.5. Market Analysis, Insights and Forecast - by Price Trend Analysis
- 10. Middle East & Africa Agricultural Tractors Industry Analysis, Insights and Forecast, 2020-2032
- 10.1. Market Analysis, Insights and Forecast - by Production Analysis
- 10.2. Market Analysis, Insights and Forecast - by Consumption Analysis
- 10.3. Market Analysis, Insights and Forecast - by Import Market Analysis (Value & Volume)
- 10.4. Market Analysis, Insights and Forecast - by Export Market Analysis (Value & Volume)
- 10.5. Market Analysis, Insights and Forecast - by Price Trend Analysis
- 11. Asia Pacific Agricultural Tractors Industry Analysis, Insights and Forecast, 2020-2032
- 11.1. Market Analysis, Insights and Forecast - by Production Analysis
- 11.2. Market Analysis, Insights and Forecast - by Consumption Analysis
- 11.3. Market Analysis, Insights and Forecast - by Import Market Analysis (Value & Volume)
- 11.4. Market Analysis, Insights and Forecast - by Export Market Analysis (Value & Volume)
- 11.5. Market Analysis, Insights and Forecast - by Price Trend Analysis
- 12. Competitive Analysis
- 12.1. Company Profiles
- 12.1.1 Iseki & Co Ltd
- 12.1.1.1. Company Overview
- 12.1.1.2. Products
- 12.1.1.3. Company Financials
- 12.1.1.4. SWOT Analysis
- 12.1.2 Deere & Company
- 12.1.2.1. Company Overview
- 12.1.2.2. Products
- 12.1.2.3. Company Financials
- 12.1.2.4. SWOT Analysis
- 12.1.3 CNH Industrial NV
- 12.1.3.1. Company Overview
- 12.1.3.2. Products
- 12.1.3.3. Company Financials
- 12.1.3.4. SWOT Analysis
- 12.1.4 Kubota Corporation
- 12.1.4.1. Company Overview
- 12.1.4.2. Products
- 12.1.4.3. Company Financials
- 12.1.4.4. SWOT Analysis
- 12.1.5 Mahindra & Mahindra Ltd
- 12.1.5.1. Company Overview
- 12.1.5.2. Products
- 12.1.5.3. Company Financials
- 12.1.5.4. SWOT Analysis
- 12.1.6 Claas KGaA mbH
- 12.1.6.1. Company Overview
- 12.1.6.2. Products
- 12.1.6.3. Company Financials
- 12.1.6.4. SWOT Analysis
- 12.1.7 Tractors and Farm Equipment Ltd
- 12.1.7.1. Company Overview
- 12.1.7.2. Products
- 12.1.7.3. Company Financials
- 12.1.7.4. SWOT Analysis
- 12.1.8 AGCO Corporation (Massey Ferguson Limited)
- 12.1.8.1. Company Overview
- 12.1.8.2. Products
- 12.1.8.3. Company Financials
- 12.1.8.4. SWOT Analysis
- 12.1.9 Yanmar Holdings Co Lt
- 12.1.9.1. Company Overview
- 12.1.9.2. Products
- 12.1.9.3. Company Financials
- 12.1.9.4. SWOT Analysis
- 12.1.1 Iseki & Co Ltd
- 12.2. Market Entropy
- 12.2.1 Company's Key Areas Served
- 12.2.2 Recent Developments
- 12.3. Company Market Share Analysis 2025
- 12.3.1 Top 5 Companies Market Share Analysis
- 12.3.2 Top 3 Companies Market Share Analysis
- 12.4. List of Potential Customers
- 13. Research Methodology
List of Figures
- Figure 1: Global Agricultural Tractors Industry Revenue Breakdown (Million, %) by Region 2025 & 2033
- Figure 2: North America Agricultural Tractors Industry Revenue (Million), by Production Analysis 2025 & 2033
- Figure 3: North America Agricultural Tractors Industry Revenue Share (%), by Production Analysis 2025 & 2033
- Figure 4: North America Agricultural Tractors Industry Revenue (Million), by Consumption Analysis 2025 & 2033
- Figure 5: North America Agricultural Tractors Industry Revenue Share (%), by Consumption Analysis 2025 & 2033
- Figure 6: North America Agricultural Tractors Industry Revenue (Million), by Import Market Analysis (Value & Volume) 2025 & 2033
- Figure 7: North America Agricultural Tractors Industry Revenue Share (%), by Import Market Analysis (Value & Volume) 2025 & 2033
- Figure 8: North America Agricultural Tractors Industry Revenue (Million), by Export Market Analysis (Value & Volume) 2025 & 2033
- Figure 9: North America Agricultural Tractors Industry Revenue Share (%), by Export Market Analysis (Value & Volume) 2025 & 2033
- Figure 10: North America Agricultural Tractors Industry Revenue (Million), by Price Trend Analysis 2025 & 2033
- Figure 11: North America Agricultural Tractors Industry Revenue Share (%), by Price Trend Analysis 2025 & 2033
- Figure 12: North America Agricultural Tractors Industry Revenue (Million), by Country 2025 & 2033
- Figure 13: North America Agricultural Tractors Industry Revenue Share (%), by Country 2025 & 2033
- Figure 14: South America Agricultural Tractors Industry Revenue (Million), by Production Analysis 2025 & 2033
- Figure 15: South America Agricultural Tractors Industry Revenue Share (%), by Production Analysis 2025 & 2033
- Figure 16: South America Agricultural Tractors Industry Revenue (Million), by Consumption Analysis 2025 & 2033
- Figure 17: South America Agricultural Tractors Industry Revenue Share (%), by Consumption Analysis 2025 & 2033
- Figure 18: South America Agricultural Tractors Industry Revenue (Million), by Import Market Analysis (Value & Volume) 2025 & 2033
- Figure 19: South America Agricultural Tractors Industry Revenue Share (%), by Import Market Analysis (Value & Volume) 2025 & 2033
- Figure 20: South America Agricultural Tractors Industry Revenue (Million), by Export Market Analysis (Value & Volume) 2025 & 2033
- Figure 21: South America Agricultural Tractors Industry Revenue Share (%), by Export Market Analysis (Value & Volume) 2025 & 2033
- Figure 22: South America Agricultural Tractors Industry Revenue (Million), by Price Trend Analysis 2025 & 2033
- Figure 23: South America Agricultural Tractors Industry Revenue Share (%), by Price Trend Analysis 2025 & 2033
- Figure 24: South America Agricultural Tractors Industry Revenue (Million), by Country 2025 & 2033
- Figure 25: South America Agricultural Tractors Industry Revenue Share (%), by Country 2025 & 2033
- Figure 26: Europe Agricultural Tractors Industry Revenue (Million), by Production Analysis 2025 & 2033
- Figure 27: Europe Agricultural Tractors Industry Revenue Share (%), by Production Analysis 2025 & 2033
- Figure 28: Europe Agricultural Tractors Industry Revenue (Million), by Consumption Analysis 2025 & 2033
- Figure 29: Europe Agricultural Tractors Industry Revenue Share (%), by Consumption Analysis 2025 & 2033
- Figure 30: Europe Agricultural Tractors Industry Revenue (Million), by Import Market Analysis (Value & Volume) 2025 & 2033
- Figure 31: Europe Agricultural Tractors Industry Revenue Share (%), by Import Market Analysis (Value & Volume) 2025 & 2033
- Figure 32: Europe Agricultural Tractors Industry Revenue (Million), by Export Market Analysis (Value & Volume) 2025 & 2033
- Figure 33: Europe Agricultural Tractors Industry Revenue Share (%), by Export Market Analysis (Value & Volume) 2025 & 2033
- Figure 34: Europe Agricultural Tractors Industry Revenue (Million), by Price Trend Analysis 2025 & 2033
- Figure 35: Europe Agricultural Tractors Industry Revenue Share (%), by Price Trend Analysis 2025 & 2033
- Figure 36: Europe Agricultural Tractors Industry Revenue (Million), by Country 2025 & 2033
- Figure 37: Europe Agricultural Tractors Industry Revenue Share (%), by Country 2025 & 2033
- Figure 38: Middle East & Africa Agricultural Tractors Industry Revenue (Million), by Production Analysis 2025 & 2033
- Figure 39: Middle East & Africa Agricultural Tractors Industry Revenue Share (%), by Production Analysis 2025 & 2033
- Figure 40: Middle East & Africa Agricultural Tractors Industry Revenue (Million), by Consumption Analysis 2025 & 2033
- Figure 41: Middle East & Africa Agricultural Tractors Industry Revenue Share (%), by Consumption Analysis 2025 & 2033
- Figure 42: Middle East & Africa Agricultural Tractors Industry Revenue (Million), by Import Market Analysis (Value & Volume) 2025 & 2033
- Figure 43: Middle East & Africa Agricultural Tractors Industry Revenue Share (%), by Import Market Analysis (Value & Volume) 2025 & 2033
- Figure 44: Middle East & Africa Agricultural Tractors Industry Revenue (Million), by Export Market Analysis (Value & Volume) 2025 & 2033
- Figure 45: Middle East & Africa Agricultural Tractors Industry Revenue Share (%), by Export Market Analysis (Value & Volume) 2025 & 2033
- Figure 46: Middle East & Africa Agricultural Tractors Industry Revenue (Million), by Price Trend Analysis 2025 & 2033
- Figure 47: Middle East & Africa Agricultural Tractors Industry Revenue Share (%), by Price Trend Analysis 2025 & 2033
- Figure 48: Middle East & Africa Agricultural Tractors Industry Revenue (Million), by Country 2025 & 2033
- Figure 49: Middle East & Africa Agricultural Tractors Industry Revenue Share (%), by Country 2025 & 2033
- Figure 50: Asia Pacific Agricultural Tractors Industry Revenue (Million), by Production Analysis 2025 & 2033
- Figure 51: Asia Pacific Agricultural Tractors Industry Revenue Share (%), by Production Analysis 2025 & 2033
- Figure 52: Asia Pacific Agricultural Tractors Industry Revenue (Million), by Consumption Analysis 2025 & 2033
- Figure 53: Asia Pacific Agricultural Tractors Industry Revenue Share (%), by Consumption Analysis 2025 & 2033
- Figure 54: Asia Pacific Agricultural Tractors Industry Revenue (Million), by Import Market Analysis (Value & Volume) 2025 & 2033
- Figure 55: Asia Pacific Agricultural Tractors Industry Revenue Share (%), by Import Market Analysis (Value & Volume) 2025 & 2033
- Figure 56: Asia Pacific Agricultural Tractors Industry Revenue (Million), by Export Market Analysis (Value & Volume) 2025 & 2033
- Figure 57: Asia Pacific Agricultural Tractors Industry Revenue Share (%), by Export Market Analysis (Value & Volume) 2025 & 2033
- Figure 58: Asia Pacific Agricultural Tractors Industry Revenue (Million), by Price Trend Analysis 2025 & 2033
- Figure 59: Asia Pacific Agricultural Tractors Industry Revenue Share (%), by Price Trend Analysis 2025 & 2033
- Figure 60: Asia Pacific Agricultural Tractors Industry Revenue (Million), by Country 2025 & 2033
- Figure 61: Asia Pacific Agricultural Tractors Industry Revenue Share (%), by Country 2025 & 2033
List of Tables
- Table 1: Global Agricultural Tractors Industry Revenue Million Forecast, by Production Analysis 2020 & 2033
- Table 2: Global Agricultural Tractors Industry Revenue Million Forecast, by Consumption Analysis 2020 & 2033
- Table 3: Global Agricultural Tractors Industry Revenue Million Forecast, by Import Market Analysis (Value & Volume) 2020 & 2033
- Table 4: Global Agricultural Tractors Industry Revenue Million Forecast, by Export Market Analysis (Value & Volume) 2020 & 2033
- Table 5: Global Agricultural Tractors Industry Revenue Million Forecast, by Price Trend Analysis 2020 & 2033
- Table 6: Global Agricultural Tractors Industry Revenue Million Forecast, by Region 2020 & 2033
- Table 7: Global Agricultural Tractors Industry Revenue Million Forecast, by Production Analysis 2020 & 2033
- Table 8: Global Agricultural Tractors Industry Revenue Million Forecast, by Consumption Analysis 2020 & 2033
- Table 9: Global Agricultural Tractors Industry Revenue Million Forecast, by Import Market Analysis (Value & Volume) 2020 & 2033
- Table 10: Global Agricultural Tractors Industry Revenue Million Forecast, by Export Market Analysis (Value & Volume) 2020 & 2033
- Table 11: Global Agricultural Tractors Industry Revenue Million Forecast, by Price Trend Analysis 2020 & 2033
- Table 12: Global Agricultural Tractors Industry Revenue Million Forecast, by Country 2020 & 2033
- Table 13: United States Agricultural Tractors Industry Revenue (Million) Forecast, by Application 2020 & 2033
- Table 14: Canada Agricultural Tractors Industry Revenue (Million) Forecast, by Application 2020 & 2033
- Table 15: Mexico Agricultural Tractors Industry Revenue (Million) Forecast, by Application 2020 & 2033
- Table 16: Global Agricultural Tractors Industry Revenue Million Forecast, by Production Analysis 2020 & 2033
- Table 17: Global Agricultural Tractors Industry Revenue Million Forecast, by Consumption Analysis 2020 & 2033
- Table 18: Global Agricultural Tractors Industry Revenue Million Forecast, by Import Market Analysis (Value & Volume) 2020 & 2033
- Table 19: Global Agricultural Tractors Industry Revenue Million Forecast, by Export Market Analysis (Value & Volume) 2020 & 2033
- Table 20: Global Agricultural Tractors Industry Revenue Million Forecast, by Price Trend Analysis 2020 & 2033
- Table 21: Global Agricultural Tractors Industry Revenue Million Forecast, by Country 2020 & 2033
- Table 22: Brazil Agricultural Tractors Industry Revenue (Million) Forecast, by Application 2020 & 2033
- Table 23: Argentina Agricultural Tractors Industry Revenue (Million) Forecast, by Application 2020 & 2033
- Table 24: Rest of South America Agricultural Tractors Industry Revenue (Million) Forecast, by Application 2020 & 2033
- Table 25: Global Agricultural Tractors Industry Revenue Million Forecast, by Production Analysis 2020 & 2033
- Table 26: Global Agricultural Tractors Industry Revenue Million Forecast, by Consumption Analysis 2020 & 2033
- Table 27: Global Agricultural Tractors Industry Revenue Million Forecast, by Import Market Analysis (Value & Volume) 2020 & 2033
- Table 28: Global Agricultural Tractors Industry Revenue Million Forecast, by Export Market Analysis (Value & Volume) 2020 & 2033
- Table 29: Global Agricultural Tractors Industry Revenue Million Forecast, by Price Trend Analysis 2020 & 2033
- Table 30: Global Agricultural Tractors Industry Revenue Million Forecast, by Country 2020 & 2033
- Table 31: United Kingdom Agricultural Tractors Industry Revenue (Million) Forecast, by Application 2020 & 2033
- Table 32: Germany Agricultural Tractors Industry Revenue (Million) Forecast, by Application 2020 & 2033
- Table 33: France Agricultural Tractors Industry Revenue (Million) Forecast, by Application 2020 & 2033
- Table 34: Italy Agricultural Tractors Industry Revenue (Million) Forecast, by Application 2020 & 2033
- Table 35: Spain Agricultural Tractors Industry Revenue (Million) Forecast, by Application 2020 & 2033
- Table 36: Russia Agricultural Tractors Industry Revenue (Million) Forecast, by Application 2020 & 2033
- Table 37: Benelux Agricultural Tractors Industry Revenue (Million) Forecast, by Application 2020 & 2033
- Table 38: Nordics Agricultural Tractors Industry Revenue (Million) Forecast, by Application 2020 & 2033
- Table 39: Rest of Europe Agricultural Tractors Industry Revenue (Million) Forecast, by Application 2020 & 2033
- Table 40: Global Agricultural Tractors Industry Revenue Million Forecast, by Production Analysis 2020 & 2033
- Table 41: Global Agricultural Tractors Industry Revenue Million Forecast, by Consumption Analysis 2020 & 2033
- Table 42: Global Agricultural Tractors Industry Revenue Million Forecast, by Import Market Analysis (Value & Volume) 2020 & 2033
- Table 43: Global Agricultural Tractors Industry Revenue Million Forecast, by Export Market Analysis (Value & Volume) 2020 & 2033
- Table 44: Global Agricultural Tractors Industry Revenue Million Forecast, by Price Trend Analysis 2020 & 2033
- Table 45: Global Agricultural Tractors Industry Revenue Million Forecast, by Country 2020 & 2033
- Table 46: Turkey Agricultural Tractors Industry Revenue (Million) Forecast, by Application 2020 & 2033
- Table 47: Israel Agricultural Tractors Industry Revenue (Million) Forecast, by Application 2020 & 2033
- Table 48: GCC Agricultural Tractors Industry Revenue (Million) Forecast, by Application 2020 & 2033
- Table 49: North Africa Agricultural Tractors Industry Revenue (Million) Forecast, by Application 2020 & 2033
- Table 50: South Africa Agricultural Tractors Industry Revenue (Million) Forecast, by Application 2020 & 2033
- Table 51: Rest of Middle East & Africa Agricultural Tractors Industry Revenue (Million) Forecast, by Application 2020 & 2033
- Table 52: Global Agricultural Tractors Industry Revenue Million Forecast, by Production Analysis 2020 & 2033
- Table 53: Global Agricultural Tractors Industry Revenue Million Forecast, by Consumption Analysis 2020 & 2033
- Table 54: Global Agricultural Tractors Industry Revenue Million Forecast, by Import Market Analysis (Value & Volume) 2020 & 2033
- Table 55: Global Agricultural Tractors Industry Revenue Million Forecast, by Export Market Analysis (Value & Volume) 2020 & 2033
- Table 56: Global Agricultural Tractors Industry Revenue Million Forecast, by Price Trend Analysis 2020 & 2033
- Table 57: Global Agricultural Tractors Industry Revenue Million Forecast, by Country 2020 & 2033
- Table 58: China Agricultural Tractors Industry Revenue (Million) Forecast, by Application 2020 & 2033
- Table 59: India Agricultural Tractors Industry Revenue (Million) Forecast, by Application 2020 & 2033
- Table 60: Japan Agricultural Tractors Industry Revenue (Million) Forecast, by Application 2020 & 2033
- Table 61: South Korea Agricultural Tractors Industry Revenue (Million) Forecast, by Application 2020 & 2033
- Table 62: ASEAN Agricultural Tractors Industry Revenue (Million) Forecast, by Application 2020 & 2033
- Table 63: Oceania Agricultural Tractors Industry Revenue (Million) Forecast, by Application 2020 & 2033
- Table 64: Rest of Asia Pacific Agricultural Tractors Industry Revenue (Million) Forecast, by Application 2020 & 2033
Frequently Asked Questions
1. What is the projected Compound Annual Growth Rate (CAGR) of the Agricultural Tractors Industry?
The projected CAGR is approximately 5.20%.
2. Which companies are prominent players in the Agricultural Tractors Industry?
Key companies in the market include Iseki & Co Ltd, Deere & Company, CNH Industrial NV, Kubota Corporation, Mahindra & Mahindra Ltd, Claas KGaA mbH, Tractors and Farm Equipment Ltd, AGCO Corporation (Massey Ferguson Limited), Yanmar Holdings Co Lt.
3. What are the main segments of the Agricultural Tractors Industry?
The market segments include Production Analysis, Consumption Analysis, Import Market Analysis (Value & Volume), Export Market Analysis (Value & Volume), Price Trend Analysis.
4. Can you provide details about the market size?
The market size is estimated to be USD 70.40 Million as of 2022.
5. What are some drivers contributing to market growth?
Shortage of Skilled Labor; Government Support to Enhance Farm Mechanization.
6. What are the notable trends driving market growth?
Increasing Farm Mechanization in Developing Markets.
7. Are there any restraints impacting market growth?
Heavy Initial Procurement Cost and High Expenditure on Maintenance.
8. Can you provide examples of recent developments in the market?
November 2022: VST Tillers Tractors Ltd and ZETOR TRACTORS unveiled two best-in-class tractors at the CII Agro Tech India 2022 exhibition. These 45 HP and 50 HP category tractors are jointly developed by VST & ZETOR at their India & Czech Republic plants.
9. What pricing options are available for accessing the report?
Pricing options include single-user, multi-user, and enterprise licenses priced at USD 4750, USD 5250, and USD 8750 respectively.
10. Is the market size provided in terms of value or volume?
The market size is provided in terms of value, measured in Million.
11. Are there any specific market keywords associated with the report?
Yes, the market keyword associated with the report is "Agricultural Tractors Industry," which aids in identifying and referencing the specific market segment covered.
12. How do I determine which pricing option suits my needs best?
The pricing options vary based on user requirements and access needs. Individual users may opt for single-user licenses, while businesses requiring broader access may choose multi-user or enterprise licenses for cost-effective access to the report.
13. Are there any additional resources or data provided in the Agricultural Tractors Industry report?
While the report offers comprehensive insights, it's advisable to review the specific contents or supplementary materials provided to ascertain if additional resources or data are available.
14. How can I stay updated on further developments or reports in the Agricultural Tractors Industry?
To stay informed about further developments, trends, and reports in the Agricultural Tractors Industry, consider subscribing to industry newsletters, following relevant companies and organizations, or regularly checking reputable industry news sources and publications.
Methodology
Step 1 - Identification of Relevant Samples Size from Population Database


Step 2 - Approaches for Defining Global Market Size (Value, Volume* & Price*)

Note*: In applicable scenarios
Step 3 - Data Sources
Primary Research
- Web Analytics
- Survey Reports
- Research Institute
- Latest Research Reports
- Opinion Leaders
Secondary Research
- Annual Reports
- White Paper
- Latest Press Release
- Industry Association
- Paid Database
- Investor Presentations

Step 4 - Data Triangulation
Involves using different sources of information in order to increase the validity of a study
These sources are likely to be stakeholders in a program - participants, other researchers, program staff, other community members, and so on.
Then we put all data in single framework & apply various statistical tools to find out the dynamic on the market.
During the analysis stage, feedback from the stakeholder groups would be compared to determine areas of agreement as well as areas of divergence