

Key Insights
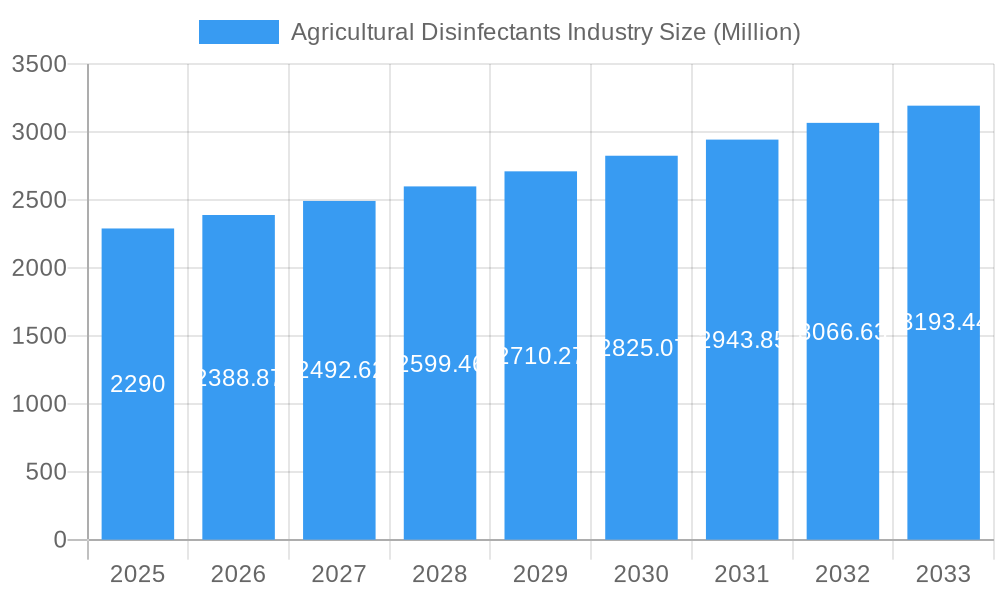
The agricultural disinfectants market, valued at $2.29 billion in 2025, is projected to experience robust growth, driven by increasing concerns about the spread of plant and animal diseases, coupled with rising demand for food safety and hygiene. The market's Compound Annual Growth Rate (CAGR) of 4.30% from 2019-2033 indicates a steady expansion. Key drivers include the growing adoption of intensive farming practices, which necessitate enhanced biosecurity measures to prevent disease outbreaks. Furthermore, stringent government regulations regarding the use of disinfectants in agriculture are fostering market expansion. The liquid form segment is expected to dominate due to its ease of application and versatility across various sanitizing needs, including surface, aerial, and water treatment. Quaternary Ammonium Chloride Salts hold a significant market share among chemical types due to their broad-spectrum efficacy and relatively lower toxicity compared to some alternatives. Growth is expected to be geographically diverse, with North America and Europe maintaining a significant market presence while the Asia-Pacific region exhibits considerable potential driven by expanding agricultural activities and increasing awareness of hygiene practices.
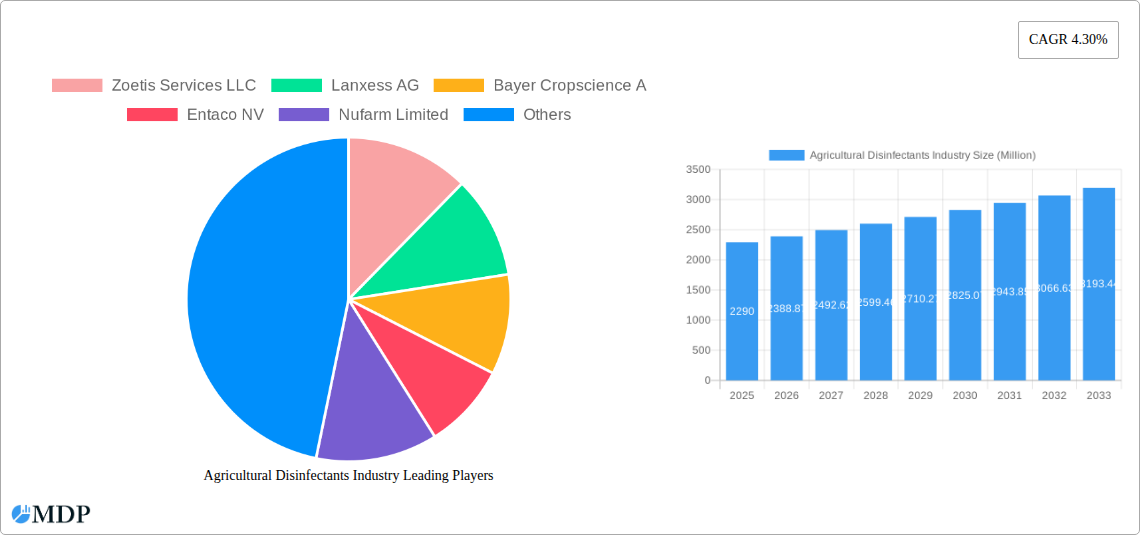
Agricultural Disinfectants Industry Market Size (In Billion)
However, market growth faces certain restraints. The high cost of some disinfectants, particularly specialized formulations for specific pathogens, can limit adoption, especially among smaller farms. Environmental concerns associated with certain chemical types are also prompting research into eco-friendly alternatives, potentially impacting market dynamics. The market is highly competitive, with major players like Zoetis, Lanxess, Bayer, and others continuously innovating to enhance product efficacy and safety. Future growth will likely be shaped by advancements in formulation technology, the development of environmentally sustainable solutions, and a growing focus on integrated pest and disease management strategies that prioritize preventative measures alongside disinfectant use. The forecast period (2025-2033) is anticipated to witness a surge in the adoption of advanced technologies and data-driven decision-making within agricultural practices, directly impacting the demand for and type of disinfectants employed.
Agricultural Disinfectants Industry Company Market Share
Agricultural Disinfectants Industry: A Comprehensive Market Report (2019-2033)
This comprehensive report provides an in-depth analysis of the Agricultural Disinfectants industry, projecting a market value of $XX Million by 2033. The study covers the period 2019-2033, with 2025 as the base and estimated year, and a forecast period of 2025-2033. This report is essential for industry stakeholders, investors, and businesses seeking to understand the market dynamics, growth drivers, and future opportunities in this crucial sector. It offers actionable insights into market trends, competitive landscapes, and strategic decision-making.
Agricultural Disinfectants Industry Market Dynamics & Concentration
The Agricultural Disinfectants market, valued at $XX Million in 2024, is experiencing moderate consolidation. While fragmentation exists among numerous players, larger corporations like Zoetis Services LLC, Lanxess AG, and Bayer Cropscience A hold significant market share, estimated collectively at approximately XX%. Innovation is a key driver, with companies constantly developing new formulations and applications to address evolving challenges such as antimicrobial resistance and stricter regulatory environments.
Market Concentration:
- High concentration in the liquid formulation segment.
- Moderate concentration in the powder segment.
- Increasing consolidation through mergers and acquisitions (M&A).
Innovation Drivers:
- Development of environmentally friendly disinfectants.
- Focus on broad-spectrum efficacy against various pathogens.
- Enhanced delivery systems for improved application efficiency.
Regulatory Frameworks:
- Stringent regulations regarding the use and registration of chemical disinfectants vary across geographies, creating both opportunities and challenges for companies.
- Growing emphasis on sustainable and eco-friendly disinfectants.
Product Substitutes:
- Natural disinfectants and biopesticides are emerging as potential substitutes, driven by growing consumer preference for environmentally friendly products.
End-User Trends:
- Increasing awareness of biosecurity and hygiene practices among farmers and agricultural businesses is driving demand.
- Growing adoption of integrated pest management (IPM) strategies.
M&A Activities:
- The number of M&A deals in the sector has seen a steady increase in recent years. Notable examples include Lanxess AG's acquisition of Theseo in 2021.
Agricultural Disinfectants Industry Industry Trends & Analysis
The agricultural disinfectants market exhibits a robust Compound Annual Growth Rate (CAGR) of XX% during the forecast period (2025-2033). Several factors contribute to this growth. Rising concerns about animal and plant diseases, coupled with the increasing intensification of agricultural practices, are fueling demand for effective disinfection solutions. Technological advancements, such as the development of novel chemical formulations with improved efficacy and safety profiles, also contribute significantly. Market penetration of new, sustainable solutions is steadily increasing, driven by evolving consumer preferences and stringent environmental regulations. Competitive dynamics remain intense, with companies focusing on innovation, strategic partnerships, and geographic expansion to maintain a strong market position. The market is witnessing an increasing trend towards automation and precision application techniques. This reduces human intervention, improving efficiency and minimizing potential human exposure to chemicals.
Leading Markets & Segments in Agricultural Disinfectants Industry
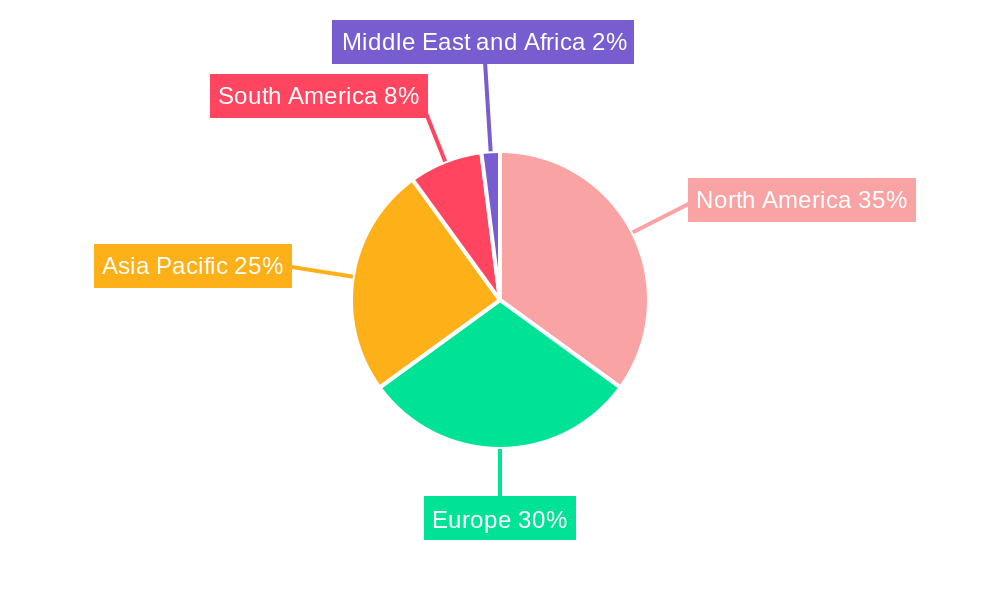
The North American region currently holds the largest market share in the agricultural disinfectants industry, driven by factors such as high agricultural output and strong regulatory frameworks. Within chemical types, Quaternary Ammonium Chloride Salts represent a significant segment owing to its broad-spectrum activity and relatively low cost. The liquid form dominates the market due to its ease of application. Surface application remains the primary application method due to the vast range of applications it addresses.
Key Drivers by Segment:
Chemical Type:
- Quaternary Ammonium Chloride Salts: Cost-effectiveness, broad-spectrum activity.
- Hydrogen Dioxide and Peracetic Acid: Effectiveness against a wide range of pathogens, environmental friendliness.
- Hypochlorites and Halogens: Strong disinfecting properties, cost-effective.
- Other Chemical Types: Innovation, specialization, niche applications.
Form:
- Liquid: Ease of application, versatility.
- Powder: Longer shelf life, ease of storage and transport.
Application:
- Surface: Wide applicability, established market.
- Aerial: Effective for large-scale applications.
- Water Sanitizing: Crucial for preventing waterborne diseases.
Dominance Analysis:
North America's dominance stems from advanced agricultural practices, high animal density, and robust regulatory frameworks that support the use of disinfectants. Europe follows closely, but growth is anticipated to be faster in the Asia-Pacific region due to increasing agricultural activities and rising awareness of biosecurity.
Agricultural Disinfectants Industry Product Developments
Recent product innovations focus on developing environmentally friendly and highly effective formulations. Companies are increasingly investing in research and development to create products with improved efficacy, reduced toxicity, and enhanced sustainability. This includes the development of biodegradable and non-toxic alternatives to traditional disinfectants, addressing growing concerns over environmental impact and human health. The market is also witnessing a rise in combination products that incorporate multiple active ingredients, enhancing their effectiveness against a wider range of pathogens. This caters to the needs of producers seeking comprehensive protection against disease.
Key Drivers of Agricultural Disinfectants Industry Growth
Several factors are driving growth in the agricultural disinfectants market. Technological advancements leading to the development of more effective and environmentally friendly products are pivotal. Stringent regulations aimed at preventing the spread of animal and plant diseases are also increasing demand. Furthermore, the rising global population and growing demand for food are contributing to the intensification of agricultural practices, fueling the need for effective disinfection solutions.
Challenges in the Agricultural Disinfectants Industry Market
The industry faces challenges such as stringent regulatory approvals, impacting product launch timelines and costs. Supply chain disruptions, particularly related to raw materials, can significantly affect production and profitability. Furthermore, intense competition among established players and the emergence of new entrants create price pressure and necessitate continuous innovation to maintain a competitive edge. The increasing adoption of bio-pesticides and naturally-derived disinfectants presents a further challenge to established chemical-based products.
Emerging Opportunities in Agricultural Disinfectants Industry
The long-term growth of the agricultural disinfectants market is fueled by several opportunities. Technological breakthroughs in formulation and delivery systems will lead to more efficient and targeted applications. Strategic partnerships between chemical companies and agricultural technology providers are enabling the development of integrated pest management solutions. Market expansion into emerging economies with growing agricultural sectors presents substantial potential for growth.
Leading Players in the Agricultural Disinfectants Industry Sector
Key Milestones in Agricultural Disinfectants Industry Industry
- 2021: Ceva Santé Animale Group and INRAE Technologies signed an agreement to collaborate on animal health, focusing on infectious disease prevention and animal welfare. This collaboration significantly impacts the market by accelerating the development of novel, effective, and sustainable animal health solutions.
- 2021: Lanxess AG acquired Theseo, a disinfection and hygiene solutions provider. This acquisition broadened Lanxess AG's product portfolio and strengthened its market position within animal hygiene, creating synergies and market expansion opportunities.
Strategic Outlook for Agricultural Disinfectants Industry Market
The future of the agricultural disinfectants market is promising. Continued innovation in product formulation, coupled with the growing adoption of sustainable and environmentally friendly options, will drive long-term growth. Strategic partnerships and collaborations across the value chain will play a critical role in shaping the market landscape. Companies that prioritize research and development, regulatory compliance, and sustainable practices are well-positioned to capitalize on the significant growth opportunities within this sector.
Agricultural Disinfectants Industry Segmentation
- 1. Production Analysis
- 2. Consumption Analysis
- 3. Import Market Analysis (Value & Volume)
- 4. Export Market Analysis (Value & Volume)
- 5. Price Trend Analysis
Agricultural Disinfectants Industry Segmentation By Geography
-
1. North America
- 1.1. United States
- 1.2. Canada
- 1.3. Mexico
-
2. South America
- 2.1. Brazil
- 2.2. Argentina
- 2.3. Rest of South America
-
3. Europe
- 3.1. United Kingdom
- 3.2. Germany
- 3.3. France
- 3.4. Italy
- 3.5. Spain
- 3.6. Russia
- 3.7. Benelux
- 3.8. Nordics
- 3.9. Rest of Europe
-
4. Middle East & Africa
- 4.1. Turkey
- 4.2. Israel
- 4.3. GCC
- 4.4. North Africa
- 4.5. South Africa
- 4.6. Rest of Middle East & Africa
-
5. Asia Pacific
- 5.1. China
- 5.2. India
- 5.3. Japan
- 5.4. South Korea
- 5.5. ASEAN
- 5.6. Oceania
- 5.7. Rest of Asia Pacific
Agricultural Disinfectants Industry Regional Market Share
Geographic Coverage of Agricultural Disinfectants Industry
Agricultural Disinfectants Industry REPORT HIGHLIGHTS
| Aspects | Details |
|---|---|
| Study Period | 2020-2034 |
| Base Year | 2025 |
| Estimated Year | 2026 |
| Forecast Period | 2026-2034 |
| Historical Period | 2020-2025 |
| Growth Rate | CAGR of 4.30% from 2020-2034 |
| Segmentation |
|
Table of Contents
- 1. Introduction
- 1.1. Research Scope
- 1.2. Market Segmentation
- 1.3. Research Objective
- 1.4. Definitions and Assumptions
- 2. Executive Summary
- 2.1. Market Snapshot
- 3. Market Dynamics
- 3.1. Market Drivers
- 3.2. Market Restrains
- 3.3. Market Trends
- 3.4. Market Opportunities
- 4. Market Factor Analysis
- 4.1. Porters Five Forces
- 4.1.1. Bargaining Power of Suppliers
- 4.1.2. Bargaining Power of Buyers
- 4.1.3. Threat of New Entrants
- 4.1.4. Threat of Substitutes
- 4.1.5. Competitive Rivalry
- 4.2. PESTEL analysis
- 4.3. BCG Analysis
- 4.3.1. Stars (High Growth, High Market Share)
- 4.3.2. Cash Cows (Low Growth, High Market Share)
- 4.3.3. Question Mark (High Growth, Low Market Share)
- 4.3.4. Dogs (Low Growth, Low Market Share)
- 4.4. Ansoff Matrix Analysis
- 4.5. Supply Chain Analysis
- 4.6. Regulatory Landscape
- 4.7. Current Market Potential and Opportunity Assessment (TAM–SAM–SOM Framework)
- 4.8. MDP Analyst Note
- 4.1. Porters Five Forces
- 5. Market Analysis, Insights and Forecast 2021-2033
- 5.1. Market Analysis, Insights and Forecast - by Production Analysis
- 5.2. Market Analysis, Insights and Forecast - by Consumption Analysis
- 5.3. Market Analysis, Insights and Forecast - by Import Market Analysis (Value & Volume)
- 5.4. Market Analysis, Insights and Forecast - by Export Market Analysis (Value & Volume)
- 5.5. Market Analysis, Insights and Forecast - by Price Trend Analysis
- 5.6. Market Analysis, Insights and Forecast - by Region
- 5.6.1. North America
- 5.6.2. South America
- 5.6.3. Europe
- 5.6.4. Middle East & Africa
- 5.6.5. Asia Pacific
- 6. Global Agricultural Disinfectants Industry Analysis, Insights and Forecast, 2021-2033
- 6.1. Market Analysis, Insights and Forecast - by Production Analysis
- 6.2. Market Analysis, Insights and Forecast - by Consumption Analysis
- 6.3. Market Analysis, Insights and Forecast - by Import Market Analysis (Value & Volume)
- 6.4. Market Analysis, Insights and Forecast - by Export Market Analysis (Value & Volume)
- 6.5. Market Analysis, Insights and Forecast - by Price Trend Analysis
- 7. North America Agricultural Disinfectants Industry Analysis, Insights and Forecast, 2020-2032
- 7.1. Market Analysis, Insights and Forecast - by Production Analysis
- 7.2. Market Analysis, Insights and Forecast - by Consumption Analysis
- 7.3. Market Analysis, Insights and Forecast - by Import Market Analysis (Value & Volume)
- 7.4. Market Analysis, Insights and Forecast - by Export Market Analysis (Value & Volume)
- 7.5. Market Analysis, Insights and Forecast - by Price Trend Analysis
- 8. South America Agricultural Disinfectants Industry Analysis, Insights and Forecast, 2020-2032
- 8.1. Market Analysis, Insights and Forecast - by Production Analysis
- 8.2. Market Analysis, Insights and Forecast - by Consumption Analysis
- 8.3. Market Analysis, Insights and Forecast - by Import Market Analysis (Value & Volume)
- 8.4. Market Analysis, Insights and Forecast - by Export Market Analysis (Value & Volume)
- 8.5. Market Analysis, Insights and Forecast - by Price Trend Analysis
- 9. Europe Agricultural Disinfectants Industry Analysis, Insights and Forecast, 2020-2032
- 9.1. Market Analysis, Insights and Forecast - by Production Analysis
- 9.2. Market Analysis, Insights and Forecast - by Consumption Analysis
- 9.3. Market Analysis, Insights and Forecast - by Import Market Analysis (Value & Volume)
- 9.4. Market Analysis, Insights and Forecast - by Export Market Analysis (Value & Volume)
- 9.5. Market Analysis, Insights and Forecast - by Price Trend Analysis
- 10. Middle East & Africa Agricultural Disinfectants Industry Analysis, Insights and Forecast, 2020-2032
- 10.1. Market Analysis, Insights and Forecast - by Production Analysis
- 10.2. Market Analysis, Insights and Forecast - by Consumption Analysis
- 10.3. Market Analysis, Insights and Forecast - by Import Market Analysis (Value & Volume)
- 10.4. Market Analysis, Insights and Forecast - by Export Market Analysis (Value & Volume)
- 10.5. Market Analysis, Insights and Forecast - by Price Trend Analysis
- 11. Asia Pacific Agricultural Disinfectants Industry Analysis, Insights and Forecast, 2020-2032
- 11.1. Market Analysis, Insights and Forecast - by Production Analysis
- 11.2. Market Analysis, Insights and Forecast - by Consumption Analysis
- 11.3. Market Analysis, Insights and Forecast - by Import Market Analysis (Value & Volume)
- 11.4. Market Analysis, Insights and Forecast - by Export Market Analysis (Value & Volume)
- 11.5. Market Analysis, Insights and Forecast - by Price Trend Analysis
- 12. Competitive Analysis
- 12.1. Company Profiles
- 12.1.1 Zoetis Services LLC
- 12.1.1.1. Company Overview
- 12.1.1.2. Products
- 12.1.1.3. Company Financials
- 12.1.1.4. SWOT Analysis
- 12.1.2 Lanxess AG
- 12.1.2.1. Company Overview
- 12.1.2.2. Products
- 12.1.2.3. Company Financials
- 12.1.2.4. SWOT Analysis
- 12.1.3 Bayer Cropscience A
- 12.1.3.1. Company Overview
- 12.1.3.2. Products
- 12.1.3.3. Company Financials
- 12.1.3.4. SWOT Analysis
- 12.1.4 Entaco NV
- 12.1.4.1. Company Overview
- 12.1.4.2. Products
- 12.1.4.3. Company Financials
- 12.1.4.4. SWOT Analysis
- 12.1.5 Nufarm Limited
- 12.1.5.1. Company Overview
- 12.1.5.2. Products
- 12.1.5.3. Company Financials
- 12.1.5.4. SWOT Analysis
- 12.1.6 Corteva Agri Science
- 12.1.6.1. Company Overview
- 12.1.6.2. Products
- 12.1.6.3. Company Financials
- 12.1.6.4. SWOT Analysis
- 12.1.7 Stepan Company
- 12.1.7.1. Company Overview
- 12.1.7.2. Products
- 12.1.7.3. Company Financials
- 12.1.7.4. SWOT Analysis
- 12.1.8 Neogen Corporation
- 12.1.8.1. Company Overview
- 12.1.8.2. Products
- 12.1.8.3. Company Financials
- 12.1.8.4. SWOT Analysis
- 12.1.9 Thymox Technology
- 12.1.9.1. Company Overview
- 12.1.9.2. Products
- 12.1.9.3. Company Financials
- 12.1.9.4. SWOT Analysis
- 12.1.10 Ceva Sante Animale Group
- 12.1.10.1. Company Overview
- 12.1.10.2. Products
- 12.1.10.3. Company Financials
- 12.1.10.4. SWOT Analysis
- 12.1.1 Zoetis Services LLC
- 12.2. Market Entropy
- 12.2.1 Company's Key Areas Served
- 12.2.2 Recent Developments
- 12.3. Company Market Share Analysis 2025
- 12.3.1 Top 5 Companies Market Share Analysis
- 12.3.2 Top 3 Companies Market Share Analysis
- 12.4. List of Potential Customers
- 13. Research Methodology
List of Figures
- Figure 1: Global Agricultural Disinfectants Industry Revenue Breakdown (Million, %) by Region 2025 & 2033
- Figure 2: North America Agricultural Disinfectants Industry Revenue (Million), by Production Analysis 2025 & 2033
- Figure 3: North America Agricultural Disinfectants Industry Revenue Share (%), by Production Analysis 2025 & 2033
- Figure 4: North America Agricultural Disinfectants Industry Revenue (Million), by Consumption Analysis 2025 & 2033
- Figure 5: North America Agricultural Disinfectants Industry Revenue Share (%), by Consumption Analysis 2025 & 2033
- Figure 6: North America Agricultural Disinfectants Industry Revenue (Million), by Import Market Analysis (Value & Volume) 2025 & 2033
- Figure 7: North America Agricultural Disinfectants Industry Revenue Share (%), by Import Market Analysis (Value & Volume) 2025 & 2033
- Figure 8: North America Agricultural Disinfectants Industry Revenue (Million), by Export Market Analysis (Value & Volume) 2025 & 2033
- Figure 9: North America Agricultural Disinfectants Industry Revenue Share (%), by Export Market Analysis (Value & Volume) 2025 & 2033
- Figure 10: North America Agricultural Disinfectants Industry Revenue (Million), by Price Trend Analysis 2025 & 2033
- Figure 11: North America Agricultural Disinfectants Industry Revenue Share (%), by Price Trend Analysis 2025 & 2033
- Figure 12: North America Agricultural Disinfectants Industry Revenue (Million), by Country 2025 & 2033
- Figure 13: North America Agricultural Disinfectants Industry Revenue Share (%), by Country 2025 & 2033
- Figure 14: South America Agricultural Disinfectants Industry Revenue (Million), by Production Analysis 2025 & 2033
- Figure 15: South America Agricultural Disinfectants Industry Revenue Share (%), by Production Analysis 2025 & 2033
- Figure 16: South America Agricultural Disinfectants Industry Revenue (Million), by Consumption Analysis 2025 & 2033
- Figure 17: South America Agricultural Disinfectants Industry Revenue Share (%), by Consumption Analysis 2025 & 2033
- Figure 18: South America Agricultural Disinfectants Industry Revenue (Million), by Import Market Analysis (Value & Volume) 2025 & 2033
- Figure 19: South America Agricultural Disinfectants Industry Revenue Share (%), by Import Market Analysis (Value & Volume) 2025 & 2033
- Figure 20: South America Agricultural Disinfectants Industry Revenue (Million), by Export Market Analysis (Value & Volume) 2025 & 2033
- Figure 21: South America Agricultural Disinfectants Industry Revenue Share (%), by Export Market Analysis (Value & Volume) 2025 & 2033
- Figure 22: South America Agricultural Disinfectants Industry Revenue (Million), by Price Trend Analysis 2025 & 2033
- Figure 23: South America Agricultural Disinfectants Industry Revenue Share (%), by Price Trend Analysis 2025 & 2033
- Figure 24: South America Agricultural Disinfectants Industry Revenue (Million), by Country 2025 & 2033
- Figure 25: South America Agricultural Disinfectants Industry Revenue Share (%), by Country 2025 & 2033
- Figure 26: Europe Agricultural Disinfectants Industry Revenue (Million), by Production Analysis 2025 & 2033
- Figure 27: Europe Agricultural Disinfectants Industry Revenue Share (%), by Production Analysis 2025 & 2033
- Figure 28: Europe Agricultural Disinfectants Industry Revenue (Million), by Consumption Analysis 2025 & 2033
- Figure 29: Europe Agricultural Disinfectants Industry Revenue Share (%), by Consumption Analysis 2025 & 2033
- Figure 30: Europe Agricultural Disinfectants Industry Revenue (Million), by Import Market Analysis (Value & Volume) 2025 & 2033
- Figure 31: Europe Agricultural Disinfectants Industry Revenue Share (%), by Import Market Analysis (Value & Volume) 2025 & 2033
- Figure 32: Europe Agricultural Disinfectants Industry Revenue (Million), by Export Market Analysis (Value & Volume) 2025 & 2033
- Figure 33: Europe Agricultural Disinfectants Industry Revenue Share (%), by Export Market Analysis (Value & Volume) 2025 & 2033
- Figure 34: Europe Agricultural Disinfectants Industry Revenue (Million), by Price Trend Analysis 2025 & 2033
- Figure 35: Europe Agricultural Disinfectants Industry Revenue Share (%), by Price Trend Analysis 2025 & 2033
- Figure 36: Europe Agricultural Disinfectants Industry Revenue (Million), by Country 2025 & 2033
- Figure 37: Europe Agricultural Disinfectants Industry Revenue Share (%), by Country 2025 & 2033
- Figure 38: Middle East & Africa Agricultural Disinfectants Industry Revenue (Million), by Production Analysis 2025 & 2033
- Figure 39: Middle East & Africa Agricultural Disinfectants Industry Revenue Share (%), by Production Analysis 2025 & 2033
- Figure 40: Middle East & Africa Agricultural Disinfectants Industry Revenue (Million), by Consumption Analysis 2025 & 2033
- Figure 41: Middle East & Africa Agricultural Disinfectants Industry Revenue Share (%), by Consumption Analysis 2025 & 2033
- Figure 42: Middle East & Africa Agricultural Disinfectants Industry Revenue (Million), by Import Market Analysis (Value & Volume) 2025 & 2033
- Figure 43: Middle East & Africa Agricultural Disinfectants Industry Revenue Share (%), by Import Market Analysis (Value & Volume) 2025 & 2033
- Figure 44: Middle East & Africa Agricultural Disinfectants Industry Revenue (Million), by Export Market Analysis (Value & Volume) 2025 & 2033
- Figure 45: Middle East & Africa Agricultural Disinfectants Industry Revenue Share (%), by Export Market Analysis (Value & Volume) 2025 & 2033
- Figure 46: Middle East & Africa Agricultural Disinfectants Industry Revenue (Million), by Price Trend Analysis 2025 & 2033
- Figure 47: Middle East & Africa Agricultural Disinfectants Industry Revenue Share (%), by Price Trend Analysis 2025 & 2033
- Figure 48: Middle East & Africa Agricultural Disinfectants Industry Revenue (Million), by Country 2025 & 2033
- Figure 49: Middle East & Africa Agricultural Disinfectants Industry Revenue Share (%), by Country 2025 & 2033
- Figure 50: Asia Pacific Agricultural Disinfectants Industry Revenue (Million), by Production Analysis 2025 & 2033
- Figure 51: Asia Pacific Agricultural Disinfectants Industry Revenue Share (%), by Production Analysis 2025 & 2033
- Figure 52: Asia Pacific Agricultural Disinfectants Industry Revenue (Million), by Consumption Analysis 2025 & 2033
- Figure 53: Asia Pacific Agricultural Disinfectants Industry Revenue Share (%), by Consumption Analysis 2025 & 2033
- Figure 54: Asia Pacific Agricultural Disinfectants Industry Revenue (Million), by Import Market Analysis (Value & Volume) 2025 & 2033
- Figure 55: Asia Pacific Agricultural Disinfectants Industry Revenue Share (%), by Import Market Analysis (Value & Volume) 2025 & 2033
- Figure 56: Asia Pacific Agricultural Disinfectants Industry Revenue (Million), by Export Market Analysis (Value & Volume) 2025 & 2033
- Figure 57: Asia Pacific Agricultural Disinfectants Industry Revenue Share (%), by Export Market Analysis (Value & Volume) 2025 & 2033
- Figure 58: Asia Pacific Agricultural Disinfectants Industry Revenue (Million), by Price Trend Analysis 2025 & 2033
- Figure 59: Asia Pacific Agricultural Disinfectants Industry Revenue Share (%), by Price Trend Analysis 2025 & 2033
- Figure 60: Asia Pacific Agricultural Disinfectants Industry Revenue (Million), by Country 2025 & 2033
- Figure 61: Asia Pacific Agricultural Disinfectants Industry Revenue Share (%), by Country 2025 & 2033
List of Tables
- Table 1: Global Agricultural Disinfectants Industry Revenue Million Forecast, by Production Analysis 2020 & 2033
- Table 2: Global Agricultural Disinfectants Industry Revenue Million Forecast, by Consumption Analysis 2020 & 2033
- Table 3: Global Agricultural Disinfectants Industry Revenue Million Forecast, by Import Market Analysis (Value & Volume) 2020 & 2033
- Table 4: Global Agricultural Disinfectants Industry Revenue Million Forecast, by Export Market Analysis (Value & Volume) 2020 & 2033
- Table 5: Global Agricultural Disinfectants Industry Revenue Million Forecast, by Price Trend Analysis 2020 & 2033
- Table 6: Global Agricultural Disinfectants Industry Revenue Million Forecast, by Region 2020 & 2033
- Table 7: Global Agricultural Disinfectants Industry Revenue Million Forecast, by Production Analysis 2020 & 2033
- Table 8: Global Agricultural Disinfectants Industry Revenue Million Forecast, by Consumption Analysis 2020 & 2033
- Table 9: Global Agricultural Disinfectants Industry Revenue Million Forecast, by Import Market Analysis (Value & Volume) 2020 & 2033
- Table 10: Global Agricultural Disinfectants Industry Revenue Million Forecast, by Export Market Analysis (Value & Volume) 2020 & 2033
- Table 11: Global Agricultural Disinfectants Industry Revenue Million Forecast, by Price Trend Analysis 2020 & 2033
- Table 12: Global Agricultural Disinfectants Industry Revenue Million Forecast, by Country 2020 & 2033
- Table 13: United States Agricultural Disinfectants Industry Revenue (Million) Forecast, by Application 2020 & 2033
- Table 14: Canada Agricultural Disinfectants Industry Revenue (Million) Forecast, by Application 2020 & 2033
- Table 15: Mexico Agricultural Disinfectants Industry Revenue (Million) Forecast, by Application 2020 & 2033
- Table 16: Global Agricultural Disinfectants Industry Revenue Million Forecast, by Production Analysis 2020 & 2033
- Table 17: Global Agricultural Disinfectants Industry Revenue Million Forecast, by Consumption Analysis 2020 & 2033
- Table 18: Global Agricultural Disinfectants Industry Revenue Million Forecast, by Import Market Analysis (Value & Volume) 2020 & 2033
- Table 19: Global Agricultural Disinfectants Industry Revenue Million Forecast, by Export Market Analysis (Value & Volume) 2020 & 2033
- Table 20: Global Agricultural Disinfectants Industry Revenue Million Forecast, by Price Trend Analysis 2020 & 2033
- Table 21: Global Agricultural Disinfectants Industry Revenue Million Forecast, by Country 2020 & 2033
- Table 22: Brazil Agricultural Disinfectants Industry Revenue (Million) Forecast, by Application 2020 & 2033
- Table 23: Argentina Agricultural Disinfectants Industry Revenue (Million) Forecast, by Application 2020 & 2033
- Table 24: Rest of South America Agricultural Disinfectants Industry Revenue (Million) Forecast, by Application 2020 & 2033
- Table 25: Global Agricultural Disinfectants Industry Revenue Million Forecast, by Production Analysis 2020 & 2033
- Table 26: Global Agricultural Disinfectants Industry Revenue Million Forecast, by Consumption Analysis 2020 & 2033
- Table 27: Global Agricultural Disinfectants Industry Revenue Million Forecast, by Import Market Analysis (Value & Volume) 2020 & 2033
- Table 28: Global Agricultural Disinfectants Industry Revenue Million Forecast, by Export Market Analysis (Value & Volume) 2020 & 2033
- Table 29: Global Agricultural Disinfectants Industry Revenue Million Forecast, by Price Trend Analysis 2020 & 2033
- Table 30: Global Agricultural Disinfectants Industry Revenue Million Forecast, by Country 2020 & 2033
- Table 31: United Kingdom Agricultural Disinfectants Industry Revenue (Million) Forecast, by Application 2020 & 2033
- Table 32: Germany Agricultural Disinfectants Industry Revenue (Million) Forecast, by Application 2020 & 2033
- Table 33: France Agricultural Disinfectants Industry Revenue (Million) Forecast, by Application 2020 & 2033
- Table 34: Italy Agricultural Disinfectants Industry Revenue (Million) Forecast, by Application 2020 & 2033
- Table 35: Spain Agricultural Disinfectants Industry Revenue (Million) Forecast, by Application 2020 & 2033
- Table 36: Russia Agricultural Disinfectants Industry Revenue (Million) Forecast, by Application 2020 & 2033
- Table 37: Benelux Agricultural Disinfectants Industry Revenue (Million) Forecast, by Application 2020 & 2033
- Table 38: Nordics Agricultural Disinfectants Industry Revenue (Million) Forecast, by Application 2020 & 2033
- Table 39: Rest of Europe Agricultural Disinfectants Industry Revenue (Million) Forecast, by Application 2020 & 2033
- Table 40: Global Agricultural Disinfectants Industry Revenue Million Forecast, by Production Analysis 2020 & 2033
- Table 41: Global Agricultural Disinfectants Industry Revenue Million Forecast, by Consumption Analysis 2020 & 2033
- Table 42: Global Agricultural Disinfectants Industry Revenue Million Forecast, by Import Market Analysis (Value & Volume) 2020 & 2033
- Table 43: Global Agricultural Disinfectants Industry Revenue Million Forecast, by Export Market Analysis (Value & Volume) 2020 & 2033
- Table 44: Global Agricultural Disinfectants Industry Revenue Million Forecast, by Price Trend Analysis 2020 & 2033
- Table 45: Global Agricultural Disinfectants Industry Revenue Million Forecast, by Country 2020 & 2033
- Table 46: Turkey Agricultural Disinfectants Industry Revenue (Million) Forecast, by Application 2020 & 2033
- Table 47: Israel Agricultural Disinfectants Industry Revenue (Million) Forecast, by Application 2020 & 2033
- Table 48: GCC Agricultural Disinfectants Industry Revenue (Million) Forecast, by Application 2020 & 2033
- Table 49: North Africa Agricultural Disinfectants Industry Revenue (Million) Forecast, by Application 2020 & 2033
- Table 50: South Africa Agricultural Disinfectants Industry Revenue (Million) Forecast, by Application 2020 & 2033
- Table 51: Rest of Middle East & Africa Agricultural Disinfectants Industry Revenue (Million) Forecast, by Application 2020 & 2033
- Table 52: Global Agricultural Disinfectants Industry Revenue Million Forecast, by Production Analysis 2020 & 2033
- Table 53: Global Agricultural Disinfectants Industry Revenue Million Forecast, by Consumption Analysis 2020 & 2033
- Table 54: Global Agricultural Disinfectants Industry Revenue Million Forecast, by Import Market Analysis (Value & Volume) 2020 & 2033
- Table 55: Global Agricultural Disinfectants Industry Revenue Million Forecast, by Export Market Analysis (Value & Volume) 2020 & 2033
- Table 56: Global Agricultural Disinfectants Industry Revenue Million Forecast, by Price Trend Analysis 2020 & 2033
- Table 57: Global Agricultural Disinfectants Industry Revenue Million Forecast, by Country 2020 & 2033
- Table 58: China Agricultural Disinfectants Industry Revenue (Million) Forecast, by Application 2020 & 2033
- Table 59: India Agricultural Disinfectants Industry Revenue (Million) Forecast, by Application 2020 & 2033
- Table 60: Japan Agricultural Disinfectants Industry Revenue (Million) Forecast, by Application 2020 & 2033
- Table 61: South Korea Agricultural Disinfectants Industry Revenue (Million) Forecast, by Application 2020 & 2033
- Table 62: ASEAN Agricultural Disinfectants Industry Revenue (Million) Forecast, by Application 2020 & 2033
- Table 63: Oceania Agricultural Disinfectants Industry Revenue (Million) Forecast, by Application 2020 & 2033
- Table 64: Rest of Asia Pacific Agricultural Disinfectants Industry Revenue (Million) Forecast, by Application 2020 & 2033
Frequently Asked Questions
1. What is the projected Compound Annual Growth Rate (CAGR) of the Agricultural Disinfectants Industry?
The projected CAGR is approximately 4.30%.
2. Which companies are prominent players in the Agricultural Disinfectants Industry?
Key companies in the market include Zoetis Services LLC, Lanxess AG, Bayer Cropscience A, Entaco NV, Nufarm Limited, Corteva Agri Science, Stepan Company, Neogen Corporation, Thymox Technology, Ceva Sante Animale Group.
3. What are the main segments of the Agricultural Disinfectants Industry?
The market segments include Production Analysis, Consumption Analysis, Import Market Analysis (Value & Volume), Export Market Analysis (Value & Volume), Price Trend Analysis.
4. Can you provide details about the market size?
The market size is estimated to be USD 2.29 Million as of 2022.
5. What are some drivers contributing to market growth?
Skilled Labor Shortage; Favorable Government Policies.
6. What are the notable trends driving market growth?
Growing Area Under Protected Cultivation.
7. Are there any restraints impacting market growth?
Fragmentation of Land Holdings; Increasing Interest of Farmers Toward Custom Hiring Center.
8. Can you provide examples of recent developments in the market?
In 2021, Ceva Santé Animale Group and INRAE Technologies signed an agreement to consolidate their collaboration in animal health. This collaboration will focus on the animal, human, and environmental health. It will particularly focus on the prevention of infectious diseases of animal origin and the improvement of animal welfare.
9. What pricing options are available for accessing the report?
Pricing options include single-user, multi-user, and enterprise licenses priced at USD 4750, USD 5250, and USD 8750 respectively.
10. Is the market size provided in terms of value or volume?
The market size is provided in terms of value, measured in Million.
11. Are there any specific market keywords associated with the report?
Yes, the market keyword associated with the report is "Agricultural Disinfectants Industry," which aids in identifying and referencing the specific market segment covered.
12. How do I determine which pricing option suits my needs best?
The pricing options vary based on user requirements and access needs. Individual users may opt for single-user licenses, while businesses requiring broader access may choose multi-user or enterprise licenses for cost-effective access to the report.
13. Are there any additional resources or data provided in the Agricultural Disinfectants Industry report?
While the report offers comprehensive insights, it's advisable to review the specific contents or supplementary materials provided to ascertain if additional resources or data are available.
14. How can I stay updated on further developments or reports in the Agricultural Disinfectants Industry?
To stay informed about further developments, trends, and reports in the Agricultural Disinfectants Industry, consider subscribing to industry newsletters, following relevant companies and organizations, or regularly checking reputable industry news sources and publications.
Methodology
Step 1 - Identification of Relevant Samples Size from Population Database


Step 2 - Approaches for Defining Global Market Size (Value, Volume* & Price*)

Note*: In applicable scenarios
Step 3 - Data Sources
Primary Research
- Web Analytics
- Survey Reports
- Research Institute
- Latest Research Reports
- Opinion Leaders
Secondary Research
- Annual Reports
- White Paper
- Latest Press Release
- Industry Association
- Paid Database
- Investor Presentations

Step 4 - Data Triangulation
Involves using different sources of information in order to increase the validity of a study
These sources are likely to be stakeholders in a program - participants, other researchers, program staff, other community members, and so on.
Then we put all data in single framework & apply various statistical tools to find out the dynamic on the market.
During the analysis stage, feedback from the stakeholder groups would be compared to determine areas of agreement as well as areas of divergence