

Key Insights
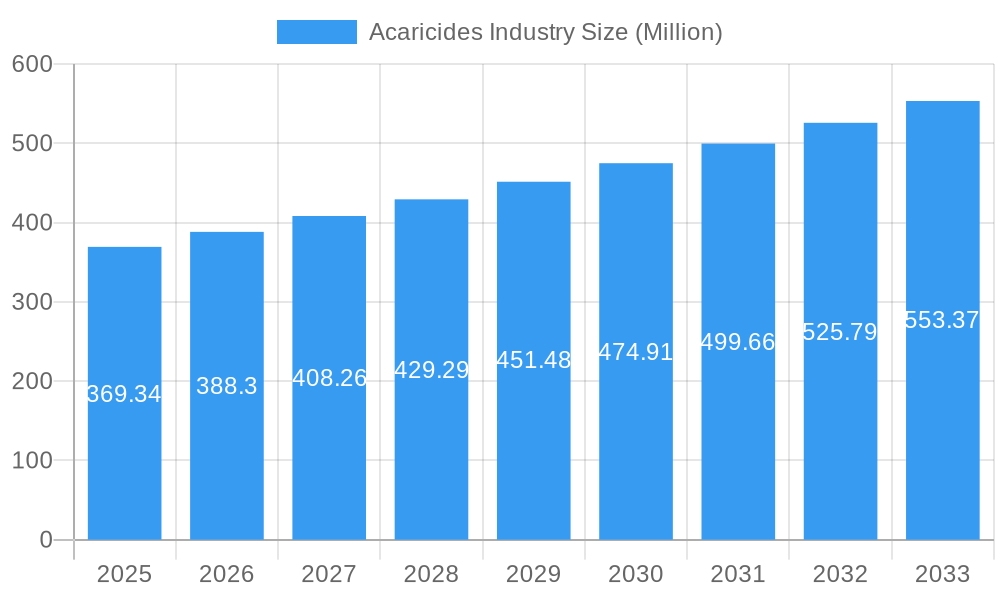
The global acaricide market, valued at $369.34 million in 2025, is projected to experience robust growth, driven by a Compound Annual Growth Rate (CAGR) of 5.00% from 2025 to 2033. This expansion is fueled by several key factors. The rising prevalence of acaricide-resistant pests necessitates the development and adoption of new, effective acaricide formulations. Intensification of agricultural practices and the increasing demand for high-quality agricultural yields globally are significant contributors to market growth. Furthermore, the expanding acreage under cultivation, particularly in developing economies, fuels the demand for effective pest control solutions. The increasing awareness among farmers about the benefits of acaricide usage and improved access to advanced agricultural technologies also contribute to market expansion. However, stringent regulations regarding pesticide use and the growing concerns surrounding environmental and human health impacts of certain acaricide formulations pose challenges to market growth. The market is segmented by chemical type (organophosphates, carbamates, organochlorines, pyrethrins, pyrethroids, and others) and application (spray, dipping, hand dressing, and others), offering diverse product choices catering to varied needs. Leading companies like FMC Corporation, Syngenta, and Bayer CropScience are driving innovation and market competition.
Acaricides Industry Market Size (In Million)
Regional variations in market growth are anticipated, with North America and Europe expected to maintain significant market share due to established agricultural practices and advanced pest management techniques. However, the Asia-Pacific region is projected to witness the fastest growth, propelled by the expanding agricultural sector and increasing adoption of modern agricultural methods in rapidly developing economies like India and China. The South American and African markets are also expected to contribute significantly, albeit at a slower pace, driven by the growth in agricultural production and increasing investments in the agricultural sector. The forecast period, 2025-2033, presents ample opportunities for acaricide manufacturers to innovate and cater to the evolving needs of farmers and the agricultural industry, focusing on environmentally friendly and highly effective solutions.
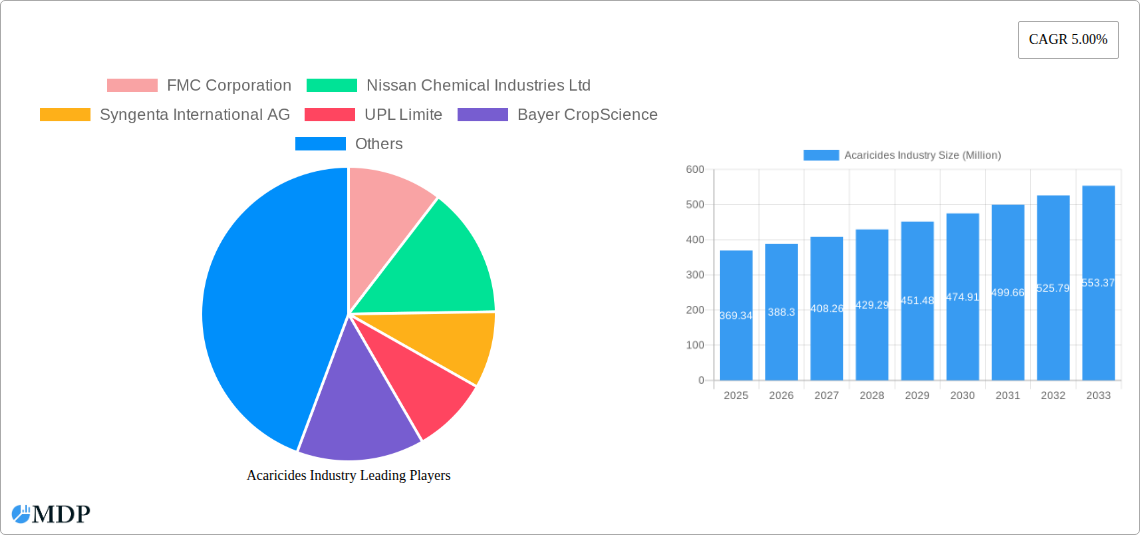
Acaricides Industry Company Market Share
This comprehensive report provides a detailed analysis of the global Acaricides industry, offering invaluable insights for stakeholders, investors, and industry professionals. The study covers the period 2019-2033, with a focus on the estimated year 2025 and a forecast period spanning 2025-2033. The report utilizes extensive data analysis to present a clear and actionable understanding of market dynamics, trends, and future growth potential. The global Acaricides market size is projected to reach xx Million by 2033.
Acaricides Industry Market Dynamics & Concentration
The global acaricides market exhibits a moderately concentrated landscape, with key players like FMC Corporation, Nissan Chemical Industries Ltd, Syngenta International AG, UPL Limited, Bayer CropScience, Corteva Agriscience, and BASF SE holding significant market share. Market concentration is influenced by factors such as economies of scale in production, research & development capabilities, and extensive distribution networks. Innovation plays a crucial role, with companies continuously developing new acaricides with enhanced efficacy, reduced environmental impact, and resistance management strategies. Stringent regulatory frameworks, particularly concerning environmental safety and human health, significantly shape market dynamics. The market also faces pressure from the emergence of biopesticides and other sustainable alternatives. Mergers and acquisitions (M&A) activity has been moderate, with xx M&A deals recorded between 2019 and 2024. End-user trends, primarily driven by the increasing demand for high-yield crops and the growing awareness of mite-borne diseases, are influencing market growth.
- Market Share: FMC Corporation holds approximately xx% market share in 2025, followed by Syngenta at xx% and Bayer at xx%.
- M&A Activity: The average annual deal count for M&A activities in the period 2019-2024 was xx.
- Innovation Drivers: Focus on developing resistance-breaking acaricides and biopesticides.
- Regulatory Landscape: Stringent regulations regarding pesticide registration and usage.
Acaricides Industry Industry Trends & Analysis
The global acaricides market is projected to witness a CAGR of xx% during the forecast period (2025-2033), driven by several key factors. Increasing crop production to meet growing global food demand is a major driver, along with the rising prevalence of mite infestations in various crops. Technological advancements, such as the development of more effective and eco-friendly formulations, are also contributing to market growth. Consumer preferences for naturally produced crops are leading to increased demand for bio-based acaricides. However, the market faces challenges such as the growing resistance of mites to existing acaricides and stringent environmental regulations that restrict the use of certain chemicals. Competitive dynamics are intense, with companies focusing on product differentiation and innovation to gain a competitive edge. Market penetration for new acaricides is estimated at xx% in 2025, expected to reach xx% by 2033.
Leading Markets & Segments in Acaricides Industry
The dominant region for acaricides is currently Asia-Pacific, driven by the extensive agricultural activities and high prevalence of mite infestations in major crop-producing countries. Within chemical types, pyrethroids dominate the market owing to their efficacy and relatively lower environmental impact. Spray application is the most widely used method, due to ease of use and coverage.
- Key Drivers in Asia-Pacific:
- Rapid agricultural expansion and intensification.
- Favorable government policies supporting crop protection.
- Increasing awareness regarding pest and disease management.
- Chemical Type Dominance: Pyrethroids hold the largest market share (xx%), followed by Organophosphates (xx%) and Pyrethrins (xx%). This is due to their effectiveness, cost-effectiveness, and relatively lower environmental concerns compared to other types.
- Application Dominance: Spray application method holds the largest market share (xx%), driven by its cost-effectiveness and ease of implementation across various agricultural settings.
Acaricides Industry Product Developments
Recent years have witnessed significant product innovations in the acaricides market, focusing on enhanced efficacy, reduced environmental impact, and resistance management. Novel formulations are being developed to improve the delivery and effectiveness of acaricides, while also minimizing their adverse effects on beneficial insects and the environment. The focus is shifting towards biopesticides and other eco-friendly alternatives to reduce reliance on synthetic chemicals. These developments enhance the market fit by addressing the growing concerns about environmental sustainability and human health.
Key Drivers of Acaricides Industry Growth
The acaricides industry's growth is driven by several factors. The rising global demand for food necessitates increased crop production, making effective pest control essential. Technological advancements in formulation and delivery systems are enhancing the efficacy of acaricides, while also mitigating environmental risks. Favorable government policies supporting agricultural development and pest management further contribute to the growth of the market.
Challenges in the Acaricides Industry Market
The acaricides industry faces several challenges including the increasing development of acaricide resistance in mites, leading to reduced efficacy of existing products. Stringent regulatory frameworks regarding pesticide usage pose significant hurdles for manufacturers. Supply chain disruptions and fluctuating raw material prices can impact production costs and profitability. Intense competition among established players and the emergence of new biopesticide alternatives further exert pressure on market participants. The overall impact of these challenges is estimated to result in a xx Million loss annually in revenue.
Emerging Opportunities in Acaricides Industry
The growing demand for sustainable and eco-friendly pest control solutions presents significant opportunities for the acaricides industry. This includes the development and commercialization of biopesticides and other environmentally friendly alternatives. Strategic partnerships and collaborations among industry players can accelerate innovation and market penetration of newer products. Expanding into new geographical markets with high growth potential further presents significant opportunities for expansion.
Leading Players in the Acaricides Industry Sector
- FMC Corporation
- Nissan Chemical Industries Ltd
- Syngenta International AG
- UPL Limited
- Bayer CropScience
- Corteva Agriscience
- BASF SE
Key Milestones in Acaricides Industry Industry
- 2020: Launch of a new pyrethroid-based acaricide with improved efficacy and reduced environmental impact by FMC Corporation.
- 2021: Syngenta International AG acquires a smaller acaricide manufacturer, expanding its product portfolio.
- 2022: Increased regulatory scrutiny on certain organophosphate acaricides in major agricultural markets.
- 2023: Several significant investments in R&D related to biopesticide development by leading players.
Strategic Outlook for Acaricides Industry Market
The future of the acaricides market is bright, driven by persistent demand for food security and technological advancements. The growing adoption of precision agriculture and integrated pest management techniques will significantly impact future market dynamics. Strategic partnerships, innovation in biopesticides, and focusing on sustainable solutions will be key factors in securing long-term growth and success in this sector. The market is expected to show robust growth, reaching xx Million by 2033, driven primarily by emerging markets and increasing demand for high-yield crops.
Acaricides Industry Segmentation
- 1. Production Analysis
- 2. Consumption Analysis
- 3. Import Market Analysis (Value & Volume)
- 4. Export Market Analysis (Value & Volume)
- 5. Price Trend Analysis
Acaricides Industry Segmentation By Geography
-
1. North America
- 1.1. United States
- 1.2. Canada
- 1.3. Mexico
-
2. South America
- 2.1. Brazil
- 2.2. Argentina
- 2.3. Rest of South America
-
3. Europe
- 3.1. United Kingdom
- 3.2. Germany
- 3.3. France
- 3.4. Italy
- 3.5. Spain
- 3.6. Russia
- 3.7. Benelux
- 3.8. Nordics
- 3.9. Rest of Europe
-
4. Middle East & Africa
- 4.1. Turkey
- 4.2. Israel
- 4.3. GCC
- 4.4. North Africa
- 4.5. South Africa
- 4.6. Rest of Middle East & Africa
-
5. Asia Pacific
- 5.1. China
- 5.2. India
- 5.3. Japan
- 5.4. South Korea
- 5.5. ASEAN
- 5.6. Oceania
- 5.7. Rest of Asia Pacific
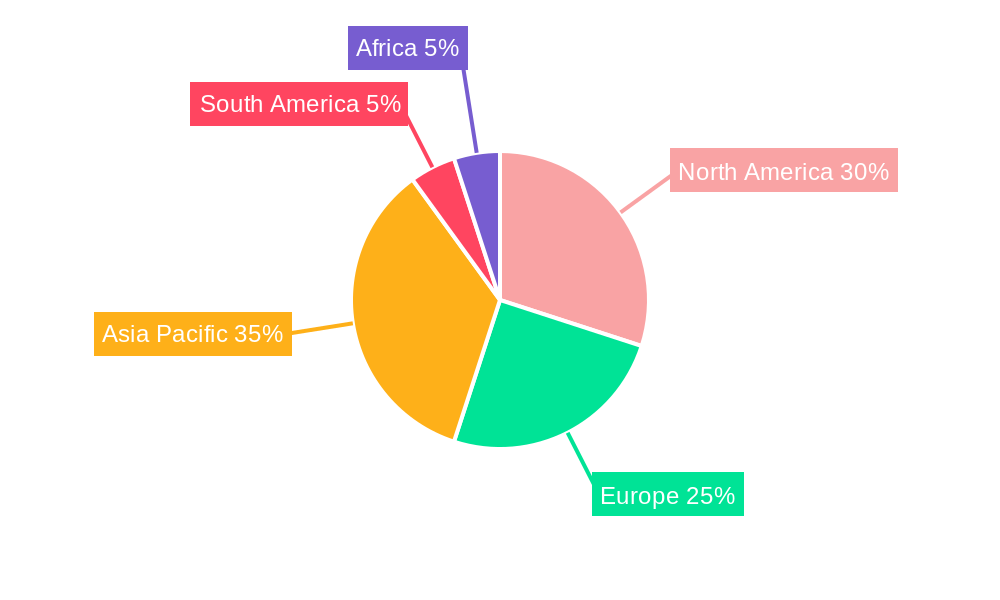
Acaricides Industry Regional Market Share
Geographic Coverage of Acaricides Industry
Acaricides Industry REPORT HIGHLIGHTS
| Aspects | Details |
|---|---|
| Study Period | 2020-2034 |
| Base Year | 2025 |
| Estimated Year | 2026 |
| Forecast Period | 2026-2034 |
| Historical Period | 2020-2025 |
| Growth Rate | CAGR of 5.00% from 2020-2034 |
| Segmentation |
|
Table of Contents
- 1. Introduction
- 1.1. Research Scope
- 1.2. Market Segmentation
- 1.3. Research Objective
- 1.4. Definitions and Assumptions
- 2. Executive Summary
- 2.1. Market Snapshot
- 3. Market Dynamics
- 3.1. Market Drivers
- 3.2. Market Restrains
- 3.3. Market Trends
- 3.4. Market Opportunities
- 4. Market Factor Analysis
- 4.1. Porters Five Forces
- 4.1.1. Bargaining Power of Suppliers
- 4.1.2. Bargaining Power of Buyers
- 4.1.3. Threat of New Entrants
- 4.1.4. Threat of Substitutes
- 4.1.5. Competitive Rivalry
- 4.2. PESTEL analysis
- 4.3. BCG Analysis
- 4.3.1. Stars (High Growth, High Market Share)
- 4.3.2. Cash Cows (Low Growth, High Market Share)
- 4.3.3. Question Mark (High Growth, Low Market Share)
- 4.3.4. Dogs (Low Growth, Low Market Share)
- 4.4. Ansoff Matrix Analysis
- 4.5. Supply Chain Analysis
- 4.6. Regulatory Landscape
- 4.7. Current Market Potential and Opportunity Assessment (TAM–SAM–SOM Framework)
- 4.8. MDP Analyst Note
- 4.1. Porters Five Forces
- 5. Market Analysis, Insights and Forecast 2021-2033
- 5.1. Market Analysis, Insights and Forecast - by Production Analysis
- 5.2. Market Analysis, Insights and Forecast - by Consumption Analysis
- 5.3. Market Analysis, Insights and Forecast - by Import Market Analysis (Value & Volume)
- 5.4. Market Analysis, Insights and Forecast - by Export Market Analysis (Value & Volume)
- 5.5. Market Analysis, Insights and Forecast - by Price Trend Analysis
- 5.6. Market Analysis, Insights and Forecast - by Region
- 5.6.1. North America
- 5.6.2. South America
- 5.6.3. Europe
- 5.6.4. Middle East & Africa
- 5.6.5. Asia Pacific
- 6. Global Acaricides Industry Analysis, Insights and Forecast, 2021-2033
- 6.1. Market Analysis, Insights and Forecast - by Production Analysis
- 6.2. Market Analysis, Insights and Forecast - by Consumption Analysis
- 6.3. Market Analysis, Insights and Forecast - by Import Market Analysis (Value & Volume)
- 6.4. Market Analysis, Insights and Forecast - by Export Market Analysis (Value & Volume)
- 6.5. Market Analysis, Insights and Forecast - by Price Trend Analysis
- 7. North America Acaricides Industry Analysis, Insights and Forecast, 2020-2032
- 7.1. Market Analysis, Insights and Forecast - by Production Analysis
- 7.2. Market Analysis, Insights and Forecast - by Consumption Analysis
- 7.3. Market Analysis, Insights and Forecast - by Import Market Analysis (Value & Volume)
- 7.4. Market Analysis, Insights and Forecast - by Export Market Analysis (Value & Volume)
- 7.5. Market Analysis, Insights and Forecast - by Price Trend Analysis
- 8. South America Acaricides Industry Analysis, Insights and Forecast, 2020-2032
- 8.1. Market Analysis, Insights and Forecast - by Production Analysis
- 8.2. Market Analysis, Insights and Forecast - by Consumption Analysis
- 8.3. Market Analysis, Insights and Forecast - by Import Market Analysis (Value & Volume)
- 8.4. Market Analysis, Insights and Forecast - by Export Market Analysis (Value & Volume)
- 8.5. Market Analysis, Insights and Forecast - by Price Trend Analysis
- 9. Europe Acaricides Industry Analysis, Insights and Forecast, 2020-2032
- 9.1. Market Analysis, Insights and Forecast - by Production Analysis
- 9.2. Market Analysis, Insights and Forecast - by Consumption Analysis
- 9.3. Market Analysis, Insights and Forecast - by Import Market Analysis (Value & Volume)
- 9.4. Market Analysis, Insights and Forecast - by Export Market Analysis (Value & Volume)
- 9.5. Market Analysis, Insights and Forecast - by Price Trend Analysis
- 10. Middle East & Africa Acaricides Industry Analysis, Insights and Forecast, 2020-2032
- 10.1. Market Analysis, Insights and Forecast - by Production Analysis
- 10.2. Market Analysis, Insights and Forecast - by Consumption Analysis
- 10.3. Market Analysis, Insights and Forecast - by Import Market Analysis (Value & Volume)
- 10.4. Market Analysis, Insights and Forecast - by Export Market Analysis (Value & Volume)
- 10.5. Market Analysis, Insights and Forecast - by Price Trend Analysis
- 11. Asia Pacific Acaricides Industry Analysis, Insights and Forecast, 2020-2032
- 11.1. Market Analysis, Insights and Forecast - by Production Analysis
- 11.2. Market Analysis, Insights and Forecast - by Consumption Analysis
- 11.3. Market Analysis, Insights and Forecast - by Import Market Analysis (Value & Volume)
- 11.4. Market Analysis, Insights and Forecast - by Export Market Analysis (Value & Volume)
- 11.5. Market Analysis, Insights and Forecast - by Price Trend Analysis
- 12. Competitive Analysis
- 12.1. Company Profiles
- 12.1.1 FMC Corporation
- 12.1.1.1. Company Overview
- 12.1.1.2. Products
- 12.1.1.3. Company Financials
- 12.1.1.4. SWOT Analysis
- 12.1.2 Nissan Chemical Industries Ltd
- 12.1.2.1. Company Overview
- 12.1.2.2. Products
- 12.1.2.3. Company Financials
- 12.1.2.4. SWOT Analysis
- 12.1.3 Syngenta International AG
- 12.1.3.1. Company Overview
- 12.1.3.2. Products
- 12.1.3.3. Company Financials
- 12.1.3.4. SWOT Analysis
- 12.1.4 UPL Limite
- 12.1.4.1. Company Overview
- 12.1.4.2. Products
- 12.1.4.3. Company Financials
- 12.1.4.4. SWOT Analysis
- 12.1.5 Bayer CropScience
- 12.1.5.1. Company Overview
- 12.1.5.2. Products
- 12.1.5.3. Company Financials
- 12.1.5.4. SWOT Analysis
- 12.1.6 Corteva Agriscience
- 12.1.6.1. Company Overview
- 12.1.6.2. Products
- 12.1.6.3. Company Financials
- 12.1.6.4. SWOT Analysis
- 12.1.7 BASF SE
- 12.1.7.1. Company Overview
- 12.1.7.2. Products
- 12.1.7.3. Company Financials
- 12.1.7.4. SWOT Analysis
- 12.1.1 FMC Corporation
- 12.2. Market Entropy
- 12.2.1 Company's Key Areas Served
- 12.2.2 Recent Developments
- 12.3. Company Market Share Analysis 2025
- 12.3.1 Top 5 Companies Market Share Analysis
- 12.3.2 Top 3 Companies Market Share Analysis
- 12.4. List of Potential Customers
- 13. Research Methodology
List of Figures
- Figure 1: Global Acaricides Industry Revenue Breakdown (Million, %) by Region 2025 & 2033
- Figure 2: North America Acaricides Industry Revenue (Million), by Production Analysis 2025 & 2033
- Figure 3: North America Acaricides Industry Revenue Share (%), by Production Analysis 2025 & 2033
- Figure 4: North America Acaricides Industry Revenue (Million), by Consumption Analysis 2025 & 2033
- Figure 5: North America Acaricides Industry Revenue Share (%), by Consumption Analysis 2025 & 2033
- Figure 6: North America Acaricides Industry Revenue (Million), by Import Market Analysis (Value & Volume) 2025 & 2033
- Figure 7: North America Acaricides Industry Revenue Share (%), by Import Market Analysis (Value & Volume) 2025 & 2033
- Figure 8: North America Acaricides Industry Revenue (Million), by Export Market Analysis (Value & Volume) 2025 & 2033
- Figure 9: North America Acaricides Industry Revenue Share (%), by Export Market Analysis (Value & Volume) 2025 & 2033
- Figure 10: North America Acaricides Industry Revenue (Million), by Price Trend Analysis 2025 & 2033
- Figure 11: North America Acaricides Industry Revenue Share (%), by Price Trend Analysis 2025 & 2033
- Figure 12: North America Acaricides Industry Revenue (Million), by Country 2025 & 2033
- Figure 13: North America Acaricides Industry Revenue Share (%), by Country 2025 & 2033
- Figure 14: South America Acaricides Industry Revenue (Million), by Production Analysis 2025 & 2033
- Figure 15: South America Acaricides Industry Revenue Share (%), by Production Analysis 2025 & 2033
- Figure 16: South America Acaricides Industry Revenue (Million), by Consumption Analysis 2025 & 2033
- Figure 17: South America Acaricides Industry Revenue Share (%), by Consumption Analysis 2025 & 2033
- Figure 18: South America Acaricides Industry Revenue (Million), by Import Market Analysis (Value & Volume) 2025 & 2033
- Figure 19: South America Acaricides Industry Revenue Share (%), by Import Market Analysis (Value & Volume) 2025 & 2033
- Figure 20: South America Acaricides Industry Revenue (Million), by Export Market Analysis (Value & Volume) 2025 & 2033
- Figure 21: South America Acaricides Industry Revenue Share (%), by Export Market Analysis (Value & Volume) 2025 & 2033
- Figure 22: South America Acaricides Industry Revenue (Million), by Price Trend Analysis 2025 & 2033
- Figure 23: South America Acaricides Industry Revenue Share (%), by Price Trend Analysis 2025 & 2033
- Figure 24: South America Acaricides Industry Revenue (Million), by Country 2025 & 2033
- Figure 25: South America Acaricides Industry Revenue Share (%), by Country 2025 & 2033
- Figure 26: Europe Acaricides Industry Revenue (Million), by Production Analysis 2025 & 2033
- Figure 27: Europe Acaricides Industry Revenue Share (%), by Production Analysis 2025 & 2033
- Figure 28: Europe Acaricides Industry Revenue (Million), by Consumption Analysis 2025 & 2033
- Figure 29: Europe Acaricides Industry Revenue Share (%), by Consumption Analysis 2025 & 2033
- Figure 30: Europe Acaricides Industry Revenue (Million), by Import Market Analysis (Value & Volume) 2025 & 2033
- Figure 31: Europe Acaricides Industry Revenue Share (%), by Import Market Analysis (Value & Volume) 2025 & 2033
- Figure 32: Europe Acaricides Industry Revenue (Million), by Export Market Analysis (Value & Volume) 2025 & 2033
- Figure 33: Europe Acaricides Industry Revenue Share (%), by Export Market Analysis (Value & Volume) 2025 & 2033
- Figure 34: Europe Acaricides Industry Revenue (Million), by Price Trend Analysis 2025 & 2033
- Figure 35: Europe Acaricides Industry Revenue Share (%), by Price Trend Analysis 2025 & 2033
- Figure 36: Europe Acaricides Industry Revenue (Million), by Country 2025 & 2033
- Figure 37: Europe Acaricides Industry Revenue Share (%), by Country 2025 & 2033
- Figure 38: Middle East & Africa Acaricides Industry Revenue (Million), by Production Analysis 2025 & 2033
- Figure 39: Middle East & Africa Acaricides Industry Revenue Share (%), by Production Analysis 2025 & 2033
- Figure 40: Middle East & Africa Acaricides Industry Revenue (Million), by Consumption Analysis 2025 & 2033
- Figure 41: Middle East & Africa Acaricides Industry Revenue Share (%), by Consumption Analysis 2025 & 2033
- Figure 42: Middle East & Africa Acaricides Industry Revenue (Million), by Import Market Analysis (Value & Volume) 2025 & 2033
- Figure 43: Middle East & Africa Acaricides Industry Revenue Share (%), by Import Market Analysis (Value & Volume) 2025 & 2033
- Figure 44: Middle East & Africa Acaricides Industry Revenue (Million), by Export Market Analysis (Value & Volume) 2025 & 2033
- Figure 45: Middle East & Africa Acaricides Industry Revenue Share (%), by Export Market Analysis (Value & Volume) 2025 & 2033
- Figure 46: Middle East & Africa Acaricides Industry Revenue (Million), by Price Trend Analysis 2025 & 2033
- Figure 47: Middle East & Africa Acaricides Industry Revenue Share (%), by Price Trend Analysis 2025 & 2033
- Figure 48: Middle East & Africa Acaricides Industry Revenue (Million), by Country 2025 & 2033
- Figure 49: Middle East & Africa Acaricides Industry Revenue Share (%), by Country 2025 & 2033
- Figure 50: Asia Pacific Acaricides Industry Revenue (Million), by Production Analysis 2025 & 2033
- Figure 51: Asia Pacific Acaricides Industry Revenue Share (%), by Production Analysis 2025 & 2033
- Figure 52: Asia Pacific Acaricides Industry Revenue (Million), by Consumption Analysis 2025 & 2033
- Figure 53: Asia Pacific Acaricides Industry Revenue Share (%), by Consumption Analysis 2025 & 2033
- Figure 54: Asia Pacific Acaricides Industry Revenue (Million), by Import Market Analysis (Value & Volume) 2025 & 2033
- Figure 55: Asia Pacific Acaricides Industry Revenue Share (%), by Import Market Analysis (Value & Volume) 2025 & 2033
- Figure 56: Asia Pacific Acaricides Industry Revenue (Million), by Export Market Analysis (Value & Volume) 2025 & 2033
- Figure 57: Asia Pacific Acaricides Industry Revenue Share (%), by Export Market Analysis (Value & Volume) 2025 & 2033
- Figure 58: Asia Pacific Acaricides Industry Revenue (Million), by Price Trend Analysis 2025 & 2033
- Figure 59: Asia Pacific Acaricides Industry Revenue Share (%), by Price Trend Analysis 2025 & 2033
- Figure 60: Asia Pacific Acaricides Industry Revenue (Million), by Country 2025 & 2033
- Figure 61: Asia Pacific Acaricides Industry Revenue Share (%), by Country 2025 & 2033
List of Tables
- Table 1: Global Acaricides Industry Revenue Million Forecast, by Production Analysis 2020 & 2033
- Table 2: Global Acaricides Industry Revenue Million Forecast, by Consumption Analysis 2020 & 2033
- Table 3: Global Acaricides Industry Revenue Million Forecast, by Import Market Analysis (Value & Volume) 2020 & 2033
- Table 4: Global Acaricides Industry Revenue Million Forecast, by Export Market Analysis (Value & Volume) 2020 & 2033
- Table 5: Global Acaricides Industry Revenue Million Forecast, by Price Trend Analysis 2020 & 2033
- Table 6: Global Acaricides Industry Revenue Million Forecast, by Region 2020 & 2033
- Table 7: Global Acaricides Industry Revenue Million Forecast, by Production Analysis 2020 & 2033
- Table 8: Global Acaricides Industry Revenue Million Forecast, by Consumption Analysis 2020 & 2033
- Table 9: Global Acaricides Industry Revenue Million Forecast, by Import Market Analysis (Value & Volume) 2020 & 2033
- Table 10: Global Acaricides Industry Revenue Million Forecast, by Export Market Analysis (Value & Volume) 2020 & 2033
- Table 11: Global Acaricides Industry Revenue Million Forecast, by Price Trend Analysis 2020 & 2033
- Table 12: Global Acaricides Industry Revenue Million Forecast, by Country 2020 & 2033
- Table 13: United States Acaricides Industry Revenue (Million) Forecast, by Application 2020 & 2033
- Table 14: Canada Acaricides Industry Revenue (Million) Forecast, by Application 2020 & 2033
- Table 15: Mexico Acaricides Industry Revenue (Million) Forecast, by Application 2020 & 2033
- Table 16: Global Acaricides Industry Revenue Million Forecast, by Production Analysis 2020 & 2033
- Table 17: Global Acaricides Industry Revenue Million Forecast, by Consumption Analysis 2020 & 2033
- Table 18: Global Acaricides Industry Revenue Million Forecast, by Import Market Analysis (Value & Volume) 2020 & 2033
- Table 19: Global Acaricides Industry Revenue Million Forecast, by Export Market Analysis (Value & Volume) 2020 & 2033
- Table 20: Global Acaricides Industry Revenue Million Forecast, by Price Trend Analysis 2020 & 2033
- Table 21: Global Acaricides Industry Revenue Million Forecast, by Country 2020 & 2033
- Table 22: Brazil Acaricides Industry Revenue (Million) Forecast, by Application 2020 & 2033
- Table 23: Argentina Acaricides Industry Revenue (Million) Forecast, by Application 2020 & 2033
- Table 24: Rest of South America Acaricides Industry Revenue (Million) Forecast, by Application 2020 & 2033
- Table 25: Global Acaricides Industry Revenue Million Forecast, by Production Analysis 2020 & 2033
- Table 26: Global Acaricides Industry Revenue Million Forecast, by Consumption Analysis 2020 & 2033
- Table 27: Global Acaricides Industry Revenue Million Forecast, by Import Market Analysis (Value & Volume) 2020 & 2033
- Table 28: Global Acaricides Industry Revenue Million Forecast, by Export Market Analysis (Value & Volume) 2020 & 2033
- Table 29: Global Acaricides Industry Revenue Million Forecast, by Price Trend Analysis 2020 & 2033
- Table 30: Global Acaricides Industry Revenue Million Forecast, by Country 2020 & 2033
- Table 31: United Kingdom Acaricides Industry Revenue (Million) Forecast, by Application 2020 & 2033
- Table 32: Germany Acaricides Industry Revenue (Million) Forecast, by Application 2020 & 2033
- Table 33: France Acaricides Industry Revenue (Million) Forecast, by Application 2020 & 2033
- Table 34: Italy Acaricides Industry Revenue (Million) Forecast, by Application 2020 & 2033
- Table 35: Spain Acaricides Industry Revenue (Million) Forecast, by Application 2020 & 2033
- Table 36: Russia Acaricides Industry Revenue (Million) Forecast, by Application 2020 & 2033
- Table 37: Benelux Acaricides Industry Revenue (Million) Forecast, by Application 2020 & 2033
- Table 38: Nordics Acaricides Industry Revenue (Million) Forecast, by Application 2020 & 2033
- Table 39: Rest of Europe Acaricides Industry Revenue (Million) Forecast, by Application 2020 & 2033
- Table 40: Global Acaricides Industry Revenue Million Forecast, by Production Analysis 2020 & 2033
- Table 41: Global Acaricides Industry Revenue Million Forecast, by Consumption Analysis 2020 & 2033
- Table 42: Global Acaricides Industry Revenue Million Forecast, by Import Market Analysis (Value & Volume) 2020 & 2033
- Table 43: Global Acaricides Industry Revenue Million Forecast, by Export Market Analysis (Value & Volume) 2020 & 2033
- Table 44: Global Acaricides Industry Revenue Million Forecast, by Price Trend Analysis 2020 & 2033
- Table 45: Global Acaricides Industry Revenue Million Forecast, by Country 2020 & 2033
- Table 46: Turkey Acaricides Industry Revenue (Million) Forecast, by Application 2020 & 2033
- Table 47: Israel Acaricides Industry Revenue (Million) Forecast, by Application 2020 & 2033
- Table 48: GCC Acaricides Industry Revenue (Million) Forecast, by Application 2020 & 2033
- Table 49: North Africa Acaricides Industry Revenue (Million) Forecast, by Application 2020 & 2033
- Table 50: South Africa Acaricides Industry Revenue (Million) Forecast, by Application 2020 & 2033
- Table 51: Rest of Middle East & Africa Acaricides Industry Revenue (Million) Forecast, by Application 2020 & 2033
- Table 52: Global Acaricides Industry Revenue Million Forecast, by Production Analysis 2020 & 2033
- Table 53: Global Acaricides Industry Revenue Million Forecast, by Consumption Analysis 2020 & 2033
- Table 54: Global Acaricides Industry Revenue Million Forecast, by Import Market Analysis (Value & Volume) 2020 & 2033
- Table 55: Global Acaricides Industry Revenue Million Forecast, by Export Market Analysis (Value & Volume) 2020 & 2033
- Table 56: Global Acaricides Industry Revenue Million Forecast, by Price Trend Analysis 2020 & 2033
- Table 57: Global Acaricides Industry Revenue Million Forecast, by Country 2020 & 2033
- Table 58: China Acaricides Industry Revenue (Million) Forecast, by Application 2020 & 2033
- Table 59: India Acaricides Industry Revenue (Million) Forecast, by Application 2020 & 2033
- Table 60: Japan Acaricides Industry Revenue (Million) Forecast, by Application 2020 & 2033
- Table 61: South Korea Acaricides Industry Revenue (Million) Forecast, by Application 2020 & 2033
- Table 62: ASEAN Acaricides Industry Revenue (Million) Forecast, by Application 2020 & 2033
- Table 63: Oceania Acaricides Industry Revenue (Million) Forecast, by Application 2020 & 2033
- Table 64: Rest of Asia Pacific Acaricides Industry Revenue (Million) Forecast, by Application 2020 & 2033
Frequently Asked Questions
1. What is the projected Compound Annual Growth Rate (CAGR) of the Acaricides Industry?
The projected CAGR is approximately 5.00%.
2. Which companies are prominent players in the Acaricides Industry?
Key companies in the market include FMC Corporation, Nissan Chemical Industries Ltd, Syngenta International AG, UPL Limite, Bayer CropScience, Corteva Agriscience, BASF SE.
3. What are the main segments of the Acaricides Industry?
The market segments include Production Analysis, Consumption Analysis, Import Market Analysis (Value & Volume), Export Market Analysis (Value & Volume), Price Trend Analysis.
4. Can you provide details about the market size?
The market size is estimated to be USD 369.34 Million as of 2022.
5. What are some drivers contributing to market growth?
Shortage of Skilled Labor; Government Support to Enhance Farm Mechanization.
6. What are the notable trends driving market growth?
Increasing Demand for Natural Products.
7. Are there any restraints impacting market growth?
Heavy Initial Procurement Cost and High Expenditure on Maintenance.
8. Can you provide examples of recent developments in the market?
N/A
9. What pricing options are available for accessing the report?
Pricing options include single-user, multi-user, and enterprise licenses priced at USD 4750, USD 5250, and USD 8750 respectively.
10. Is the market size provided in terms of value or volume?
The market size is provided in terms of value, measured in Million.
11. Are there any specific market keywords associated with the report?
Yes, the market keyword associated with the report is "Acaricides Industry," which aids in identifying and referencing the specific market segment covered.
12. How do I determine which pricing option suits my needs best?
The pricing options vary based on user requirements and access needs. Individual users may opt for single-user licenses, while businesses requiring broader access may choose multi-user or enterprise licenses for cost-effective access to the report.
13. Are there any additional resources or data provided in the Acaricides Industry report?
While the report offers comprehensive insights, it's advisable to review the specific contents or supplementary materials provided to ascertain if additional resources or data are available.
14. How can I stay updated on further developments or reports in the Acaricides Industry?
To stay informed about further developments, trends, and reports in the Acaricides Industry, consider subscribing to industry newsletters, following relevant companies and organizations, or regularly checking reputable industry news sources and publications.
Methodology
Step 1 - Identification of Relevant Samples Size from Population Database


Step 2 - Approaches for Defining Global Market Size (Value, Volume* & Price*)

Note*: In applicable scenarios
Step 3 - Data Sources
Primary Research
- Web Analytics
- Survey Reports
- Research Institute
- Latest Research Reports
- Opinion Leaders
Secondary Research
- Annual Reports
- White Paper
- Latest Press Release
- Industry Association
- Paid Database
- Investor Presentations

Step 4 - Data Triangulation
Involves using different sources of information in order to increase the validity of a study
These sources are likely to be stakeholders in a program - participants, other researchers, program staff, other community members, and so on.
Then we put all data in single framework & apply various statistical tools to find out the dynamic on the market.
During the analysis stage, feedback from the stakeholder groups would be compared to determine areas of agreement as well as areas of divergence