
Key Insights
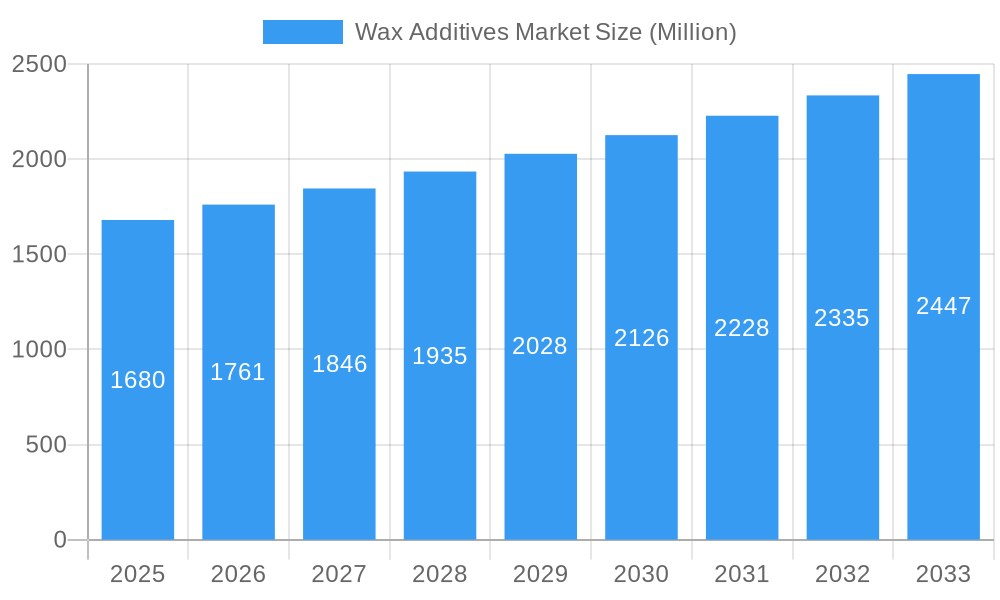
The global wax additives market, valued at $1.68 billion in 2025, is projected to experience robust growth, driven by increasing demand across diverse sectors. A compound annual growth rate (CAGR) of 4.95% from 2025 to 2033 indicates a significant expansion. This growth is fueled by several key factors. The burgeoning coatings industry, particularly in automotive and construction, is a major driver, as wax additives enhance durability, water resistance, and appearance. Furthermore, the rising popularity of sustainable and eco-friendly alternatives, such as natural wax additives, is contributing to market expansion. Growth in the leather finishing and printing ink sectors further propels the market. While challenges exist, such as fluctuating raw material prices and stringent environmental regulations, innovative product developments, focusing on improved performance and reduced environmental impact, are mitigating these restraints. The market is segmented by material type (natural, semi-synthetic, synthetic), form (dispersion, emulsion, micronized), and application (coatings, leather finishing, printing inks, candles, and others like plastic processing, adhesives, and rubber additives). Key players like Honeywell, Clariant, Arkema, and BASF are actively involved in research and development, fostering innovation and competition. Regional analysis reveals significant growth potential in Asia-Pacific, driven by rapid industrialization and rising disposable incomes, while North America and Europe maintain substantial market shares due to established industries and high consumption rates.
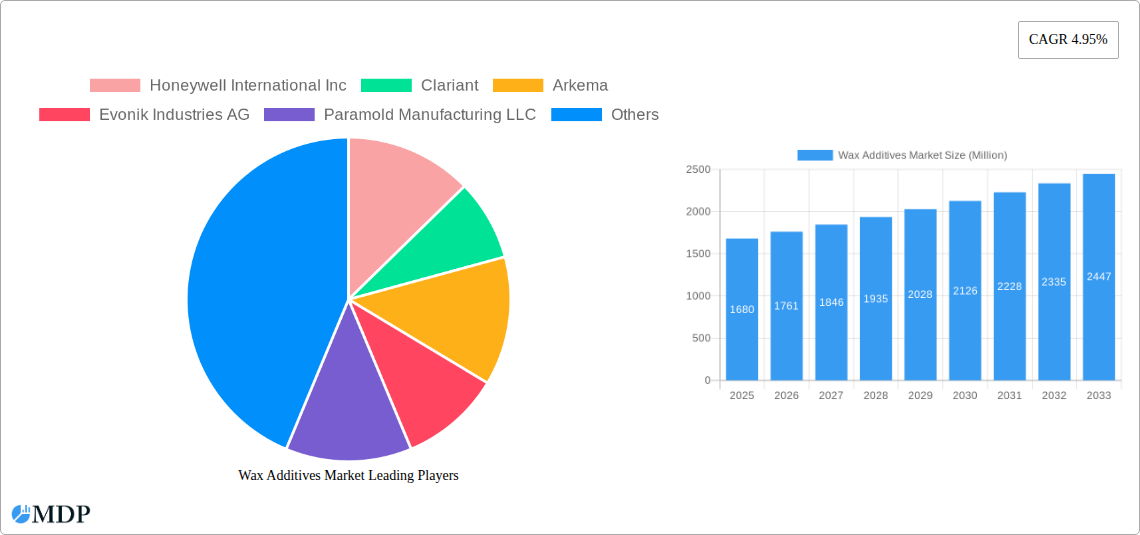
Wax Additives Market Market Size (In Billion)
The market's future trajectory hinges on several factors. Continued innovation in wax additive formulations, focusing on enhanced performance characteristics such as scratch resistance, UV protection, and improved dispersibility, will be crucial for sustained growth. Furthermore, the adoption of sustainable manufacturing practices and the development of bio-based wax additives are likely to gain momentum, responding to increasing environmental concerns. Competitive dynamics will also play a significant role, with established players investing heavily in R&D and expanding their product portfolios to meet evolving market demands. The market’s success will depend on its ability to adapt to changing regulations and consumer preferences, embracing sustainable practices and delivering superior product performance across a range of applications.
Wax Additives Market Company Market Share
Wax Additives Market: A Comprehensive Report (2019-2033)
This comprehensive report provides an in-depth analysis of the global Wax Additives Market, covering the period from 2019 to 2033. With a focus on key market dynamics, trends, and leading players, this report offers actionable insights for industry stakeholders seeking to navigate this evolving landscape. The report incorporates data from 2019-2024 (Historical Period), and utilizes 2025 as the Base Year and Estimated Year, projecting market trends until 2033 (Forecast Period). The market is valued in Millions USD throughout.
Wax Additives Market Market Dynamics & Concentration
The global Wax Additives Market exhibits a moderately concentrated landscape, with key players such as Honeywell International Inc, Clariant, Arkema, Evonik Industries AG, and BASF SE holding significant market share. Market concentration is influenced by factors such as economies of scale, research and development capabilities, and global distribution networks. Innovation drives market growth, with continuous advancements in wax formulations enhancing performance characteristics across various applications. Stringent regulatory frameworks related to environmental concerns and product safety play a crucial role in shaping market dynamics, pushing companies to develop sustainable and compliant solutions. The presence of substitute materials, such as polymers and silicones, poses a competitive challenge, compelling wax additive manufacturers to innovate and offer superior value propositions. End-user trends, particularly in the coatings, packaging, and automotive industries, significantly impact demand, while mergers and acquisitions (M&A) activities reshape market structure. The past five years have witnessed xx M&A deals, contributing to consolidation and reshaping competitive dynamics. Leading companies hold an estimated xx% of the market share collectively.
Wax Additives Market Industry Trends & Analysis
The Wax Additives Market is experiencing robust growth, projected to achieve a Compound Annual Growth Rate (CAGR) of xx% during the forecast period (2025-2033). This growth is fueled by increasing demand from various end-use sectors, including coatings, printing inks, and plastics processing. Technological advancements in wax formulations, leading to enhanced performance characteristics such as improved water resistance, scratch resistance, and UV stability, are driving market expansion. Consumer preferences towards high-quality, durable, and eco-friendly products are also influencing market growth. The competitive landscape is characterized by intense rivalry among established players and emerging entrants, leading to price competition and product differentiation strategies. Market penetration in developing economies is steadily increasing, with emerging markets driving significant growth opportunities due to infrastructure developments and rising industrialization.
Leading Markets & Segments in Wax Additives Market
The coatings application segment currently dominates the Wax Additives Market, accounting for approximately xx% of the total market value. This dominance is driven by the increasing demand for high-performance coatings in various industries, including automotive, construction, and furniture. The synthetic material segment holds a substantial share owing to its superior performance characteristics compared to natural and semi-synthetic alternatives. Within the type segment, micronized waxes are experiencing significant growth due to their enhanced dispersion and rheological properties.
Key Drivers for Coatings Application Dominance:
- Growing construction activities.
- Rising automotive production.
- Increasing demand for high-performance coatings.
Key Drivers for Synthetic Material Segment:
- Superior performance characteristics.
- Cost-effectiveness in certain applications.
- Growing adoption in high-performance coatings.
Geographically, North America currently holds a leading position in the market followed by Europe, driven by robust industrial activity, stringent environmental regulations prompting the use of advanced wax additives, and the presence of major manufacturers. Asia-Pacific is expected to experience significant growth during the forecast period due to rapid industrialization and increasing consumer demand.
Wax Additives Market Product Developments
Recent product innovations focus on developing sustainable, high-performance wax additives that meet stringent environmental regulations. These include water-based wax emulsions and other specialty additives, catering to the growing demand for environmentally friendly products in various applications. Manufacturers are also focusing on enhancing product performance characteristics such as improved dispersion, rheology, and compatibility with various resins and polymers. This strategic approach leverages technological advancements to provide a competitive advantage in the market.
Key Drivers of Wax Additives Market Growth
Several factors contribute to the Wax Additives Market's growth. Technological advancements, including the development of novel wax formulations with improved properties, are key drivers. Economic growth in developing countries and increasing industrialization are also boosting demand. Favorable government policies and regulations promoting sustainable materials are further accelerating market expansion. For example, the EU's REACH regulation is driving the development of environmentally friendly wax additives.
Challenges in the Wax Additives Market Market
The Wax Additives Market faces challenges such as fluctuating raw material prices, impacting production costs and profitability. Stringent environmental regulations can increase compliance costs. Intense competition among established players and new entrants puts pressure on pricing and profitability margins, with an estimated xx% decrease in profit margins observed in the past 2 years. Supply chain disruptions, particularly during periods of geopolitical instability, also pose a significant risk to market stability.
Emerging Opportunities in Wax Additives Market
The Wax Additives Market presents opportunities in developing sustainable and bio-based wax alternatives. Strategic partnerships and collaborations between manufacturers and end-users can create synergistic growth. Expanding into new and emerging markets, particularly in Asia-Pacific and Latin America, presents significant growth potential. Investing in research and development to develop innovative wax additives with enhanced performance characteristics can lead to a competitive advantage in this dynamic market.
Leading Players in the Wax Additives Market Sector
- Honeywell International Inc
- Clariant
- Arkema
- Evonik Industries AG
- Paramold Manufacturing LLC
- BASF SE
- Shamrock Technologies Inc
- The Lubrizol Corporation
- Tianshi Wax
- BYK-CHEMIE GmbH
- Münzing Corporation
- Innospec
- Concentrol
Key Milestones in Wax Additives Market Industry
- July 2022: Münzing Corporation announced the start-up of a new plant in Zeitz Chemical and Industrial Park, focusing on water-based wax emulsions and other specialty additives. The EUR 50 million (USD 5.19 million) investment significantly expands their production capacity.
- January 2022: Shamrock Technologies, Inc. announced a USD 19.4 million investment to establish operations in Laurens County, South Carolina, focusing on micronized wax, dispersions, and emulsions. This expansion strengthens their presence in the North American market.
Strategic Outlook for Wax Additives Market Market
The Wax Additives Market is poised for continued growth, driven by increasing demand from various end-use sectors and technological advancements. Strategic opportunities lie in developing sustainable and high-performance products, expanding into new markets, and fostering strategic partnerships. Companies focusing on innovation, sustainability, and efficient supply chain management will be well-positioned to capitalize on the market's growth potential in the coming years.
Wax Additives Market Segmentation
-
1. Material
- 1.1. Natural
- 1.2. Semi-synthetic
- 1.3. Synthetic
-
2. Type
- 2.1. Dispersion
- 2.2. Emulsion
- 2.3. Micronized
-
3. Application
- 3.1. Coatings
- 3.2. Leather Finishing
- 3.3. Printing Ink
- 3.4. Candles
- 3.5. Other Ap
Wax Additives Market Segmentation By Geography
-
1. Asia Pacific
- 1.1. China
- 1.2. India
- 1.3. Japan
- 1.4. South Korea
- 1.5. Rest of Asia Pacific
-
2. North America
- 2.1. United States
- 2.2. Canada
- 2.3. Mexico
-
3. Europe
- 3.1. Germany
- 3.2. United Kingdom
- 3.3. Italy
- 3.4. France
- 3.5. Rest of Europe
-
4. South America
- 4.1. Brazil
- 4.2. Argentina
- 4.3. Rest of South America
-
5. Middle East and Africa
- 5.1. Saudi Arabia
- 5.2. South Africa
- 5.3. Rest of Middle East and Africa
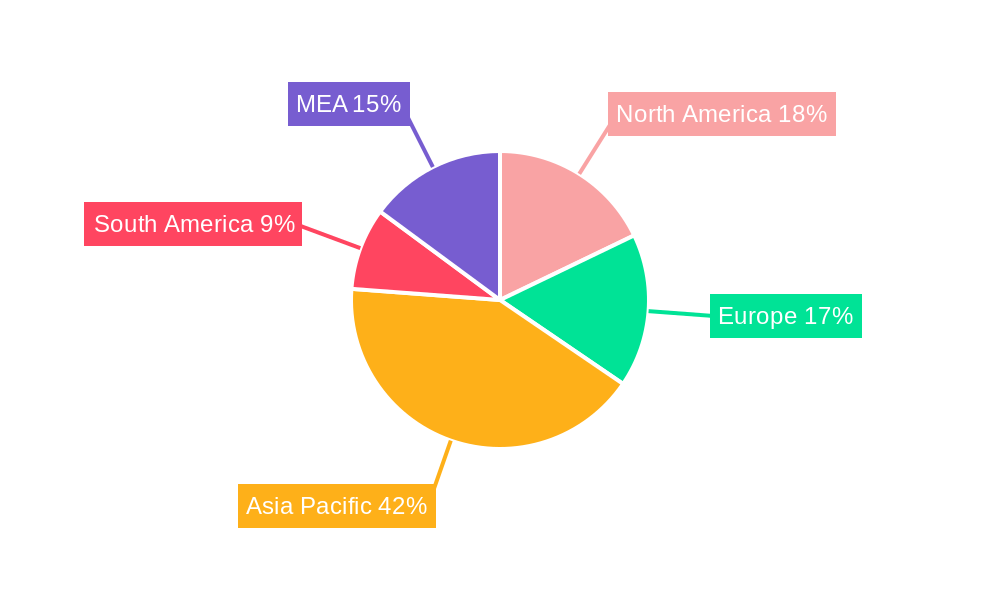
Wax Additives Market Regional Market Share
Geographic Coverage of Wax Additives Market
Wax Additives Market REPORT HIGHLIGHTS
| Aspects | Details |
|---|---|
| Study Period | 2020-2034 |
| Base Year | 2025 |
| Estimated Year | 2026 |
| Forecast Period | 2026-2034 |
| Historical Period | 2020-2025 |
| Growth Rate | CAGR of 4.95% from 2020-2034 |
| Segmentation |
|
Table of Contents
- 1. Introduction
- 1.1. Research Scope
- 1.2. Market Segmentation
- 1.3. Research Methodology
- 1.4. Definitions and Assumptions
- 2. Executive Summary
- 2.1. Introduction
- 3. Market Dynamics
- 3.1. Introduction
- 3.2. Market Drivers
- 3.2.1. Growing Consumption of Candles in Home Decor and Health Centers; Wax Additives Benefits in Coatings and Inks
- 3.3. Market Restrains
- 3.3.1. Volatility in Crude Oil Price
- 3.4. Market Trends
- 3.4.1. Wax Additives Expected to find High Demand in Coatings Segment
- 4. Market Factor Analysis
- 4.1. Porters Five Forces
- 4.2. Supply/Value Chain
- 4.3. PESTEL analysis
- 4.4. Market Entropy
- 4.5. Patent/Trademark Analysis
- 5. Global Wax Additives Market Analysis, Insights and Forecast, 2020-2032
- 5.1. Market Analysis, Insights and Forecast - by Material
- 5.1.1. Natural
- 5.1.2. Semi-synthetic
- 5.1.3. Synthetic
- 5.2. Market Analysis, Insights and Forecast - by Type
- 5.2.1. Dispersion
- 5.2.2. Emulsion
- 5.2.3. Micronized
- 5.3. Market Analysis, Insights and Forecast - by Application
- 5.3.1. Coatings
- 5.3.2. Leather Finishing
- 5.3.3. Printing Ink
- 5.3.4. Candles
- 5.3.5. Other Ap
- 5.4. Market Analysis, Insights and Forecast - by Region
- 5.4.1. Asia Pacific
- 5.4.2. North America
- 5.4.3. Europe
- 5.4.4. South America
- 5.4.5. Middle East and Africa
- 5.1. Market Analysis, Insights and Forecast - by Material
- 6. Asia Pacific Wax Additives Market Analysis, Insights and Forecast, 2020-2032
- 6.1. Market Analysis, Insights and Forecast - by Material
- 6.1.1. Natural
- 6.1.2. Semi-synthetic
- 6.1.3. Synthetic
- 6.2. Market Analysis, Insights and Forecast - by Type
- 6.2.1. Dispersion
- 6.2.2. Emulsion
- 6.2.3. Micronized
- 6.3. Market Analysis, Insights and Forecast - by Application
- 6.3.1. Coatings
- 6.3.2. Leather Finishing
- 6.3.3. Printing Ink
- 6.3.4. Candles
- 6.3.5. Other Ap
- 6.1. Market Analysis, Insights and Forecast - by Material
- 7. North America Wax Additives Market Analysis, Insights and Forecast, 2020-2032
- 7.1. Market Analysis, Insights and Forecast - by Material
- 7.1.1. Natural
- 7.1.2. Semi-synthetic
- 7.1.3. Synthetic
- 7.2. Market Analysis, Insights and Forecast - by Type
- 7.2.1. Dispersion
- 7.2.2. Emulsion
- 7.2.3. Micronized
- 7.3. Market Analysis, Insights and Forecast - by Application
- 7.3.1. Coatings
- 7.3.2. Leather Finishing
- 7.3.3. Printing Ink
- 7.3.4. Candles
- 7.3.5. Other Ap
- 7.1. Market Analysis, Insights and Forecast - by Material
- 8. Europe Wax Additives Market Analysis, Insights and Forecast, 2020-2032
- 8.1. Market Analysis, Insights and Forecast - by Material
- 8.1.1. Natural
- 8.1.2. Semi-synthetic
- 8.1.3. Synthetic
- 8.2. Market Analysis, Insights and Forecast - by Type
- 8.2.1. Dispersion
- 8.2.2. Emulsion
- 8.2.3. Micronized
- 8.3. Market Analysis, Insights and Forecast - by Application
- 8.3.1. Coatings
- 8.3.2. Leather Finishing
- 8.3.3. Printing Ink
- 8.3.4. Candles
- 8.3.5. Other Ap
- 8.1. Market Analysis, Insights and Forecast - by Material
- 9. South America Wax Additives Market Analysis, Insights and Forecast, 2020-2032
- 9.1. Market Analysis, Insights and Forecast - by Material
- 9.1.1. Natural
- 9.1.2. Semi-synthetic
- 9.1.3. Synthetic
- 9.2. Market Analysis, Insights and Forecast - by Type
- 9.2.1. Dispersion
- 9.2.2. Emulsion
- 9.2.3. Micronized
- 9.3. Market Analysis, Insights and Forecast - by Application
- 9.3.1. Coatings
- 9.3.2. Leather Finishing
- 9.3.3. Printing Ink
- 9.3.4. Candles
- 9.3.5. Other Ap
- 9.1. Market Analysis, Insights and Forecast - by Material
- 10. Middle East and Africa Wax Additives Market Analysis, Insights and Forecast, 2020-2032
- 10.1. Market Analysis, Insights and Forecast - by Material
- 10.1.1. Natural
- 10.1.2. Semi-synthetic
- 10.1.3. Synthetic
- 10.2. Market Analysis, Insights and Forecast - by Type
- 10.2.1. Dispersion
- 10.2.2. Emulsion
- 10.2.3. Micronized
- 10.3. Market Analysis, Insights and Forecast - by Application
- 10.3.1. Coatings
- 10.3.2. Leather Finishing
- 10.3.3. Printing Ink
- 10.3.4. Candles
- 10.3.5. Other Ap
- 10.1. Market Analysis, Insights and Forecast - by Material
- 11. Competitive Analysis
- 11.1. Global Market Share Analysis 2025
- 11.2. Company Profiles
- 11.2.1 Honeywell International Inc
- 11.2.1.1. Overview
- 11.2.1.2. Products
- 11.2.1.3. SWOT Analysis
- 11.2.1.4. Recent Developments
- 11.2.1.5. Financials (Based on Availability)
- 11.2.2 Clariant
- 11.2.2.1. Overview
- 11.2.2.2. Products
- 11.2.2.3. SWOT Analysis
- 11.2.2.4. Recent Developments
- 11.2.2.5. Financials (Based on Availability)
- 11.2.3 Arkema
- 11.2.3.1. Overview
- 11.2.3.2. Products
- 11.2.3.3. SWOT Analysis
- 11.2.3.4. Recent Developments
- 11.2.3.5. Financials (Based on Availability)
- 11.2.4 Evonik Industries AG
- 11.2.4.1. Overview
- 11.2.4.2. Products
- 11.2.4.3. SWOT Analysis
- 11.2.4.4. Recent Developments
- 11.2.4.5. Financials (Based on Availability)
- 11.2.5 Paramold Manufacturing LLC
- 11.2.5.1. Overview
- 11.2.5.2. Products
- 11.2.5.3. SWOT Analysis
- 11.2.5.4. Recent Developments
- 11.2.5.5. Financials (Based on Availability)
- 11.2.6 BASF SE
- 11.2.6.1. Overview
- 11.2.6.2. Products
- 11.2.6.3. SWOT Analysis
- 11.2.6.4. Recent Developments
- 11.2.6.5. Financials (Based on Availability)
- 11.2.7 Shamrock Technologies Inc
- 11.2.7.1. Overview
- 11.2.7.2. Products
- 11.2.7.3. SWOT Analysis
- 11.2.7.4. Recent Developments
- 11.2.7.5. Financials (Based on Availability)
- 11.2.8 The Lubrizol Corporation
- 11.2.8.1. Overview
- 11.2.8.2. Products
- 11.2.8.3. SWOT Analysis
- 11.2.8.4. Recent Developments
- 11.2.8.5. Financials (Based on Availability)
- 11.2.9 Tianshi Wax
- 11.2.9.1. Overview
- 11.2.9.2. Products
- 11.2.9.3. SWOT Analysis
- 11.2.9.4. Recent Developments
- 11.2.9.5. Financials (Based on Availability)
- 11.2.10 BYK-CHEMIE GmbH
- 11.2.10.1. Overview
- 11.2.10.2. Products
- 11.2.10.3. SWOT Analysis
- 11.2.10.4. Recent Developments
- 11.2.10.5. Financials (Based on Availability)
- 11.2.11 Münzing Corporation
- 11.2.11.1. Overview
- 11.2.11.2. Products
- 11.2.11.3. SWOT Analysis
- 11.2.11.4. Recent Developments
- 11.2.11.5. Financials (Based on Availability)
- 11.2.12 Innospec
- 11.2.12.1. Overview
- 11.2.12.2. Products
- 11.2.12.3. SWOT Analysis
- 11.2.12.4. Recent Developments
- 11.2.12.5. Financials (Based on Availability)
- 11.2.13 Concentrol
- 11.2.13.1. Overview
- 11.2.13.2. Products
- 11.2.13.3. SWOT Analysis
- 11.2.13.4. Recent Developments
- 11.2.13.5. Financials (Based on Availability)
- 11.2.1 Honeywell International Inc
List of Figures
- Figure 1: Global Wax Additives Market Revenue Breakdown (Million, %) by Region 2025 & 2033
- Figure 2: Global Wax Additives Market Volume Breakdown (K Tons, %) by Region 2025 & 2033
- Figure 3: Asia Pacific Wax Additives Market Revenue (Million), by Material 2025 & 2033
- Figure 4: Asia Pacific Wax Additives Market Volume (K Tons), by Material 2025 & 2033
- Figure 5: Asia Pacific Wax Additives Market Revenue Share (%), by Material 2025 & 2033
- Figure 6: Asia Pacific Wax Additives Market Volume Share (%), by Material 2025 & 2033
- Figure 7: Asia Pacific Wax Additives Market Revenue (Million), by Type 2025 & 2033
- Figure 8: Asia Pacific Wax Additives Market Volume (K Tons), by Type 2025 & 2033
- Figure 9: Asia Pacific Wax Additives Market Revenue Share (%), by Type 2025 & 2033
- Figure 10: Asia Pacific Wax Additives Market Volume Share (%), by Type 2025 & 2033
- Figure 11: Asia Pacific Wax Additives Market Revenue (Million), by Application 2025 & 2033
- Figure 12: Asia Pacific Wax Additives Market Volume (K Tons), by Application 2025 & 2033
- Figure 13: Asia Pacific Wax Additives Market Revenue Share (%), by Application 2025 & 2033
- Figure 14: Asia Pacific Wax Additives Market Volume Share (%), by Application 2025 & 2033
- Figure 15: Asia Pacific Wax Additives Market Revenue (Million), by Country 2025 & 2033
- Figure 16: Asia Pacific Wax Additives Market Volume (K Tons), by Country 2025 & 2033
- Figure 17: Asia Pacific Wax Additives Market Revenue Share (%), by Country 2025 & 2033
- Figure 18: Asia Pacific Wax Additives Market Volume Share (%), by Country 2025 & 2033
- Figure 19: North America Wax Additives Market Revenue (Million), by Material 2025 & 2033
- Figure 20: North America Wax Additives Market Volume (K Tons), by Material 2025 & 2033
- Figure 21: North America Wax Additives Market Revenue Share (%), by Material 2025 & 2033
- Figure 22: North America Wax Additives Market Volume Share (%), by Material 2025 & 2033
- Figure 23: North America Wax Additives Market Revenue (Million), by Type 2025 & 2033
- Figure 24: North America Wax Additives Market Volume (K Tons), by Type 2025 & 2033
- Figure 25: North America Wax Additives Market Revenue Share (%), by Type 2025 & 2033
- Figure 26: North America Wax Additives Market Volume Share (%), by Type 2025 & 2033
- Figure 27: North America Wax Additives Market Revenue (Million), by Application 2025 & 2033
- Figure 28: North America Wax Additives Market Volume (K Tons), by Application 2025 & 2033
- Figure 29: North America Wax Additives Market Revenue Share (%), by Application 2025 & 2033
- Figure 30: North America Wax Additives Market Volume Share (%), by Application 2025 & 2033
- Figure 31: North America Wax Additives Market Revenue (Million), by Country 2025 & 2033
- Figure 32: North America Wax Additives Market Volume (K Tons), by Country 2025 & 2033
- Figure 33: North America Wax Additives Market Revenue Share (%), by Country 2025 & 2033
- Figure 34: North America Wax Additives Market Volume Share (%), by Country 2025 & 2033
- Figure 35: Europe Wax Additives Market Revenue (Million), by Material 2025 & 2033
- Figure 36: Europe Wax Additives Market Volume (K Tons), by Material 2025 & 2033
- Figure 37: Europe Wax Additives Market Revenue Share (%), by Material 2025 & 2033
- Figure 38: Europe Wax Additives Market Volume Share (%), by Material 2025 & 2033
- Figure 39: Europe Wax Additives Market Revenue (Million), by Type 2025 & 2033
- Figure 40: Europe Wax Additives Market Volume (K Tons), by Type 2025 & 2033
- Figure 41: Europe Wax Additives Market Revenue Share (%), by Type 2025 & 2033
- Figure 42: Europe Wax Additives Market Volume Share (%), by Type 2025 & 2033
- Figure 43: Europe Wax Additives Market Revenue (Million), by Application 2025 & 2033
- Figure 44: Europe Wax Additives Market Volume (K Tons), by Application 2025 & 2033
- Figure 45: Europe Wax Additives Market Revenue Share (%), by Application 2025 & 2033
- Figure 46: Europe Wax Additives Market Volume Share (%), by Application 2025 & 2033
- Figure 47: Europe Wax Additives Market Revenue (Million), by Country 2025 & 2033
- Figure 48: Europe Wax Additives Market Volume (K Tons), by Country 2025 & 2033
- Figure 49: Europe Wax Additives Market Revenue Share (%), by Country 2025 & 2033
- Figure 50: Europe Wax Additives Market Volume Share (%), by Country 2025 & 2033
- Figure 51: South America Wax Additives Market Revenue (Million), by Material 2025 & 2033
- Figure 52: South America Wax Additives Market Volume (K Tons), by Material 2025 & 2033
- Figure 53: South America Wax Additives Market Revenue Share (%), by Material 2025 & 2033
- Figure 54: South America Wax Additives Market Volume Share (%), by Material 2025 & 2033
- Figure 55: South America Wax Additives Market Revenue (Million), by Type 2025 & 2033
- Figure 56: South America Wax Additives Market Volume (K Tons), by Type 2025 & 2033
- Figure 57: South America Wax Additives Market Revenue Share (%), by Type 2025 & 2033
- Figure 58: South America Wax Additives Market Volume Share (%), by Type 2025 & 2033
- Figure 59: South America Wax Additives Market Revenue (Million), by Application 2025 & 2033
- Figure 60: South America Wax Additives Market Volume (K Tons), by Application 2025 & 2033
- Figure 61: South America Wax Additives Market Revenue Share (%), by Application 2025 & 2033
- Figure 62: South America Wax Additives Market Volume Share (%), by Application 2025 & 2033
- Figure 63: South America Wax Additives Market Revenue (Million), by Country 2025 & 2033
- Figure 64: South America Wax Additives Market Volume (K Tons), by Country 2025 & 2033
- Figure 65: South America Wax Additives Market Revenue Share (%), by Country 2025 & 2033
- Figure 66: South America Wax Additives Market Volume Share (%), by Country 2025 & 2033
- Figure 67: Middle East and Africa Wax Additives Market Revenue (Million), by Material 2025 & 2033
- Figure 68: Middle East and Africa Wax Additives Market Volume (K Tons), by Material 2025 & 2033
- Figure 69: Middle East and Africa Wax Additives Market Revenue Share (%), by Material 2025 & 2033
- Figure 70: Middle East and Africa Wax Additives Market Volume Share (%), by Material 2025 & 2033
- Figure 71: Middle East and Africa Wax Additives Market Revenue (Million), by Type 2025 & 2033
- Figure 72: Middle East and Africa Wax Additives Market Volume (K Tons), by Type 2025 & 2033
- Figure 73: Middle East and Africa Wax Additives Market Revenue Share (%), by Type 2025 & 2033
- Figure 74: Middle East and Africa Wax Additives Market Volume Share (%), by Type 2025 & 2033
- Figure 75: Middle East and Africa Wax Additives Market Revenue (Million), by Application 2025 & 2033
- Figure 76: Middle East and Africa Wax Additives Market Volume (K Tons), by Application 2025 & 2033
- Figure 77: Middle East and Africa Wax Additives Market Revenue Share (%), by Application 2025 & 2033
- Figure 78: Middle East and Africa Wax Additives Market Volume Share (%), by Application 2025 & 2033
- Figure 79: Middle East and Africa Wax Additives Market Revenue (Million), by Country 2025 & 2033
- Figure 80: Middle East and Africa Wax Additives Market Volume (K Tons), by Country 2025 & 2033
- Figure 81: Middle East and Africa Wax Additives Market Revenue Share (%), by Country 2025 & 2033
- Figure 82: Middle East and Africa Wax Additives Market Volume Share (%), by Country 2025 & 2033
List of Tables
- Table 1: Global Wax Additives Market Revenue Million Forecast, by Material 2020 & 2033
- Table 2: Global Wax Additives Market Volume K Tons Forecast, by Material 2020 & 2033
- Table 3: Global Wax Additives Market Revenue Million Forecast, by Type 2020 & 2033
- Table 4: Global Wax Additives Market Volume K Tons Forecast, by Type 2020 & 2033
- Table 5: Global Wax Additives Market Revenue Million Forecast, by Application 2020 & 2033
- Table 6: Global Wax Additives Market Volume K Tons Forecast, by Application 2020 & 2033
- Table 7: Global Wax Additives Market Revenue Million Forecast, by Region 2020 & 2033
- Table 8: Global Wax Additives Market Volume K Tons Forecast, by Region 2020 & 2033
- Table 9: Global Wax Additives Market Revenue Million Forecast, by Material 2020 & 2033
- Table 10: Global Wax Additives Market Volume K Tons Forecast, by Material 2020 & 2033
- Table 11: Global Wax Additives Market Revenue Million Forecast, by Type 2020 & 2033
- Table 12: Global Wax Additives Market Volume K Tons Forecast, by Type 2020 & 2033
- Table 13: Global Wax Additives Market Revenue Million Forecast, by Application 2020 & 2033
- Table 14: Global Wax Additives Market Volume K Tons Forecast, by Application 2020 & 2033
- Table 15: Global Wax Additives Market Revenue Million Forecast, by Country 2020 & 2033
- Table 16: Global Wax Additives Market Volume K Tons Forecast, by Country 2020 & 2033
- Table 17: China Wax Additives Market Revenue (Million) Forecast, by Application 2020 & 2033
- Table 18: China Wax Additives Market Volume (K Tons) Forecast, by Application 2020 & 2033
- Table 19: India Wax Additives Market Revenue (Million) Forecast, by Application 2020 & 2033
- Table 20: India Wax Additives Market Volume (K Tons) Forecast, by Application 2020 & 2033
- Table 21: Japan Wax Additives Market Revenue (Million) Forecast, by Application 2020 & 2033
- Table 22: Japan Wax Additives Market Volume (K Tons) Forecast, by Application 2020 & 2033
- Table 23: South Korea Wax Additives Market Revenue (Million) Forecast, by Application 2020 & 2033
- Table 24: South Korea Wax Additives Market Volume (K Tons) Forecast, by Application 2020 & 2033
- Table 25: Rest of Asia Pacific Wax Additives Market Revenue (Million) Forecast, by Application 2020 & 2033
- Table 26: Rest of Asia Pacific Wax Additives Market Volume (K Tons) Forecast, by Application 2020 & 2033
- Table 27: Global Wax Additives Market Revenue Million Forecast, by Material 2020 & 2033
- Table 28: Global Wax Additives Market Volume K Tons Forecast, by Material 2020 & 2033
- Table 29: Global Wax Additives Market Revenue Million Forecast, by Type 2020 & 2033
- Table 30: Global Wax Additives Market Volume K Tons Forecast, by Type 2020 & 2033
- Table 31: Global Wax Additives Market Revenue Million Forecast, by Application 2020 & 2033
- Table 32: Global Wax Additives Market Volume K Tons Forecast, by Application 2020 & 2033
- Table 33: Global Wax Additives Market Revenue Million Forecast, by Country 2020 & 2033
- Table 34: Global Wax Additives Market Volume K Tons Forecast, by Country 2020 & 2033
- Table 35: United States Wax Additives Market Revenue (Million) Forecast, by Application 2020 & 2033
- Table 36: United States Wax Additives Market Volume (K Tons) Forecast, by Application 2020 & 2033
- Table 37: Canada Wax Additives Market Revenue (Million) Forecast, by Application 2020 & 2033
- Table 38: Canada Wax Additives Market Volume (K Tons) Forecast, by Application 2020 & 2033
- Table 39: Mexico Wax Additives Market Revenue (Million) Forecast, by Application 2020 & 2033
- Table 40: Mexico Wax Additives Market Volume (K Tons) Forecast, by Application 2020 & 2033
- Table 41: Global Wax Additives Market Revenue Million Forecast, by Material 2020 & 2033
- Table 42: Global Wax Additives Market Volume K Tons Forecast, by Material 2020 & 2033
- Table 43: Global Wax Additives Market Revenue Million Forecast, by Type 2020 & 2033
- Table 44: Global Wax Additives Market Volume K Tons Forecast, by Type 2020 & 2033
- Table 45: Global Wax Additives Market Revenue Million Forecast, by Application 2020 & 2033
- Table 46: Global Wax Additives Market Volume K Tons Forecast, by Application 2020 & 2033
- Table 47: Global Wax Additives Market Revenue Million Forecast, by Country 2020 & 2033
- Table 48: Global Wax Additives Market Volume K Tons Forecast, by Country 2020 & 2033
- Table 49: Germany Wax Additives Market Revenue (Million) Forecast, by Application 2020 & 2033
- Table 50: Germany Wax Additives Market Volume (K Tons) Forecast, by Application 2020 & 2033
- Table 51: United Kingdom Wax Additives Market Revenue (Million) Forecast, by Application 2020 & 2033
- Table 52: United Kingdom Wax Additives Market Volume (K Tons) Forecast, by Application 2020 & 2033
- Table 53: Italy Wax Additives Market Revenue (Million) Forecast, by Application 2020 & 2033
- Table 54: Italy Wax Additives Market Volume (K Tons) Forecast, by Application 2020 & 2033
- Table 55: France Wax Additives Market Revenue (Million) Forecast, by Application 2020 & 2033
- Table 56: France Wax Additives Market Volume (K Tons) Forecast, by Application 2020 & 2033
- Table 57: Rest of Europe Wax Additives Market Revenue (Million) Forecast, by Application 2020 & 2033
- Table 58: Rest of Europe Wax Additives Market Volume (K Tons) Forecast, by Application 2020 & 2033
- Table 59: Global Wax Additives Market Revenue Million Forecast, by Material 2020 & 2033
- Table 60: Global Wax Additives Market Volume K Tons Forecast, by Material 2020 & 2033
- Table 61: Global Wax Additives Market Revenue Million Forecast, by Type 2020 & 2033
- Table 62: Global Wax Additives Market Volume K Tons Forecast, by Type 2020 & 2033
- Table 63: Global Wax Additives Market Revenue Million Forecast, by Application 2020 & 2033
- Table 64: Global Wax Additives Market Volume K Tons Forecast, by Application 2020 & 2033
- Table 65: Global Wax Additives Market Revenue Million Forecast, by Country 2020 & 2033
- Table 66: Global Wax Additives Market Volume K Tons Forecast, by Country 2020 & 2033
- Table 67: Brazil Wax Additives Market Revenue (Million) Forecast, by Application 2020 & 2033
- Table 68: Brazil Wax Additives Market Volume (K Tons) Forecast, by Application 2020 & 2033
- Table 69: Argentina Wax Additives Market Revenue (Million) Forecast, by Application 2020 & 2033
- Table 70: Argentina Wax Additives Market Volume (K Tons) Forecast, by Application 2020 & 2033
- Table 71: Rest of South America Wax Additives Market Revenue (Million) Forecast, by Application 2020 & 2033
- Table 72: Rest of South America Wax Additives Market Volume (K Tons) Forecast, by Application 2020 & 2033
- Table 73: Global Wax Additives Market Revenue Million Forecast, by Material 2020 & 2033
- Table 74: Global Wax Additives Market Volume K Tons Forecast, by Material 2020 & 2033
- Table 75: Global Wax Additives Market Revenue Million Forecast, by Type 2020 & 2033
- Table 76: Global Wax Additives Market Volume K Tons Forecast, by Type 2020 & 2033
- Table 77: Global Wax Additives Market Revenue Million Forecast, by Application 2020 & 2033
- Table 78: Global Wax Additives Market Volume K Tons Forecast, by Application 2020 & 2033
- Table 79: Global Wax Additives Market Revenue Million Forecast, by Country 2020 & 2033
- Table 80: Global Wax Additives Market Volume K Tons Forecast, by Country 2020 & 2033
- Table 81: Saudi Arabia Wax Additives Market Revenue (Million) Forecast, by Application 2020 & 2033
- Table 82: Saudi Arabia Wax Additives Market Volume (K Tons) Forecast, by Application 2020 & 2033
- Table 83: South Africa Wax Additives Market Revenue (Million) Forecast, by Application 2020 & 2033
- Table 84: South Africa Wax Additives Market Volume (K Tons) Forecast, by Application 2020 & 2033
- Table 85: Rest of Middle East and Africa Wax Additives Market Revenue (Million) Forecast, by Application 2020 & 2033
- Table 86: Rest of Middle East and Africa Wax Additives Market Volume (K Tons) Forecast, by Application 2020 & 2033
Frequently Asked Questions
1. What is the projected Compound Annual Growth Rate (CAGR) of the Wax Additives Market?
The projected CAGR is approximately 4.95%.
2. Which companies are prominent players in the Wax Additives Market?
Key companies in the market include Honeywell International Inc, Clariant, Arkema, Evonik Industries AG, Paramold Manufacturing LLC, BASF SE, Shamrock Technologies Inc, The Lubrizol Corporation, Tianshi Wax , BYK-CHEMIE GmbH, Münzing Corporation, Innospec, Concentrol.
3. What are the main segments of the Wax Additives Market?
The market segments include Material, Type, Application.
4. Can you provide details about the market size?
The market size is estimated to be USD 1.68 Million as of 2022.
5. What are some drivers contributing to market growth?
Growing Consumption of Candles in Home Decor and Health Centers; Wax Additives Benefits in Coatings and Inks.
6. What are the notable trends driving market growth?
Wax Additives Expected to find High Demand in Coatings Segment.
7. Are there any restraints impacting market growth?
Volatility in Crude Oil Price.
8. Can you provide examples of recent developments in the market?
July 2022: Munzing announced the start-up of water-based wax emulsions and other specialty additives at their new plant in Zeitz Chemical and Industrial Park. The plant, built over 20,000 sq m with an investment of more than EUR 50 million (USD 5.19 million), includes the possibility of further expansion on land that is still undeveloped.
9. What pricing options are available for accessing the report?
Pricing options include single-user, multi-user, and enterprise licenses priced at USD 4750, USD 5250, and USD 8750 respectively.
10. Is the market size provided in terms of value or volume?
The market size is provided in terms of value, measured in Million and volume, measured in K Tons.
11. Are there any specific market keywords associated with the report?
Yes, the market keyword associated with the report is "Wax Additives Market," which aids in identifying and referencing the specific market segment covered.
12. How do I determine which pricing option suits my needs best?
The pricing options vary based on user requirements and access needs. Individual users may opt for single-user licenses, while businesses requiring broader access may choose multi-user or enterprise licenses for cost-effective access to the report.
13. Are there any additional resources or data provided in the Wax Additives Market report?
While the report offers comprehensive insights, it's advisable to review the specific contents or supplementary materials provided to ascertain if additional resources or data are available.
14. How can I stay updated on further developments or reports in the Wax Additives Market?
To stay informed about further developments, trends, and reports in the Wax Additives Market, consider subscribing to industry newsletters, following relevant companies and organizations, or regularly checking reputable industry news sources and publications.
Methodology
Step 1 - Identification of Relevant Samples Size from Population Database


Step 2 - Approaches for Defining Global Market Size (Value, Volume* & Price*)

Note*: In applicable scenarios
Step 3 - Data Sources
Primary Research
- Web Analytics
- Survey Reports
- Research Institute
- Latest Research Reports
- Opinion Leaders
Secondary Research
- Annual Reports
- White Paper
- Latest Press Release
- Industry Association
- Paid Database
- Investor Presentations

Step 4 - Data Triangulation
Involves using different sources of information in order to increase the validity of a study
These sources are likely to be stakeholders in a program - participants, other researchers, program staff, other community members, and so on.
Then we put all data in single framework & apply various statistical tools to find out the dynamic on the market.
During the analysis stage, feedback from the stakeholder groups would be compared to determine areas of agreement as well as areas of divergence
