

Key Insights
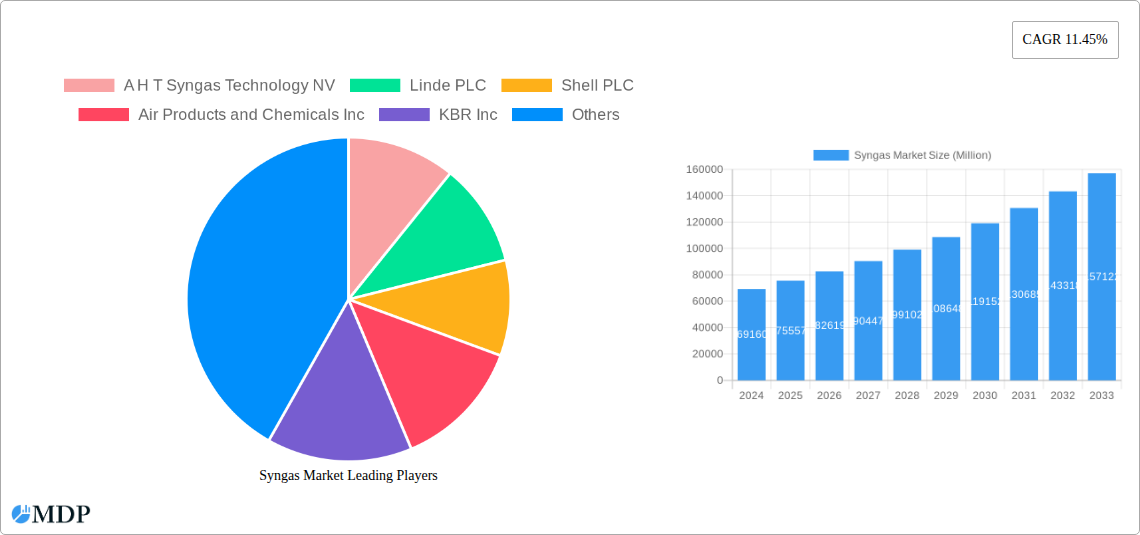
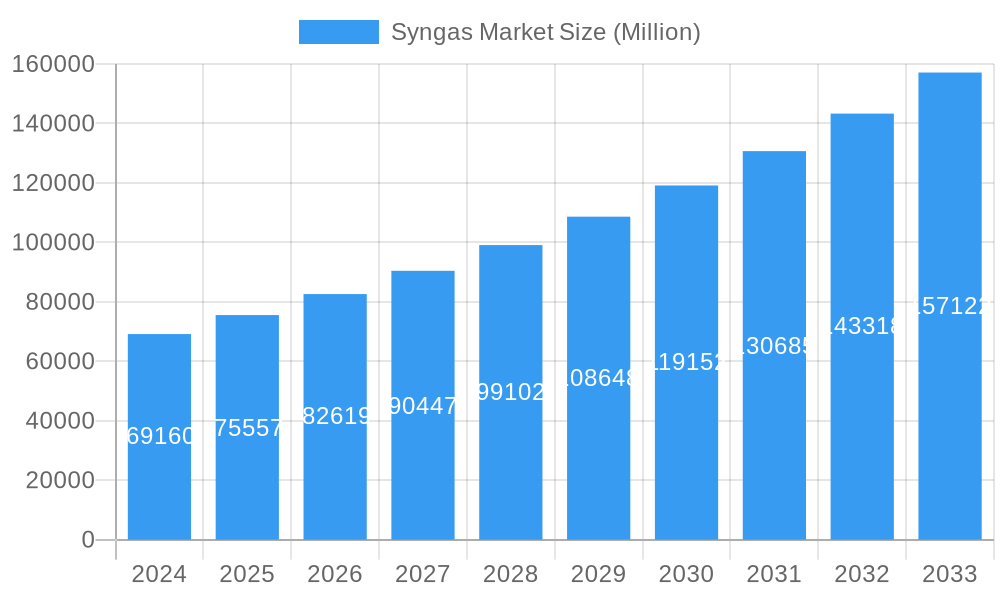
The global Syngas market is poised for significant expansion, projected to reach an estimated USD 69.16 billion in 2024 and grow at a robust Compound Annual Growth Rate (CAGR) of 10.8% during the forecast period of 2025-2033. This upward trajectory is primarily fueled by the increasing demand for syngas as a crucial intermediate in the production of various essential chemicals and fuels. Key applications driving this growth include methanol and ammonia, which are fundamental to fertilizer production, and hydrogen, a vital component in refining processes and an emerging clean energy carrier. The growing emphasis on decarbonization and the exploration of alternative fuel sources are further bolstering the demand for syngas-derived products, particularly synthetic fuels and hydrogen for fuel cell applications.
Syngas Market Market Size (In Billion)
Technological advancements in syngas production, such as improvements in gasification efficiency and the development of more sustainable feedstock options, are also acting as significant market accelerators. While pet coke and coal remain dominant feedstocks due to their availability and cost-effectiveness, natural gas is gaining traction, especially in regions with abundant reserves and a focus on cleaner production methods. The market is characterized by a competitive landscape with major players like Linde PLC, Shell PLC, and Air Products and Chemicals Inc. investing heavily in research and development to enhance production technologies and expand their global reach. However, challenges such as the capital-intensive nature of syngas plants and stringent environmental regulations in some regions could pose moderate restraints to market expansion.
Syngas Market Company Market Share
Syngas Market: Unlocking a Sustainable Future for Energy and Chemicals
Gain unparalleled insights into the dynamic Syngas Market with our comprehensive report, meticulously crafted to equip industry stakeholders with actionable intelligence and strategic foresight. This in-depth analysis covers the historical performance from 2019 to 2024, the base year of 2025, and projects an expansive forecast period through 2033. The global syngas market is poised for significant expansion, driven by escalating demand for cleaner energy sources, the burgeoning chemical industry, and a concerted global push towards decarbonization. Our report delves into market segmentation by feedstock (Pet Coke, Coal, Natural Gas, Other Feedstock Types), technology (Steam Reforming, Gasification), gasifier type (Fixed Bed, Entrained Flow, Fluidized Bed), and application (Methanol, Ammonia, Hydrogen, Liquid Fuels, Direct Reduced Iron, Synthetic Natural Gas, Electricity, Other Applications), providing a granular understanding of market intricacies and opportunities. Explore the pivotal role of syngas in enabling the production of essential chemicals and fuels, while mitigating environmental impact through innovative technologies like carbon capture and utilization.
Syngas Market Market Dynamics & Concentration
The Syngas Market is characterized by a moderate to high concentration, with key players like Linde PLC, Shell PLC, Air Products and Chemicals Inc., and Sasol holding significant market shares due to their established infrastructure, technological expertise, and extensive global reach. Innovation drivers are predominantly focused on enhancing the efficiency and sustainability of syngas production. This includes the development of advanced gasification technologies capable of processing a wider range of feedstocks, including waste materials and biomass, as well as improved catalysts for steam reforming to maximize hydrogen yield and minimize carbon emissions. Regulatory frameworks worldwide are increasingly favoring cleaner energy solutions and incentivizing the adoption of low-carbon technologies, directly impacting the syngas market by promoting its use in industrial processes and the production of synthetic fuels. Product substitutes, such as direct hydrogen production or the use of conventional fossil fuels, exist but are increasingly facing scrutiny due to environmental concerns and fluctuating price volatility. End-user trends highlight a growing preference for sustainable chemical intermediates and cleaner energy sources, pushing industries to adopt syngas-based solutions. Mergers and Acquisition (M&A) activities are expected to increase as larger entities seek to consolidate their market position, acquire cutting-edge technologies, or expand their geographical footprint. The historical period (2019-2024) saw a steady growth, with the base year (2025) expected to witness substantial investments in new syngas capacity.
Syngas Market Industry Trends & Analysis
The Syngas Market is experiencing robust growth, projected to expand at a considerable Compound Annual Growth Rate (CAGR) of approximately 6.5% from 2025 to 2033. This upward trajectory is primarily fueled by the escalating global demand for cleaner and more sustainable energy alternatives, coupled with the indispensability of syngas as a fundamental building block in the chemical industry for the production of methanol, ammonia, and hydrogen. Technological advancements are a significant disruptor and enabler within this market. Innovations in gasification technology, particularly the development of more efficient and versatile gasifiers that can effectively utilize diverse feedstocks including municipal solid waste and agricultural residues, are broadening the scope of syngas applications and enhancing its economic viability. Furthermore, advancements in steam reforming processes are leading to higher hydrogen yields and reduced operational costs. Consumer preferences are undeniably shifting towards environmentally friendly products and processes. This is translating into increased demand for syngas-derived fuels and chemicals, as industries aim to reduce their carbon footprint and comply with stringent environmental regulations. The competitive dynamics within the syngas market are intensifying, characterized by strategic partnerships, technological collaborations, and a keen focus on cost optimization and efficiency gains. Companies are investing heavily in research and development to improve process economics and explore novel applications for syngas. The market penetration of syngas is steadily increasing across various sectors, including energy, chemicals, and manufacturing, as its versatility and potential for decarbonization become more widely recognized. The integration of syngas production with carbon capture, utilization, and storage (CCUS) technologies is also emerging as a key trend, further enhancing its sustainability credentials and making it an attractive option for industries seeking to achieve net-zero emission targets.
Leading Markets & Segments in Syngas Market
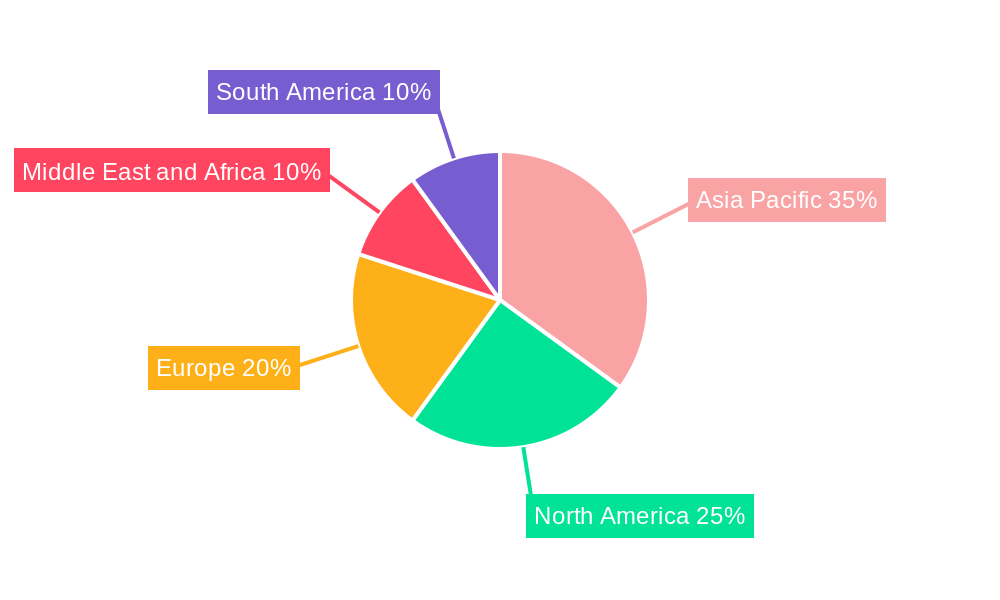
The Syngas Market is showcasing significant dominance in the Asia-Pacific region, driven by rapid industrialization, burgeoning demand for chemicals and energy in countries like China and India, and substantial investments in coal-based syngas production. Within this region, China stands out as a leading country, leveraging its vast coal reserves and supportive government policies for chemical manufacturing and energy security.
Feedstock Analysis:
- Coal: Remains a dominant feedstock, particularly in regions with abundant reserves, due to its cost-effectiveness. However, environmental concerns are driving a gradual shift towards cleaner alternatives.
- Natural Gas: Is gaining prominence as a cleaner feedstock, especially with advancements in steam reforming technology, and is crucial for hydrogen production for fuel cell applications and ammonia synthesis.
- Pet Coke: Offers an attractive option for industries with access to petrochemical by-products, contributing to waste valorization.
- Other Feedstock Types: Including biomass, municipal solid waste (MSW), and agricultural residues, are emerging as critical growth areas due to their sustainability potential and alignment with circular economy principles. The Maire Tecnimont SpA announcement regarding biomethane production from waste wood exemplifies this trend.
Technology Dominance:
- Gasification: Is the most versatile technology, capable of processing a wide array of feedstocks.
- Entrained Flow Gasifiers: Are favored for large-scale industrial applications, offering high efficiency and throughput, especially for coal and pet coke.
- Fluidized Bed Gasifiers: Are increasingly adopted for their flexibility in handling various feedstocks, including biomass and waste, and are well-suited for medium to large-scale operations.
- Fixed Bed Gasifiers: Though less prevalent in new large-scale projects, they continue to be relevant for specific applications and smaller-scale installations, particularly for coal.
- Steam Reforming: Remains a cornerstone technology, especially for natural gas, for the efficient production of hydrogen and syngas for ammonia and methanol synthesis.
Application Landscape:
- Hydrogen: Is a rapidly expanding application, driven by its use in refining processes, chemical synthesis (ammonia, methanol), and the burgeoning clean energy sector (fuel cells).
- Methanol: Continues to be a primary application, serving as a crucial intermediate for various chemicals and as a fuel additive.
- Ammonia: Remains a cornerstone for the fertilizer industry, with syngas being the primary route for its production.
- Liquid Fuels: The production of synthetic fuels via Fischer-Tropsch synthesis from syngas presents a promising avenue for reducing reliance on crude oil.
- Electricity: Syngas can be utilized in integrated gasification combined cycle (IGCC) power plants for efficient and cleaner electricity generation.
- Direct Reduced Iron (DRI): Syngas is integral to the DRI process, offering a lower-carbon alternative to traditional blast furnace steelmaking.
- Synthetic Natural Gas (SNG): Offers a pathway to convert various feedstocks into a pipeline-compatible natural gas substitute, particularly relevant for energy security.
Syngas Market Product Developments
The Syngas Market is witnessing a surge in product development focused on enhancing sustainability and efficiency. Innovations in advanced gasification technologies are enabling the effective conversion of a broader spectrum of feedstocks, including challenging waste streams and biomass, into high-quality syngas. Companies are developing novel catalysts for steam reforming and methanation, aiming for higher yields, lower operating temperatures, and improved selectivity for specific syngas components. Furthermore, the integration of syngas production with carbon capture, utilization, and storage (CCUS) technologies is a significant trend, leading to the development of "blue" syngas and fuels with significantly reduced carbon footprints. These developments are crucial for meeting stringent environmental regulations and catering to the growing demand for low-carbon chemical intermediates and energy sources. The competitive advantage lies in offering cost-effective, environmentally benign syngas solutions that align with global decarbonization efforts.
Key Drivers of Syngas Market Growth
The global Syngas Market is propelled by several key growth drivers. Firstly, the increasing global imperative for decarbonization and the transition towards cleaner energy sources is a primary catalyst. Syngas plays a crucial role in producing low-carbon fuels and chemicals. Secondly, the growing demand for essential chemicals like methanol and ammonia, which are vital for agriculture and various industrial processes, directly fuels syngas consumption. Thirdly, technological advancements in gasification and steam reforming, leading to improved efficiency, feedstock flexibility, and reduced production costs, are making syngas a more economically viable option. For instance, the development of advanced gasifiers capable of processing waste materials contributes to the circular economy and reduces reliance on fossil fuels. Fourthly, supportive government regulatory frameworks and incentives promoting renewable energy and emission reduction are encouraging investments in syngas technologies. Finally, the strategic importance of energy security and the desire to diversify energy portfolios are also driving interest in syngas as a domestically producible energy carrier.
Challenges in the Syngas Market Market
Despite its promising growth, the Syngas Market faces several challenges. High initial capital investment for syngas production facilities remains a significant barrier, particularly for newer, more complex technologies. Feedstock availability and price volatility, especially for natural gas, can impact the economic viability of syngas production. Stringent environmental regulations, while driving adoption, also necessitate significant investment in emission control technologies, increasing operational costs. Competition from established fossil fuel markets and direct hydrogen production methods presents an ongoing challenge, requiring syngas to consistently demonstrate its cost-competitiveness and environmental advantages. Technological complexities and the need for skilled labor in operating and maintaining advanced syngas plants can also be a restraint. Furthermore, public perception and acceptance of synthetic fuels and chemicals derived from potentially controversial feedstocks need to be carefully managed.
Emerging Opportunities in Syngas Market
Emerging opportunities in the Syngas Market are centered around sustainability and innovation. The growing focus on circular economy principles presents a significant opportunity for syngas derived from waste streams, such as municipal solid waste and agricultural residues. These "waste-to-syngas" projects offer dual benefits of waste management and valuable product generation. Technological breakthroughs in direct air capture (DAC) integration with syngas production offer pathways to truly carbon-negative fuels and chemicals. Strategic partnerships between technology providers, feedstock suppliers, and end-users are crucial for developing and scaling these advanced solutions. Market expansion into developing economies with rapidly growing energy and chemical demands, coupled with the availability of diverse feedstocks, presents another avenue for growth. The increasing demand for green hydrogen produced via electrolysis powered by renewables, or via steam methane reforming with CCUS, will also drive syngas innovation and application. The development of new applications for syngas, such as in advanced materials or specialized chemical synthesis, will further unlock market potential.
Leading Players in the Syngas Market Sector
- A H T Syngas Technology NV
- Linde PLC
- Shell PLC
- Air Products and Chemicals Inc.
- KBR Inc.
- Airpower Technologies Limited
- Sasol
- Technip Energies NV
- Maire Tecnimont Spa
- John Wood Group PLC
- Topsoe AS
- Air Liquide
Key Milestones in Syngas Market Industry
- July 2022: Maire Tecnimont SpA announced that NextChem was awarded a contract by Storengy to study waste wood and solid recovered fuel conversion plant to produce biomethane in France. NextChem is expected to be responsible for the engineering services and cost estimating for the syngas purification, methanation unit, and methane upgrading. This milestone signifies advancements in utilizing biomass for sustainable syngas and biomethane production.
- June 2022: Shell PLC entered a decarbonization agreement with Tokyo Gas Co. and Osaka Gas Co. for the natural gas and carbon capture, utilization, and sequestration (CCUS) projects. By 2030, these Japanese companies could aim to replace 1% of the gas currently delivered with biomethane-based synthetic gas, or syngas. This highlights the growing trend of integrating CCUS with syngas to achieve significant decarbonization goals in the energy sector.
- May 2022: Pertamina and Air Liquide Indonesia agreed to collaborate in developing carbon capture and utilization technology at the Balikpapan refinery processing unit. Within the framework of this joint study agreement, Pertamina and Air Liquide are expected to conduct a joint study on CO2 syngas and Flue-Gas capture technology application from hydrogen production. This development emphasizes the focus on capturing CO2 from syngas production, a crucial step towards cleaner hydrogen and syngas operations.
Strategic Outlook for Syngas Market Market
The strategic outlook for the Syngas Market is exceptionally positive, driven by an increasing global commitment to sustainability and the indispensable role of syngas in the production of essential chemicals and cleaner energy solutions. Growth accelerators will be primarily fueled by continued advancements in gasification technologies that enhance feedstock flexibility, particularly the utilization of waste and biomass, thereby promoting circular economy principles. The integration of carbon capture, utilization, and storage (CCUS) technologies will be paramount, enabling the production of low-carbon and carbon-negative syngas and its derivatives, such as blue hydrogen and synthetic fuels. Strategic partnerships and collaborations among technology providers, feedstock suppliers, and end-users will be critical for scaling up innovative projects and reducing costs. Furthermore, supportive government policies, R&D investments in novel catalysts and process optimization, and the growing demand for sustainable alternatives in sectors like transportation and chemicals will solidify the market's expansion. The potential for syngas to contribute significantly to energy security and decarbonization targets positions it as a vital component of the future energy landscape.
Syngas Market Segmentation
-
1. Feedstock
- 1.1. Pet Coke
- 1.2. Coal
- 1.3. Natural Gas
- 1.4. Other Feedstock Types
-
2. Technology
- 2.1. Steam Reforming
- 2.2. Gasification
-
3. Gasifier Type
- 3.1. Fixed Bed
- 3.2. Entrained Flow
- 3.3. Fluidized Bed
-
4. Application
- 4.1. Methanol
- 4.2. Ammonia
- 4.3. Hydrogen
- 4.4. Liquid Fuels
- 4.5. Direct Reduced Iron
- 4.6. Synthetic Natural Gas
- 4.7. Electricity
- 4.8. Other Applications
Syngas Market Segmentation By Geography
-
1. Asia Pacific
- 1.1. China
- 1.2. India
- 1.3. Rest of Asia Pacific
-
2. North America
- 2.1. United States
- 2.2. Canada
- 2.3. Trinidad and Tobago
-
3. Europe
- 3.1. Russia
- 3.2. Rest of Europe
-
4. South America
- 4.1. Venezuela
- 4.2. Brazil
- 4.3. Rest of South America
-
5. Middle East and Africa
- 5.1. Saudi Arabia
- 5.2. Qatar
- 5.3. South Africa
- 5.4. Iran
- 5.5. Rest of Middle East and Africa
Syngas Market Regional Market Share
Geographic Coverage of Syngas Market
Syngas Market REPORT HIGHLIGHTS
| Aspects | Details |
|---|---|
| Study Period | 2020-2034 |
| Base Year | 2025 |
| Estimated Year | 2026 |
| Forecast Period | 2026-2034 |
| Historical Period | 2020-2025 |
| Growth Rate | CAGR of 11.3% from 2020-2034 |
| Segmentation |
|
Table of Contents
- 1. Introduction
- 1.1. Research Scope
- 1.2. Market Segmentation
- 1.3. Research Objective
- 1.4. Definitions and Assumptions
- 2. Executive Summary
- 2.1. Market Snapshot
- 3. Market Dynamics
- 3.1. Market Drivers
- 3.2. Market Restrains
- 3.3. Market Trends
- 3.4. Market Opportunities
- 4. Market Factor Analysis
- 4.1. Porters Five Forces
- 4.1.1. Bargaining Power of Suppliers
- 4.1.2. Bargaining Power of Buyers
- 4.1.3. Threat of New Entrants
- 4.1.4. Threat of Substitutes
- 4.1.5. Competitive Rivalry
- 4.2. PESTEL analysis
- 4.3. BCG Analysis
- 4.3.1. Stars (High Growth, High Market Share)
- 4.3.2. Cash Cows (Low Growth, High Market Share)
- 4.3.3. Question Mark (High Growth, Low Market Share)
- 4.3.4. Dogs (Low Growth, Low Market Share)
- 4.4. Ansoff Matrix Analysis
- 4.5. Supply Chain Analysis
- 4.6. Regulatory Landscape
- 4.7. Current Market Potential and Opportunity Assessment (TAM–SAM–SOM Framework)
- 4.8. MDP Analyst Note
- 4.1. Porters Five Forces
- 5. Market Analysis, Insights and Forecast 2021-2033
- 5.1. Market Analysis, Insights and Forecast - by Feedstock
- 5.1.1. Pet Coke
- 5.1.2. Coal
- 5.1.3. Natural Gas
- 5.1.4. Other Feedstock Types
- 5.2. Market Analysis, Insights and Forecast - by Technology
- 5.2.1. Steam Reforming
- 5.2.2. Gasification
- 5.3. Market Analysis, Insights and Forecast - by Gasifier Type
- 5.3.1. Fixed Bed
- 5.3.2. Entrained Flow
- 5.3.3. Fluidized Bed
- 5.4. Market Analysis, Insights and Forecast - by Application
- 5.4.1. Methanol
- 5.4.2. Ammonia
- 5.4.3. Hydrogen
- 5.4.4. Liquid Fuels
- 5.4.5. Direct Reduced Iron
- 5.4.6. Synthetic Natural Gas
- 5.4.7. Electricity
- 5.4.8. Other Applications
- 5.5. Market Analysis, Insights and Forecast - by Region
- 5.5.1. Asia Pacific
- 5.5.2. North America
- 5.5.3. Europe
- 5.5.4. South America
- 5.5.5. Middle East and Africa
- 5.1. Market Analysis, Insights and Forecast - by Feedstock
- 6. Global Syngas Market Analysis, Insights and Forecast, 2021-2033
- 6.1. Market Analysis, Insights and Forecast - by Feedstock
- 6.1.1. Pet Coke
- 6.1.2. Coal
- 6.1.3. Natural Gas
- 6.1.4. Other Feedstock Types
- 6.2. Market Analysis, Insights and Forecast - by Technology
- 6.2.1. Steam Reforming
- 6.2.2. Gasification
- 6.3. Market Analysis, Insights and Forecast - by Gasifier Type
- 6.3.1. Fixed Bed
- 6.3.2. Entrained Flow
- 6.3.3. Fluidized Bed
- 6.4. Market Analysis, Insights and Forecast - by Application
- 6.4.1. Methanol
- 6.4.2. Ammonia
- 6.4.3. Hydrogen
- 6.4.4. Liquid Fuels
- 6.4.5. Direct Reduced Iron
- 6.4.6. Synthetic Natural Gas
- 6.4.7. Electricity
- 6.4.8. Other Applications
- 6.1. Market Analysis, Insights and Forecast - by Feedstock
- 7. Asia Pacific Syngas Market Analysis, Insights and Forecast, 2020-2032
- 7.1. Market Analysis, Insights and Forecast - by Feedstock
- 7.1.1. Pet Coke
- 7.1.2. Coal
- 7.1.3. Natural Gas
- 7.1.4. Other Feedstock Types
- 7.2. Market Analysis, Insights and Forecast - by Technology
- 7.2.1. Steam Reforming
- 7.2.2. Gasification
- 7.3. Market Analysis, Insights and Forecast - by Gasifier Type
- 7.3.1. Fixed Bed
- 7.3.2. Entrained Flow
- 7.3.3. Fluidized Bed
- 7.4. Market Analysis, Insights and Forecast - by Application
- 7.4.1. Methanol
- 7.4.2. Ammonia
- 7.4.3. Hydrogen
- 7.4.4. Liquid Fuels
- 7.4.5. Direct Reduced Iron
- 7.4.6. Synthetic Natural Gas
- 7.4.7. Electricity
- 7.4.8. Other Applications
- 7.1. Market Analysis, Insights and Forecast - by Feedstock
- 8. North America Syngas Market Analysis, Insights and Forecast, 2020-2032
- 8.1. Market Analysis, Insights and Forecast - by Feedstock
- 8.1.1. Pet Coke
- 8.1.2. Coal
- 8.1.3. Natural Gas
- 8.1.4. Other Feedstock Types
- 8.2. Market Analysis, Insights and Forecast - by Technology
- 8.2.1. Steam Reforming
- 8.2.2. Gasification
- 8.3. Market Analysis, Insights and Forecast - by Gasifier Type
- 8.3.1. Fixed Bed
- 8.3.2. Entrained Flow
- 8.3.3. Fluidized Bed
- 8.4. Market Analysis, Insights and Forecast - by Application
- 8.4.1. Methanol
- 8.4.2. Ammonia
- 8.4.3. Hydrogen
- 8.4.4. Liquid Fuels
- 8.4.5. Direct Reduced Iron
- 8.4.6. Synthetic Natural Gas
- 8.4.7. Electricity
- 8.4.8. Other Applications
- 8.1. Market Analysis, Insights and Forecast - by Feedstock
- 9. Europe Syngas Market Analysis, Insights and Forecast, 2020-2032
- 9.1. Market Analysis, Insights and Forecast - by Feedstock
- 9.1.1. Pet Coke
- 9.1.2. Coal
- 9.1.3. Natural Gas
- 9.1.4. Other Feedstock Types
- 9.2. Market Analysis, Insights and Forecast - by Technology
- 9.2.1. Steam Reforming
- 9.2.2. Gasification
- 9.3. Market Analysis, Insights and Forecast - by Gasifier Type
- 9.3.1. Fixed Bed
- 9.3.2. Entrained Flow
- 9.3.3. Fluidized Bed
- 9.4. Market Analysis, Insights and Forecast - by Application
- 9.4.1. Methanol
- 9.4.2. Ammonia
- 9.4.3. Hydrogen
- 9.4.4. Liquid Fuels
- 9.4.5. Direct Reduced Iron
- 9.4.6. Synthetic Natural Gas
- 9.4.7. Electricity
- 9.4.8. Other Applications
- 9.1. Market Analysis, Insights and Forecast - by Feedstock
- 10. South America Syngas Market Analysis, Insights and Forecast, 2020-2032
- 10.1. Market Analysis, Insights and Forecast - by Feedstock
- 10.1.1. Pet Coke
- 10.1.2. Coal
- 10.1.3. Natural Gas
- 10.1.4. Other Feedstock Types
- 10.2. Market Analysis, Insights and Forecast - by Technology
- 10.2.1. Steam Reforming
- 10.2.2. Gasification
- 10.3. Market Analysis, Insights and Forecast - by Gasifier Type
- 10.3.1. Fixed Bed
- 10.3.2. Entrained Flow
- 10.3.3. Fluidized Bed
- 10.4. Market Analysis, Insights and Forecast - by Application
- 10.4.1. Methanol
- 10.4.2. Ammonia
- 10.4.3. Hydrogen
- 10.4.4. Liquid Fuels
- 10.4.5. Direct Reduced Iron
- 10.4.6. Synthetic Natural Gas
- 10.4.7. Electricity
- 10.4.8. Other Applications
- 10.1. Market Analysis, Insights and Forecast - by Feedstock
- 11. Middle East and Africa Syngas Market Analysis, Insights and Forecast, 2020-2032
- 11.1. Market Analysis, Insights and Forecast - by Feedstock
- 11.1.1. Pet Coke
- 11.1.2. Coal
- 11.1.3. Natural Gas
- 11.1.4. Other Feedstock Types
- 11.2. Market Analysis, Insights and Forecast - by Technology
- 11.2.1. Steam Reforming
- 11.2.2. Gasification
- 11.3. Market Analysis, Insights and Forecast - by Gasifier Type
- 11.3.1. Fixed Bed
- 11.3.2. Entrained Flow
- 11.3.3. Fluidized Bed
- 11.4. Market Analysis, Insights and Forecast - by Application
- 11.4.1. Methanol
- 11.4.2. Ammonia
- 11.4.3. Hydrogen
- 11.4.4. Liquid Fuels
- 11.4.5. Direct Reduced Iron
- 11.4.6. Synthetic Natural Gas
- 11.4.7. Electricity
- 11.4.8. Other Applications
- 11.1. Market Analysis, Insights and Forecast - by Feedstock
- 12. Competitive Analysis
- 12.1. Company Profiles
- 12.1.1 A H T Syngas Technology NV
- 12.1.1.1. Company Overview
- 12.1.1.2. Products
- 12.1.1.3. Company Financials
- 12.1.1.4. SWOT Analysis
- 12.1.2 Linde PLC
- 12.1.2.1. Company Overview
- 12.1.2.2. Products
- 12.1.2.3. Company Financials
- 12.1.2.4. SWOT Analysis
- 12.1.3 Shell PLC
- 12.1.3.1. Company Overview
- 12.1.3.2. Products
- 12.1.3.3. Company Financials
- 12.1.3.4. SWOT Analysis
- 12.1.4 Air Products and Chemicals Inc
- 12.1.4.1. Company Overview
- 12.1.4.2. Products
- 12.1.4.3. Company Financials
- 12.1.4.4. SWOT Analysis
- 12.1.5 KBR Inc
- 12.1.5.1. Company Overview
- 12.1.5.2. Products
- 12.1.5.3. Company Financials
- 12.1.5.4. SWOT Analysis
- 12.1.6 Airpower Technologies Limited
- 12.1.6.1. Company Overview
- 12.1.6.2. Products
- 12.1.6.3. Company Financials
- 12.1.6.4. SWOT Analysis
- 12.1.7 Sasol
- 12.1.7.1. Company Overview
- 12.1.7.2. Products
- 12.1.7.3. Company Financials
- 12.1.7.4. SWOT Analysis
- 12.1.8 Technip Energies NV
- 12.1.8.1. Company Overview
- 12.1.8.2. Products
- 12.1.8.3. Company Financials
- 12.1.8.4. SWOT Analysis
- 12.1.9 Maire Tecnimont Spa
- 12.1.9.1. Company Overview
- 12.1.9.2. Products
- 12.1.9.3. Company Financials
- 12.1.9.4. SWOT Analysis
- 12.1.10 John Wood Group PLC
- 12.1.10.1. Company Overview
- 12.1.10.2. Products
- 12.1.10.3. Company Financials
- 12.1.10.4. SWOT Analysis
- 12.1.11 Topsoe AS*List Not Exhaustive
- 12.1.11.1. Company Overview
- 12.1.11.2. Products
- 12.1.11.3. Company Financials
- 12.1.11.4. SWOT Analysis
- 12.1.12 Air Liquide
- 12.1.12.1. Company Overview
- 12.1.12.2. Products
- 12.1.12.3. Company Financials
- 12.1.12.4. SWOT Analysis
- 12.1.1 A H T Syngas Technology NV
- 12.2. Market Entropy
- 12.2.1 Company's Key Areas Served
- 12.2.2 Recent Developments
- 12.3. Company Market Share Analysis 2025
- 12.3.1 Top 5 Companies Market Share Analysis
- 12.3.2 Top 3 Companies Market Share Analysis
- 12.4. List of Potential Customers
- 13. Research Methodology
List of Figures
- Figure 1: Global Syngas Market Revenue Breakdown (million, %) by Region 2025 & 2033
- Figure 2: Global Syngas Market Volume Breakdown (Million, %) by Region 2025 & 2033
- Figure 3: Asia Pacific Syngas Market Revenue (million), by Feedstock 2025 & 2033
- Figure 4: Asia Pacific Syngas Market Volume (Million), by Feedstock 2025 & 2033
- Figure 5: Asia Pacific Syngas Market Revenue Share (%), by Feedstock 2025 & 2033
- Figure 6: Asia Pacific Syngas Market Volume Share (%), by Feedstock 2025 & 2033
- Figure 7: Asia Pacific Syngas Market Revenue (million), by Technology 2025 & 2033
- Figure 8: Asia Pacific Syngas Market Volume (Million), by Technology 2025 & 2033
- Figure 9: Asia Pacific Syngas Market Revenue Share (%), by Technology 2025 & 2033
- Figure 10: Asia Pacific Syngas Market Volume Share (%), by Technology 2025 & 2033
- Figure 11: Asia Pacific Syngas Market Revenue (million), by Gasifier Type 2025 & 2033
- Figure 12: Asia Pacific Syngas Market Volume (Million), by Gasifier Type 2025 & 2033
- Figure 13: Asia Pacific Syngas Market Revenue Share (%), by Gasifier Type 2025 & 2033
- Figure 14: Asia Pacific Syngas Market Volume Share (%), by Gasifier Type 2025 & 2033
- Figure 15: Asia Pacific Syngas Market Revenue (million), by Application 2025 & 2033
- Figure 16: Asia Pacific Syngas Market Volume (Million), by Application 2025 & 2033
- Figure 17: Asia Pacific Syngas Market Revenue Share (%), by Application 2025 & 2033
- Figure 18: Asia Pacific Syngas Market Volume Share (%), by Application 2025 & 2033
- Figure 19: Asia Pacific Syngas Market Revenue (million), by Country 2025 & 2033
- Figure 20: Asia Pacific Syngas Market Volume (Million), by Country 2025 & 2033
- Figure 21: Asia Pacific Syngas Market Revenue Share (%), by Country 2025 & 2033
- Figure 22: Asia Pacific Syngas Market Volume Share (%), by Country 2025 & 2033
- Figure 23: North America Syngas Market Revenue (million), by Feedstock 2025 & 2033
- Figure 24: North America Syngas Market Volume (Million), by Feedstock 2025 & 2033
- Figure 25: North America Syngas Market Revenue Share (%), by Feedstock 2025 & 2033
- Figure 26: North America Syngas Market Volume Share (%), by Feedstock 2025 & 2033
- Figure 27: North America Syngas Market Revenue (million), by Technology 2025 & 2033
- Figure 28: North America Syngas Market Volume (Million), by Technology 2025 & 2033
- Figure 29: North America Syngas Market Revenue Share (%), by Technology 2025 & 2033
- Figure 30: North America Syngas Market Volume Share (%), by Technology 2025 & 2033
- Figure 31: North America Syngas Market Revenue (million), by Gasifier Type 2025 & 2033
- Figure 32: North America Syngas Market Volume (Million), by Gasifier Type 2025 & 2033
- Figure 33: North America Syngas Market Revenue Share (%), by Gasifier Type 2025 & 2033
- Figure 34: North America Syngas Market Volume Share (%), by Gasifier Type 2025 & 2033
- Figure 35: North America Syngas Market Revenue (million), by Application 2025 & 2033
- Figure 36: North America Syngas Market Volume (Million), by Application 2025 & 2033
- Figure 37: North America Syngas Market Revenue Share (%), by Application 2025 & 2033
- Figure 38: North America Syngas Market Volume Share (%), by Application 2025 & 2033
- Figure 39: North America Syngas Market Revenue (million), by Country 2025 & 2033
- Figure 40: North America Syngas Market Volume (Million), by Country 2025 & 2033
- Figure 41: North America Syngas Market Revenue Share (%), by Country 2025 & 2033
- Figure 42: North America Syngas Market Volume Share (%), by Country 2025 & 2033
- Figure 43: Europe Syngas Market Revenue (million), by Feedstock 2025 & 2033
- Figure 44: Europe Syngas Market Volume (Million), by Feedstock 2025 & 2033
- Figure 45: Europe Syngas Market Revenue Share (%), by Feedstock 2025 & 2033
- Figure 46: Europe Syngas Market Volume Share (%), by Feedstock 2025 & 2033
- Figure 47: Europe Syngas Market Revenue (million), by Technology 2025 & 2033
- Figure 48: Europe Syngas Market Volume (Million), by Technology 2025 & 2033
- Figure 49: Europe Syngas Market Revenue Share (%), by Technology 2025 & 2033
- Figure 50: Europe Syngas Market Volume Share (%), by Technology 2025 & 2033
- Figure 51: Europe Syngas Market Revenue (million), by Gasifier Type 2025 & 2033
- Figure 52: Europe Syngas Market Volume (Million), by Gasifier Type 2025 & 2033
- Figure 53: Europe Syngas Market Revenue Share (%), by Gasifier Type 2025 & 2033
- Figure 54: Europe Syngas Market Volume Share (%), by Gasifier Type 2025 & 2033
- Figure 55: Europe Syngas Market Revenue (million), by Application 2025 & 2033
- Figure 56: Europe Syngas Market Volume (Million), by Application 2025 & 2033
- Figure 57: Europe Syngas Market Revenue Share (%), by Application 2025 & 2033
- Figure 58: Europe Syngas Market Volume Share (%), by Application 2025 & 2033
- Figure 59: Europe Syngas Market Revenue (million), by Country 2025 & 2033
- Figure 60: Europe Syngas Market Volume (Million), by Country 2025 & 2033
- Figure 61: Europe Syngas Market Revenue Share (%), by Country 2025 & 2033
- Figure 62: Europe Syngas Market Volume Share (%), by Country 2025 & 2033
- Figure 63: South America Syngas Market Revenue (million), by Feedstock 2025 & 2033
- Figure 64: South America Syngas Market Volume (Million), by Feedstock 2025 & 2033
- Figure 65: South America Syngas Market Revenue Share (%), by Feedstock 2025 & 2033
- Figure 66: South America Syngas Market Volume Share (%), by Feedstock 2025 & 2033
- Figure 67: South America Syngas Market Revenue (million), by Technology 2025 & 2033
- Figure 68: South America Syngas Market Volume (Million), by Technology 2025 & 2033
- Figure 69: South America Syngas Market Revenue Share (%), by Technology 2025 & 2033
- Figure 70: South America Syngas Market Volume Share (%), by Technology 2025 & 2033
- Figure 71: South America Syngas Market Revenue (million), by Gasifier Type 2025 & 2033
- Figure 72: South America Syngas Market Volume (Million), by Gasifier Type 2025 & 2033
- Figure 73: South America Syngas Market Revenue Share (%), by Gasifier Type 2025 & 2033
- Figure 74: South America Syngas Market Volume Share (%), by Gasifier Type 2025 & 2033
- Figure 75: South America Syngas Market Revenue (million), by Application 2025 & 2033
- Figure 76: South America Syngas Market Volume (Million), by Application 2025 & 2033
- Figure 77: South America Syngas Market Revenue Share (%), by Application 2025 & 2033
- Figure 78: South America Syngas Market Volume Share (%), by Application 2025 & 2033
- Figure 79: South America Syngas Market Revenue (million), by Country 2025 & 2033
- Figure 80: South America Syngas Market Volume (Million), by Country 2025 & 2033
- Figure 81: South America Syngas Market Revenue Share (%), by Country 2025 & 2033
- Figure 82: South America Syngas Market Volume Share (%), by Country 2025 & 2033
- Figure 83: Middle East and Africa Syngas Market Revenue (million), by Feedstock 2025 & 2033
- Figure 84: Middle East and Africa Syngas Market Volume (Million), by Feedstock 2025 & 2033
- Figure 85: Middle East and Africa Syngas Market Revenue Share (%), by Feedstock 2025 & 2033
- Figure 86: Middle East and Africa Syngas Market Volume Share (%), by Feedstock 2025 & 2033
- Figure 87: Middle East and Africa Syngas Market Revenue (million), by Technology 2025 & 2033
- Figure 88: Middle East and Africa Syngas Market Volume (Million), by Technology 2025 & 2033
- Figure 89: Middle East and Africa Syngas Market Revenue Share (%), by Technology 2025 & 2033
- Figure 90: Middle East and Africa Syngas Market Volume Share (%), by Technology 2025 & 2033
- Figure 91: Middle East and Africa Syngas Market Revenue (million), by Gasifier Type 2025 & 2033
- Figure 92: Middle East and Africa Syngas Market Volume (Million), by Gasifier Type 2025 & 2033
- Figure 93: Middle East and Africa Syngas Market Revenue Share (%), by Gasifier Type 2025 & 2033
- Figure 94: Middle East and Africa Syngas Market Volume Share (%), by Gasifier Type 2025 & 2033
- Figure 95: Middle East and Africa Syngas Market Revenue (million), by Application 2025 & 2033
- Figure 96: Middle East and Africa Syngas Market Volume (Million), by Application 2025 & 2033
- Figure 97: Middle East and Africa Syngas Market Revenue Share (%), by Application 2025 & 2033
- Figure 98: Middle East and Africa Syngas Market Volume Share (%), by Application 2025 & 2033
- Figure 99: Middle East and Africa Syngas Market Revenue (million), by Country 2025 & 2033
- Figure 100: Middle East and Africa Syngas Market Volume (Million), by Country 2025 & 2033
- Figure 101: Middle East and Africa Syngas Market Revenue Share (%), by Country 2025 & 2033
- Figure 102: Middle East and Africa Syngas Market Volume Share (%), by Country 2025 & 2033
List of Tables
- Table 1: Global Syngas Market Revenue million Forecast, by Feedstock 2020 & 2033
- Table 2: Global Syngas Market Volume Million Forecast, by Feedstock 2020 & 2033
- Table 3: Global Syngas Market Revenue million Forecast, by Technology 2020 & 2033
- Table 4: Global Syngas Market Volume Million Forecast, by Technology 2020 & 2033
- Table 5: Global Syngas Market Revenue million Forecast, by Gasifier Type 2020 & 2033
- Table 6: Global Syngas Market Volume Million Forecast, by Gasifier Type 2020 & 2033
- Table 7: Global Syngas Market Revenue million Forecast, by Application 2020 & 2033
- Table 8: Global Syngas Market Volume Million Forecast, by Application 2020 & 2033
- Table 9: Global Syngas Market Revenue million Forecast, by Region 2020 & 2033
- Table 10: Global Syngas Market Volume Million Forecast, by Region 2020 & 2033
- Table 11: Global Syngas Market Revenue million Forecast, by Feedstock 2020 & 2033
- Table 12: Global Syngas Market Volume Million Forecast, by Feedstock 2020 & 2033
- Table 13: Global Syngas Market Revenue million Forecast, by Technology 2020 & 2033
- Table 14: Global Syngas Market Volume Million Forecast, by Technology 2020 & 2033
- Table 15: Global Syngas Market Revenue million Forecast, by Gasifier Type 2020 & 2033
- Table 16: Global Syngas Market Volume Million Forecast, by Gasifier Type 2020 & 2033
- Table 17: Global Syngas Market Revenue million Forecast, by Application 2020 & 2033
- Table 18: Global Syngas Market Volume Million Forecast, by Application 2020 & 2033
- Table 19: Global Syngas Market Revenue million Forecast, by Country 2020 & 2033
- Table 20: Global Syngas Market Volume Million Forecast, by Country 2020 & 2033
- Table 21: China Syngas Market Revenue (million) Forecast, by Application 2020 & 2033
- Table 22: China Syngas Market Volume (Million) Forecast, by Application 2020 & 2033
- Table 23: India Syngas Market Revenue (million) Forecast, by Application 2020 & 2033
- Table 24: India Syngas Market Volume (Million) Forecast, by Application 2020 & 2033
- Table 25: Rest of Asia Pacific Syngas Market Revenue (million) Forecast, by Application 2020 & 2033
- Table 26: Rest of Asia Pacific Syngas Market Volume (Million) Forecast, by Application 2020 & 2033
- Table 27: Global Syngas Market Revenue million Forecast, by Feedstock 2020 & 2033
- Table 28: Global Syngas Market Volume Million Forecast, by Feedstock 2020 & 2033
- Table 29: Global Syngas Market Revenue million Forecast, by Technology 2020 & 2033
- Table 30: Global Syngas Market Volume Million Forecast, by Technology 2020 & 2033
- Table 31: Global Syngas Market Revenue million Forecast, by Gasifier Type 2020 & 2033
- Table 32: Global Syngas Market Volume Million Forecast, by Gasifier Type 2020 & 2033
- Table 33: Global Syngas Market Revenue million Forecast, by Application 2020 & 2033
- Table 34: Global Syngas Market Volume Million Forecast, by Application 2020 & 2033
- Table 35: Global Syngas Market Revenue million Forecast, by Country 2020 & 2033
- Table 36: Global Syngas Market Volume Million Forecast, by Country 2020 & 2033
- Table 37: United States Syngas Market Revenue (million) Forecast, by Application 2020 & 2033
- Table 38: United States Syngas Market Volume (Million) Forecast, by Application 2020 & 2033
- Table 39: Canada Syngas Market Revenue (million) Forecast, by Application 2020 & 2033
- Table 40: Canada Syngas Market Volume (Million) Forecast, by Application 2020 & 2033
- Table 41: Trinidad and Tobago Syngas Market Revenue (million) Forecast, by Application 2020 & 2033
- Table 42: Trinidad and Tobago Syngas Market Volume (Million) Forecast, by Application 2020 & 2033
- Table 43: Global Syngas Market Revenue million Forecast, by Feedstock 2020 & 2033
- Table 44: Global Syngas Market Volume Million Forecast, by Feedstock 2020 & 2033
- Table 45: Global Syngas Market Revenue million Forecast, by Technology 2020 & 2033
- Table 46: Global Syngas Market Volume Million Forecast, by Technology 2020 & 2033
- Table 47: Global Syngas Market Revenue million Forecast, by Gasifier Type 2020 & 2033
- Table 48: Global Syngas Market Volume Million Forecast, by Gasifier Type 2020 & 2033
- Table 49: Global Syngas Market Revenue million Forecast, by Application 2020 & 2033
- Table 50: Global Syngas Market Volume Million Forecast, by Application 2020 & 2033
- Table 51: Global Syngas Market Revenue million Forecast, by Country 2020 & 2033
- Table 52: Global Syngas Market Volume Million Forecast, by Country 2020 & 2033
- Table 53: Russia Syngas Market Revenue (million) Forecast, by Application 2020 & 2033
- Table 54: Russia Syngas Market Volume (Million) Forecast, by Application 2020 & 2033
- Table 55: Rest of Europe Syngas Market Revenue (million) Forecast, by Application 2020 & 2033
- Table 56: Rest of Europe Syngas Market Volume (Million) Forecast, by Application 2020 & 2033
- Table 57: Global Syngas Market Revenue million Forecast, by Feedstock 2020 & 2033
- Table 58: Global Syngas Market Volume Million Forecast, by Feedstock 2020 & 2033
- Table 59: Global Syngas Market Revenue million Forecast, by Technology 2020 & 2033
- Table 60: Global Syngas Market Volume Million Forecast, by Technology 2020 & 2033
- Table 61: Global Syngas Market Revenue million Forecast, by Gasifier Type 2020 & 2033
- Table 62: Global Syngas Market Volume Million Forecast, by Gasifier Type 2020 & 2033
- Table 63: Global Syngas Market Revenue million Forecast, by Application 2020 & 2033
- Table 64: Global Syngas Market Volume Million Forecast, by Application 2020 & 2033
- Table 65: Global Syngas Market Revenue million Forecast, by Country 2020 & 2033
- Table 66: Global Syngas Market Volume Million Forecast, by Country 2020 & 2033
- Table 67: Venezuela Syngas Market Revenue (million) Forecast, by Application 2020 & 2033
- Table 68: Venezuela Syngas Market Volume (Million) Forecast, by Application 2020 & 2033
- Table 69: Brazil Syngas Market Revenue (million) Forecast, by Application 2020 & 2033
- Table 70: Brazil Syngas Market Volume (Million) Forecast, by Application 2020 & 2033
- Table 71: Rest of South America Syngas Market Revenue (million) Forecast, by Application 2020 & 2033
- Table 72: Rest of South America Syngas Market Volume (Million) Forecast, by Application 2020 & 2033
- Table 73: Global Syngas Market Revenue million Forecast, by Feedstock 2020 & 2033
- Table 74: Global Syngas Market Volume Million Forecast, by Feedstock 2020 & 2033
- Table 75: Global Syngas Market Revenue million Forecast, by Technology 2020 & 2033
- Table 76: Global Syngas Market Volume Million Forecast, by Technology 2020 & 2033
- Table 77: Global Syngas Market Revenue million Forecast, by Gasifier Type 2020 & 2033
- Table 78: Global Syngas Market Volume Million Forecast, by Gasifier Type 2020 & 2033
- Table 79: Global Syngas Market Revenue million Forecast, by Application 2020 & 2033
- Table 80: Global Syngas Market Volume Million Forecast, by Application 2020 & 2033
- Table 81: Global Syngas Market Revenue million Forecast, by Country 2020 & 2033
- Table 82: Global Syngas Market Volume Million Forecast, by Country 2020 & 2033
- Table 83: Saudi Arabia Syngas Market Revenue (million) Forecast, by Application 2020 & 2033
- Table 84: Saudi Arabia Syngas Market Volume (Million) Forecast, by Application 2020 & 2033
- Table 85: Qatar Syngas Market Revenue (million) Forecast, by Application 2020 & 2033
- Table 86: Qatar Syngas Market Volume (Million) Forecast, by Application 2020 & 2033
- Table 87: South Africa Syngas Market Revenue (million) Forecast, by Application 2020 & 2033
- Table 88: South Africa Syngas Market Volume (Million) Forecast, by Application 2020 & 2033
- Table 89: Iran Syngas Market Revenue (million) Forecast, by Application 2020 & 2033
- Table 90: Iran Syngas Market Volume (Million) Forecast, by Application 2020 & 2033
- Table 91: Rest of Middle East and Africa Syngas Market Revenue (million) Forecast, by Application 2020 & 2033
- Table 92: Rest of Middle East and Africa Syngas Market Volume (Million) Forecast, by Application 2020 & 2033
Frequently Asked Questions
1. What is the projected Compound Annual Growth Rate (CAGR) of the Syngas Market?
The projected CAGR is approximately 11.3%.
2. Which companies are prominent players in the Syngas Market?
Key companies in the market include A H T Syngas Technology NV, Linde PLC, Shell PLC, Air Products and Chemicals Inc, KBR Inc, Airpower Technologies Limited, Sasol, Technip Energies NV, Maire Tecnimont Spa, John Wood Group PLC, Topsoe AS*List Not Exhaustive, Air Liquide.
3. What are the main segments of the Syngas Market?
The market segments include Feedstock, Technology, Gasifier Type, Application.
4. Can you provide details about the market size?
The market size is estimated to be USD 477.97 million as of 2022.
5. What are some drivers contributing to market growth?
Growing Demand in the Electricity and Chemical Industry; Increasing Environmental Awareness and Government Regulations on the Use of Renewable Fuel; Increasing Hydrogen Demand for Fertilizers.
6. What are the notable trends driving market growth?
Ammonia Segment to Dominate the Market.
7. Are there any restraints impacting market growth?
High Capital Investment and Funding.
8. Can you provide examples of recent developments in the market?
July 2022: Maire Tecnimont SpA announced that NextChem was awarded a contract by Storengy to study waste wood and solid recovered fuel conversion plant to produce biomethane in France. NextChem is expected to be responsible for the engineering services and cost estimating for the syngas purification, methanation unit, and methane upgrading.
9. What pricing options are available for accessing the report?
Pricing options include single-user, multi-user, and enterprise licenses priced at USD 4750, USD 5250, and USD 8750 respectively.
10. Is the market size provided in terms of value or volume?
The market size is provided in terms of value, measured in million and volume, measured in Million.
11. Are there any specific market keywords associated with the report?
Yes, the market keyword associated with the report is "Syngas Market," which aids in identifying and referencing the specific market segment covered.
12. How do I determine which pricing option suits my needs best?
The pricing options vary based on user requirements and access needs. Individual users may opt for single-user licenses, while businesses requiring broader access may choose multi-user or enterprise licenses for cost-effective access to the report.
13. Are there any additional resources or data provided in the Syngas Market report?
While the report offers comprehensive insights, it's advisable to review the specific contents or supplementary materials provided to ascertain if additional resources or data are available.
14. How can I stay updated on further developments or reports in the Syngas Market?
To stay informed about further developments, trends, and reports in the Syngas Market, consider subscribing to industry newsletters, following relevant companies and organizations, or regularly checking reputable industry news sources and publications.
Methodology
Step 1 - Identification of Relevant Samples Size from Population Database


Step 2 - Approaches for Defining Global Market Size (Value, Volume* & Price*)

Note*: In applicable scenarios
Step 3 - Data Sources
Primary Research
- Web Analytics
- Survey Reports
- Research Institute
- Latest Research Reports
- Opinion Leaders
Secondary Research
- Annual Reports
- White Paper
- Latest Press Release
- Industry Association
- Paid Database
- Investor Presentations

Step 4 - Data Triangulation
Involves using different sources of information in order to increase the validity of a study
These sources are likely to be stakeholders in a program - participants, other researchers, program staff, other community members, and so on.
Then we put all data in single framework & apply various statistical tools to find out the dynamic on the market.
During the analysis stage, feedback from the stakeholder groups would be compared to determine areas of agreement as well as areas of divergence