

Key Insights
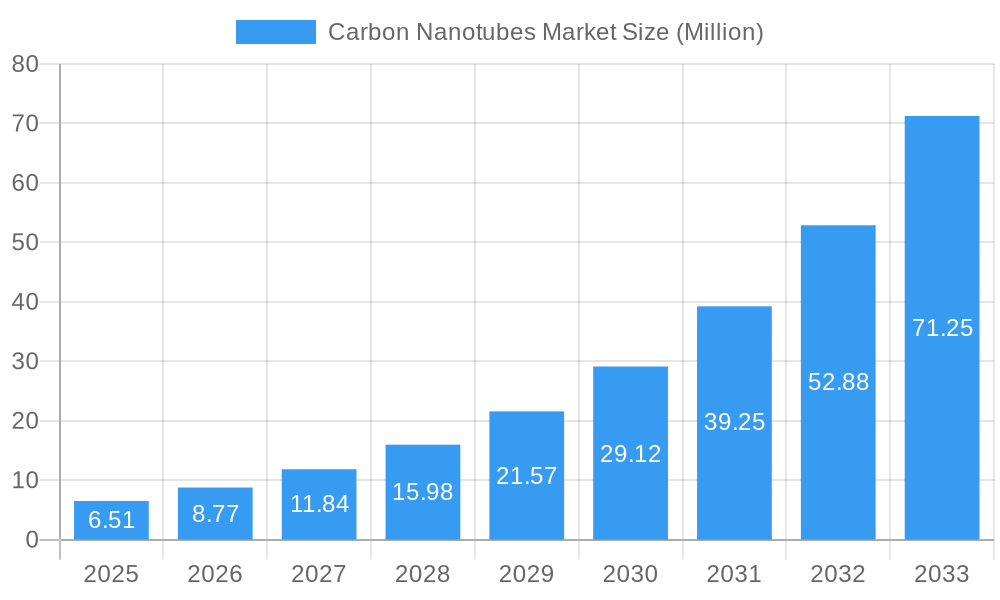
The global Carbon Nanotubes (CNT) market is experiencing a period of unprecedented growth, driven by its revolutionary properties and expanding applications across diverse industries. With a current estimated market size of USD 6.51 Million and an astonishing projected Compound Annual Growth Rate (CAGR) of 34.78% from 2025 to 2033, the market is poised for significant expansion. This robust growth is fueled by the inherent advantages of CNTs, including exceptional strength-to-weight ratios, superior electrical and thermal conductivity, and remarkable flexibility. These attributes make them indispensable in high-performance applications within the electronics sector for advanced circuitry and displays, the aerospace and defense industry for lightweight and durable components, and the automotive sector for enhancing vehicle performance and fuel efficiency. Emerging trends such as the development of novel CNT synthesis techniques for improved purity and cost-effectiveness, alongside increased research into biomedical applications for drug delivery and diagnostics, are further accelerating market adoption.
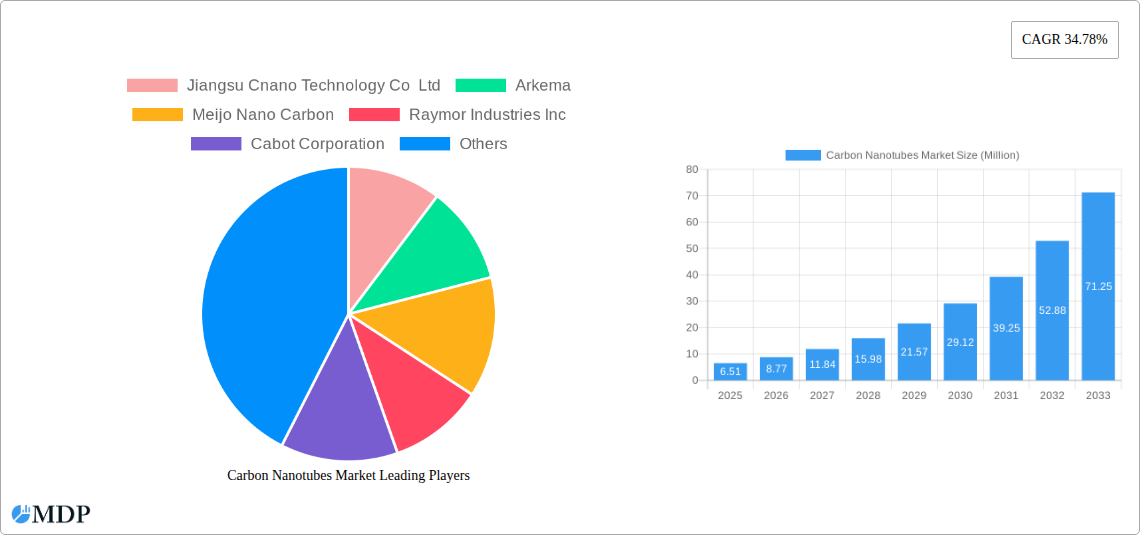
Carbon Nanotubes Market Market Size (In Million)
However, challenges such as the high cost of production for high-purity CNTs and the need for standardized safety regulations for their widespread use present hurdles. Nevertheless, the overwhelming potential of CNTs to revolutionize material science and engineering continues to drive innovation and investment. The market is segmented into Multi-walled Carbon Nanotubes (MWCNT) and Single-walled Carbon Nanotubes (SWCNT), with MWCNTs currently dominating due to their lower production costs and broader applicability. Key end-user industries like electronics, automotive, and aerospace are the primary demand generators, while emerging applications in healthcare and energy storage are expected to contribute significantly to future growth. Major players such as Jiangsu Cnano Technology Co Ltd, Arkema, and Cabot Corporation are at the forefront of developing and commercializing CNT-based solutions, solidifying the market's trajectory towards a future where carbon nanotubes are integral to cutting-edge technologies. The Asia Pacific region, particularly China, is expected to lead market expansion due to its strong manufacturing base and growing R&D investments in nanotechnology.
Carbon Nanotubes Market Company Market Share
Unlock the Future of Advanced Materials: Comprehensive Carbon Nanotubes Market Report (2019-2033)
Dive deep into the rapidly evolving Carbon Nanotubes (CNT) market with this in-depth, SEO-optimized report. We provide critical insights, actionable data, and expert analysis for industry stakeholders seeking to capitalize on the immense potential of these revolutionary nanomaterials. Covering the historical period from 2019 to 2024, base and estimated year of 2025, and a detailed forecast from 2025 to 2033, this report is your definitive guide to understanding market dynamics, identifying leading players, and navigating future opportunities in sectors like electronics, aerospace, automotive, and healthcare. Discover the intricate interplay of innovation, regulation, and competitive forces shaping the multi-billion dollar carbon nanotubes landscape.
Carbon Nanotubes Market Market Dynamics & Concentration
The global Carbon Nanotubes (CNT) market exhibits moderate to high concentration, with key players investing heavily in research and development to drive innovation. Innovation drivers are predominantly focused on enhancing CNT purity, improving production scalability, and developing novel applications across diverse industries. Regulatory frameworks are evolving, with a growing emphasis on safety standards and environmental impact assessments, influencing production methodologies and market entry barriers. Product substitutes, while present in specific applications (e.g., graphene, carbon fibers), have not yet fully replicated the unique electrical, mechanical, and thermal properties of CNTs. End-user trends reveal a surging demand for lightweight, high-strength, and conductive materials, particularly in the electronics, automotive, and aerospace sectors. Mergers and acquisitions (M&A) activities are on the rise as established chemical companies seek to bolster their CNT portfolios and expand production capacities. For instance, the consolidation within the Japanese chemical industry signifies a trend towards larger, more integrated entities. The market share of leading companies like LG Chem and Cabot Corporation is significant, driven by their robust production capabilities and strong R&D pipelines. The number of M&A deals is anticipated to increase as companies strategically acquire smaller innovators or expand through partnerships to secure market position and technological advancements.
Carbon Nanotubes Market Industry Trends & Analysis
The Carbon Nanotubes (CNT) market is poised for exceptional growth, driven by a confluence of technological advancements and escalating demand from key end-user industries. The compound annual growth rate (CAGR) is projected to remain robust throughout the forecast period (2025-2033), fueled by increasing investments in advanced materials research and the continuous development of innovative applications. Technological disruptions are a defining characteristic of this market, with ongoing breakthroughs in CNT synthesis methods leading to improved quality, reduced costs, and enhanced performance metrics. These advancements are directly translating into increased market penetration across sectors seeking superior material properties. Consumer preferences are increasingly leaning towards products that offer enhanced durability, improved energy efficiency, and lighter weight, all attributes that CNTs can significantly contribute to. This shift is particularly evident in the automotive industry's pursuit of electric vehicles and lightweight components, and in the electronics sector's demand for faster, more efficient devices. Competitive dynamics are intensifying, with a clear trend towards vertical integration and strategic collaborations among key market participants. Companies are focusing on securing raw material supply chains, optimizing production processes, and expanding their intellectual property portfolios to maintain a competitive edge. The market penetration of CNTs is expected to expand beyond niche applications into mainstream consumer goods as production costs decrease and performance benefits become more widely recognized and integrated into product designs. The ongoing evolution of manufacturing processes, including continuous flow reactors and advanced purification techniques, will play a pivotal role in meeting the growing global demand for high-quality carbon nanotubes.
Leading Markets & Segments in Carbon Nanotubes Market
The Electronics end-user industry is a dominant force in the Carbon Nanotubes (CNT) market, primarily driven by the unparalleled conductivity and mechanical strength offered by these nanomaterials. Within this segment, Multi-walled Carbon Nanotubes (MWCNT) hold a significant market share due to their comparatively lower production costs and wider range of applications compared to Single-walled Carbon Nanotubes (SWCNT).
- Dominance of Electronics: The ever-increasing demand for smaller, faster, and more powerful electronic devices, including advanced displays, flexible electronics, and high-performance batteries, directly fuels the adoption of CNTs. Their use in conductive inks, antistatic coatings, and as conductive fillers in polymers is transformative.
- MWCNT's Market Leadership: MWCNTs are preferred for their versatility in applications such as conductive additives in plastics, composites, and coatings where cost-effectiveness is a critical factor. Their robust mechanical properties also make them ideal for reinforcing materials used in electronics casings and components.
- Geographic Influence: North America and Asia Pacific are leading markets, driven by strong R&D initiatives, the presence of major electronics manufacturers, and supportive government policies promoting advanced materials innovation. Economic policies in these regions have fostered significant investment in nanotechnology research and development, leading to rapid commercialization of CNT-based products.
- Automotive Sector's Rise: The Automotive industry is rapidly emerging as a significant growth driver, particularly for lightweighting and enhancing the performance of electric vehicle (EV) components such as batteries and conductive plastics. The push for fuel efficiency and emission reduction compels automakers to explore advanced materials like CNTs.
- Aerospace and Defense Applications: The Aerospace and Defense sectors contribute to market growth with applications demanding extreme strength-to-weight ratios and enhanced thermal management. CNTs are being integrated into structural components, coatings, and advanced composites for aircraft and defense equipment.
- Healthcare's Growing Potential: While currently a smaller segment, the Healthcare industry presents substantial long-term growth potential for CNTs, with applications in drug delivery systems, biosensors, and advanced medical imaging. Regulatory approvals and further research are key to unlocking this segment's full capacity.
- Energy Sector's Demand: The Energy sector is increasingly utilizing CNTs in battery technologies, supercapacitors, and fuel cells, capitalizing on their excellent electrical conductivity and large surface area to improve energy storage and conversion efficiencies.
Carbon Nanotubes Market Product Developments
Product developments in the Carbon Nanotubes (CNT) market are largely centered on improving synthesis efficiency, purity, and tailoring CNT properties for specific high-performance applications. Innovations focus on creating CNTs with enhanced electrical conductivity for advanced electronics and batteries, superior mechanical strength for lightweight composites in aerospace and automotive, and unique thermal properties for heat dissipation solutions. Companies are actively developing functionalized CNTs to improve their dispersibility in various matrices and to enable specific chemical interactions, thereby expanding their applicability. These advancements are crucial for overcoming previous limitations and unlocking the full commercial potential of CNTs across diverse industrial sectors.
Key Drivers of Carbon Nanotubes Market Growth
The growth of the Carbon Nanotubes (CNT) market is propelled by several key drivers. Technologically, breakthroughs in cost-effective and scalable production methods are making CNTs more accessible. Economically, the increasing demand for lightweight, high-strength, and conductive materials across industries like automotive (EVs), aerospace, and electronics is a significant catalyst. Regulatory factors, such as increasing environmental consciousness and government support for advanced materials research, also play a crucial role. For example, stringent fuel efficiency standards are pushing automotive manufacturers to adopt lightweight CNT-infused composites.
Challenges in the Carbon Nanotubes Market Market
Despite its promising outlook, the Carbon Nanotubes (CNT) market faces several challenges. High production costs, particularly for high-purity single-walled CNTs, remain a significant barrier to widespread adoption. Supply chain complexities and the need for specialized handling due to nanoscale properties can also impact commercialization. Furthermore, evolving regulatory frameworks concerning nanomaterial safety and environmental impact necessitate ongoing research and compliance efforts. Competitive pressures from alternative advanced materials and the need for standardization in CNT characterization and application methodologies also present hurdles for market expansion.
Emerging Opportunities in Carbon Nanotubes Market
Emerging opportunities in the Carbon Nanotubes (CNT) market are abundant, driven by continuous technological breakthroughs and expanding application frontiers. The development of advanced CNT-based materials for next-generation batteries and supercapacitors presents a substantial growth avenue in the energy storage sector. Strategic partnerships between CNT manufacturers and end-user industries, such as automotive and electronics giants, are accelerating product integration and market adoption. Furthermore, the exploration of CNTs in emerging fields like quantum computing and advanced sensors offers significant long-term growth potential, promising to revolutionize various technological domains.
Leading Players in the Carbon Nanotubes Market Sector
- Jiangsu Cnano Technology Co Ltd
- Arkema
- Meijo Nano Carbon
- Raymor Industries Inc
- Cabot Corporation
- Nanocyl SA
- Showa Denko KK (Resonac Holdings Corporation)
- Ocsial
- Hyperion Catalysis International
- LG Chem
- Nano-C
- CHASM
- Chengdu Organic Chemicals Co Ltd (Timesnano)
- Kumho Petrochemical
Key Milestones in Carbon Nanotubes Market Industry
- May 2023: LG CHEM announced the construction of its fourth carbon nanotube (CNT) plant at Daesan, South Korea, slated for operation in 2025. This expansion aims to double LG Chem’s annual CNT production capability to 6,100 tons, significantly strengthening its product portfolio.
- January 2023: Showa Denko KK and Showa Denko Materials Co. Ltd (previously Hitachi Chemical Co. Ltd) unified on January 1, 2023, to establish two new companies: "ResonacHoldings Corporation" (holding company) and "ResonacCorporation" (manufacturing firm), signaling industry consolidation and strategic realignment.
Strategic Outlook for Carbon Nanotubes Market Market
The strategic outlook for the Carbon Nanotubes (CNT) market is overwhelmingly positive, driven by accelerating innovation and expanding industrial integration. Future market growth will be significantly shaped by advancements in producing high-quality, cost-effective CNTs at scale, particularly for the burgeoning electric vehicle battery market and next-generation electronics. Strategic opportunities lie in forging deeper collaborations between CNT suppliers and major industry players to co-develop tailored material solutions and accelerate their commercialization. Continued investment in R&D for novel applications in energy, healthcare, and advanced composites will be crucial for sustained expansion.
Carbon Nanotubes Market Segmentation
-
1. Type
- 1.1. Multi-walled Carbon Nanotubes (MWCNT)
- 1.2. Single-walled Carbon Nanotubes (SWCNT)
- 1.3. Other Ty
-
2. End-user Industry
- 2.1. Electronics
- 2.2. Aerospace and Defense
- 2.3. Automotive
- 2.4. Healthcare
- 2.5. Energy
- 2.6. Other En
Carbon Nanotubes Market Segmentation By Geography
-
1. Asia Pacific
- 1.1. China
- 1.2. India
- 1.3. Japan
- 1.4. South Korea
- 1.5. Rest of Asia Pacific
-
2. North America
- 2.1. United States
- 2.2. Canada
- 2.3. Mexico
-
3. Europe
- 3.1. Germany
- 3.2. United Kingdom
- 3.3. Italy
- 3.4. France
- 3.5. Spain
- 3.6. Rest of Europe
-
4. South America
- 4.1. Brazil
- 4.2. Argentina
- 4.3. Rest of South America
-
5. Middle East and Africa
- 5.1. Saudi Arabia
- 5.2. South Africa
- 5.3. Rest of Middle East and Africa
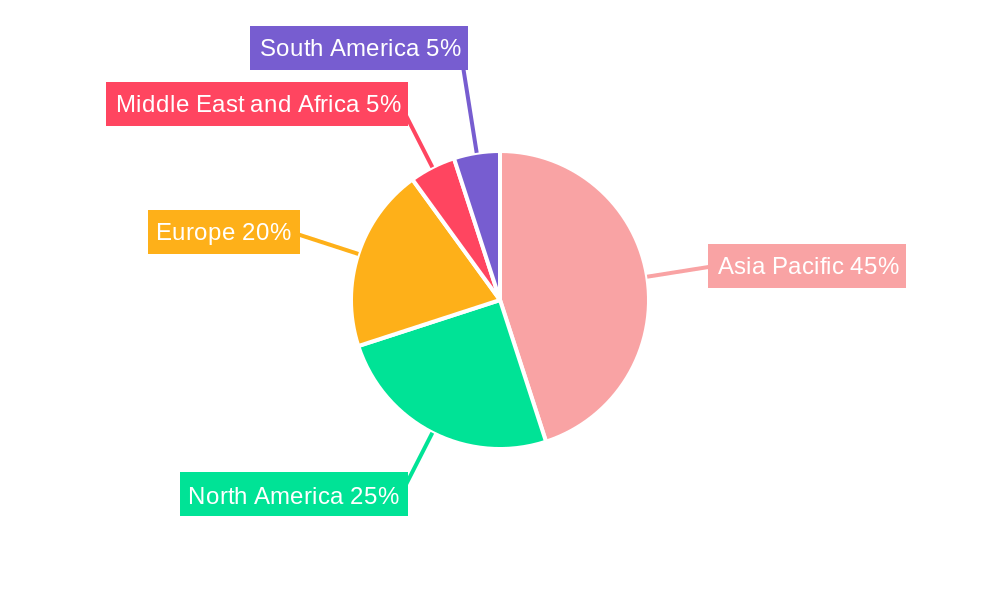
Carbon Nanotubes Market Regional Market Share
Geographic Coverage of Carbon Nanotubes Market
Carbon Nanotubes Market REPORT HIGHLIGHTS
| Aspects | Details |
|---|---|
| Study Period | 2020-2034 |
| Base Year | 2025 |
| Estimated Year | 2026 |
| Forecast Period | 2026-2034 |
| Historical Period | 2020-2025 |
| Growth Rate | CAGR of 34.78% from 2020-2034 |
| Segmentation |
|
Table of Contents
- 1. Introduction
- 1.1. Research Scope
- 1.2. Market Segmentation
- 1.3. Research Objective
- 1.4. Definitions and Assumptions
- 2. Executive Summary
- 2.1. Market Snapshot
- 3. Market Dynamics
- 3.1. Market Drivers
- 3.2. Market Restrains
- 3.3. Market Trends
- 3.4. Market Opportunities
- 4. Market Factor Analysis
- 4.1. Porters Five Forces
- 4.1.1. Bargaining Power of Suppliers
- 4.1.2. Bargaining Power of Buyers
- 4.1.3. Threat of New Entrants
- 4.1.4. Threat of Substitutes
- 4.1.5. Competitive Rivalry
- 4.2. PESTEL analysis
- 4.3. BCG Analysis
- 4.3.1. Stars (High Growth, High Market Share)
- 4.3.2. Cash Cows (Low Growth, High Market Share)
- 4.3.3. Question Mark (High Growth, Low Market Share)
- 4.3.4. Dogs (Low Growth, Low Market Share)
- 4.4. Ansoff Matrix Analysis
- 4.5. Supply Chain Analysis
- 4.6. Regulatory Landscape
- 4.7. Current Market Potential and Opportunity Assessment (TAM–SAM–SOM Framework)
- 4.8. MDP Analyst Note
- 4.1. Porters Five Forces
- 5. Market Analysis, Insights and Forecast 2021-2033
- 5.1. Market Analysis, Insights and Forecast - by Type
- 5.1.1. Multi-walled Carbon Nanotubes (MWCNT)
- 5.1.2. Single-walled Carbon Nanotubes (SWCNT)
- 5.1.3. Other Ty
- 5.2. Market Analysis, Insights and Forecast - by End-user Industry
- 5.2.1. Electronics
- 5.2.2. Aerospace and Defense
- 5.2.3. Automotive
- 5.2.4. Healthcare
- 5.2.5. Energy
- 5.2.6. Other En
- 5.3. Market Analysis, Insights and Forecast - by Region
- 5.3.1. Asia Pacific
- 5.3.2. North America
- 5.3.3. Europe
- 5.3.4. South America
- 5.3.5. Middle East and Africa
- 5.1. Market Analysis, Insights and Forecast - by Type
- 6. Global Carbon Nanotubes Market Analysis, Insights and Forecast, 2021-2033
- 6.1. Market Analysis, Insights and Forecast - by Type
- 6.1.1. Multi-walled Carbon Nanotubes (MWCNT)
- 6.1.2. Single-walled Carbon Nanotubes (SWCNT)
- 6.1.3. Other Ty
- 6.2. Market Analysis, Insights and Forecast - by End-user Industry
- 6.2.1. Electronics
- 6.2.2. Aerospace and Defense
- 6.2.3. Automotive
- 6.2.4. Healthcare
- 6.2.5. Energy
- 6.2.6. Other En
- 6.1. Market Analysis, Insights and Forecast - by Type
- 7. Asia Pacific Carbon Nanotubes Market Analysis, Insights and Forecast, 2020-2032
- 7.1. Market Analysis, Insights and Forecast - by Type
- 7.1.1. Multi-walled Carbon Nanotubes (MWCNT)
- 7.1.2. Single-walled Carbon Nanotubes (SWCNT)
- 7.1.3. Other Ty
- 7.2. Market Analysis, Insights and Forecast - by End-user Industry
- 7.2.1. Electronics
- 7.2.2. Aerospace and Defense
- 7.2.3. Automotive
- 7.2.4. Healthcare
- 7.2.5. Energy
- 7.2.6. Other En
- 7.1. Market Analysis, Insights and Forecast - by Type
- 8. North America Carbon Nanotubes Market Analysis, Insights and Forecast, 2020-2032
- 8.1. Market Analysis, Insights and Forecast - by Type
- 8.1.1. Multi-walled Carbon Nanotubes (MWCNT)
- 8.1.2. Single-walled Carbon Nanotubes (SWCNT)
- 8.1.3. Other Ty
- 8.2. Market Analysis, Insights and Forecast - by End-user Industry
- 8.2.1. Electronics
- 8.2.2. Aerospace and Defense
- 8.2.3. Automotive
- 8.2.4. Healthcare
- 8.2.5. Energy
- 8.2.6. Other En
- 8.1. Market Analysis, Insights and Forecast - by Type
- 9. Europe Carbon Nanotubes Market Analysis, Insights and Forecast, 2020-2032
- 9.1. Market Analysis, Insights and Forecast - by Type
- 9.1.1. Multi-walled Carbon Nanotubes (MWCNT)
- 9.1.2. Single-walled Carbon Nanotubes (SWCNT)
- 9.1.3. Other Ty
- 9.2. Market Analysis, Insights and Forecast - by End-user Industry
- 9.2.1. Electronics
- 9.2.2. Aerospace and Defense
- 9.2.3. Automotive
- 9.2.4. Healthcare
- 9.2.5. Energy
- 9.2.6. Other En
- 9.1. Market Analysis, Insights and Forecast - by Type
- 10. South America Carbon Nanotubes Market Analysis, Insights and Forecast, 2020-2032
- 10.1. Market Analysis, Insights and Forecast - by Type
- 10.1.1. Multi-walled Carbon Nanotubes (MWCNT)
- 10.1.2. Single-walled Carbon Nanotubes (SWCNT)
- 10.1.3. Other Ty
- 10.2. Market Analysis, Insights and Forecast - by End-user Industry
- 10.2.1. Electronics
- 10.2.2. Aerospace and Defense
- 10.2.3. Automotive
- 10.2.4. Healthcare
- 10.2.5. Energy
- 10.2.6. Other En
- 10.1. Market Analysis, Insights and Forecast - by Type
- 11. Middle East and Africa Carbon Nanotubes Market Analysis, Insights and Forecast, 2020-2032
- 11.1. Market Analysis, Insights and Forecast - by Type
- 11.1.1. Multi-walled Carbon Nanotubes (MWCNT)
- 11.1.2. Single-walled Carbon Nanotubes (SWCNT)
- 11.1.3. Other Ty
- 11.2. Market Analysis, Insights and Forecast - by End-user Industry
- 11.2.1. Electronics
- 11.2.2. Aerospace and Defense
- 11.2.3. Automotive
- 11.2.4. Healthcare
- 11.2.5. Energy
- 11.2.6. Other En
- 11.1. Market Analysis, Insights and Forecast - by Type
- 12. Competitive Analysis
- 12.1. Company Profiles
- 12.1.1 Jiangsu Cnano Technology Co Ltd
- 12.1.1.1. Company Overview
- 12.1.1.2. Products
- 12.1.1.3. Company Financials
- 12.1.1.4. SWOT Analysis
- 12.1.2 Arkema
- 12.1.2.1. Company Overview
- 12.1.2.2. Products
- 12.1.2.3. Company Financials
- 12.1.2.4. SWOT Analysis
- 12.1.3 Meijo Nano Carbon
- 12.1.3.1. Company Overview
- 12.1.3.2. Products
- 12.1.3.3. Company Financials
- 12.1.3.4. SWOT Analysis
- 12.1.4 Raymor Industries Inc
- 12.1.4.1. Company Overview
- 12.1.4.2. Products
- 12.1.4.3. Company Financials
- 12.1.4.4. SWOT Analysis
- 12.1.5 Cabot Corporation
- 12.1.5.1. Company Overview
- 12.1.5.2. Products
- 12.1.5.3. Company Financials
- 12.1.5.4. SWOT Analysis
- 12.1.6 Nanocyl SA
- 12.1.6.1. Company Overview
- 12.1.6.2. Products
- 12.1.6.3. Company Financials
- 12.1.6.4. SWOT Analysis
- 12.1.7 Showa Denko KK (Resonac Holdings Corporation)
- 12.1.7.1. Company Overview
- 12.1.7.2. Products
- 12.1.7.3. Company Financials
- 12.1.7.4. SWOT Analysis
- 12.1.8 Ocsial
- 12.1.8.1. Company Overview
- 12.1.8.2. Products
- 12.1.8.3. Company Financials
- 12.1.8.4. SWOT Analysis
- 12.1.9 Hyperion Catalysis International
- 12.1.9.1. Company Overview
- 12.1.9.2. Products
- 12.1.9.3. Company Financials
- 12.1.9.4. SWOT Analysis
- 12.1.10 LG Chem
- 12.1.10.1. Company Overview
- 12.1.10.2. Products
- 12.1.10.3. Company Financials
- 12.1.10.4. SWOT Analysis
- 12.1.11 Nano-C
- 12.1.11.1. Company Overview
- 12.1.11.2. Products
- 12.1.11.3. Company Financials
- 12.1.11.4. SWOT Analysis
- 12.1.12 CHASM
- 12.1.12.1. Company Overview
- 12.1.12.2. Products
- 12.1.12.3. Company Financials
- 12.1.12.4. SWOT Analysis
- 12.1.13 Chengdu Organic Chemicals Co Ltd (Timesnano)
- 12.1.13.1. Company Overview
- 12.1.13.2. Products
- 12.1.13.3. Company Financials
- 12.1.13.4. SWOT Analysis
- 12.1.14 Kumho Petrochemical
- 12.1.14.1. Company Overview
- 12.1.14.2. Products
- 12.1.14.3. Company Financials
- 12.1.14.4. SWOT Analysis
- 12.1.1 Jiangsu Cnano Technology Co Ltd
- 12.2. Market Entropy
- 12.2.1 Company's Key Areas Served
- 12.2.2 Recent Developments
- 12.3. Company Market Share Analysis 2025
- 12.3.1 Top 5 Companies Market Share Analysis
- 12.3.2 Top 3 Companies Market Share Analysis
- 12.4. List of Potential Customers
- 13. Research Methodology
List of Figures
- Figure 1: Global Carbon Nanotubes Market Revenue Breakdown (Million, %) by Region 2025 & 2033
- Figure 2: Global Carbon Nanotubes Market Volume Breakdown (K Tons, %) by Region 2025 & 2033
- Figure 3: Asia Pacific Carbon Nanotubes Market Revenue (Million), by Type 2025 & 2033
- Figure 4: Asia Pacific Carbon Nanotubes Market Volume (K Tons), by Type 2025 & 2033
- Figure 5: Asia Pacific Carbon Nanotubes Market Revenue Share (%), by Type 2025 & 2033
- Figure 6: Asia Pacific Carbon Nanotubes Market Volume Share (%), by Type 2025 & 2033
- Figure 7: Asia Pacific Carbon Nanotubes Market Revenue (Million), by End-user Industry 2025 & 2033
- Figure 8: Asia Pacific Carbon Nanotubes Market Volume (K Tons), by End-user Industry 2025 & 2033
- Figure 9: Asia Pacific Carbon Nanotubes Market Revenue Share (%), by End-user Industry 2025 & 2033
- Figure 10: Asia Pacific Carbon Nanotubes Market Volume Share (%), by End-user Industry 2025 & 2033
- Figure 11: Asia Pacific Carbon Nanotubes Market Revenue (Million), by Country 2025 & 2033
- Figure 12: Asia Pacific Carbon Nanotubes Market Volume (K Tons), by Country 2025 & 2033
- Figure 13: Asia Pacific Carbon Nanotubes Market Revenue Share (%), by Country 2025 & 2033
- Figure 14: Asia Pacific Carbon Nanotubes Market Volume Share (%), by Country 2025 & 2033
- Figure 15: North America Carbon Nanotubes Market Revenue (Million), by Type 2025 & 2033
- Figure 16: North America Carbon Nanotubes Market Volume (K Tons), by Type 2025 & 2033
- Figure 17: North America Carbon Nanotubes Market Revenue Share (%), by Type 2025 & 2033
- Figure 18: North America Carbon Nanotubes Market Volume Share (%), by Type 2025 & 2033
- Figure 19: North America Carbon Nanotubes Market Revenue (Million), by End-user Industry 2025 & 2033
- Figure 20: North America Carbon Nanotubes Market Volume (K Tons), by End-user Industry 2025 & 2033
- Figure 21: North America Carbon Nanotubes Market Revenue Share (%), by End-user Industry 2025 & 2033
- Figure 22: North America Carbon Nanotubes Market Volume Share (%), by End-user Industry 2025 & 2033
- Figure 23: North America Carbon Nanotubes Market Revenue (Million), by Country 2025 & 2033
- Figure 24: North America Carbon Nanotubes Market Volume (K Tons), by Country 2025 & 2033
- Figure 25: North America Carbon Nanotubes Market Revenue Share (%), by Country 2025 & 2033
- Figure 26: North America Carbon Nanotubes Market Volume Share (%), by Country 2025 & 2033
- Figure 27: Europe Carbon Nanotubes Market Revenue (Million), by Type 2025 & 2033
- Figure 28: Europe Carbon Nanotubes Market Volume (K Tons), by Type 2025 & 2033
- Figure 29: Europe Carbon Nanotubes Market Revenue Share (%), by Type 2025 & 2033
- Figure 30: Europe Carbon Nanotubes Market Volume Share (%), by Type 2025 & 2033
- Figure 31: Europe Carbon Nanotubes Market Revenue (Million), by End-user Industry 2025 & 2033
- Figure 32: Europe Carbon Nanotubes Market Volume (K Tons), by End-user Industry 2025 & 2033
- Figure 33: Europe Carbon Nanotubes Market Revenue Share (%), by End-user Industry 2025 & 2033
- Figure 34: Europe Carbon Nanotubes Market Volume Share (%), by End-user Industry 2025 & 2033
- Figure 35: Europe Carbon Nanotubes Market Revenue (Million), by Country 2025 & 2033
- Figure 36: Europe Carbon Nanotubes Market Volume (K Tons), by Country 2025 & 2033
- Figure 37: Europe Carbon Nanotubes Market Revenue Share (%), by Country 2025 & 2033
- Figure 38: Europe Carbon Nanotubes Market Volume Share (%), by Country 2025 & 2033
- Figure 39: South America Carbon Nanotubes Market Revenue (Million), by Type 2025 & 2033
- Figure 40: South America Carbon Nanotubes Market Volume (K Tons), by Type 2025 & 2033
- Figure 41: South America Carbon Nanotubes Market Revenue Share (%), by Type 2025 & 2033
- Figure 42: South America Carbon Nanotubes Market Volume Share (%), by Type 2025 & 2033
- Figure 43: South America Carbon Nanotubes Market Revenue (Million), by End-user Industry 2025 & 2033
- Figure 44: South America Carbon Nanotubes Market Volume (K Tons), by End-user Industry 2025 & 2033
- Figure 45: South America Carbon Nanotubes Market Revenue Share (%), by End-user Industry 2025 & 2033
- Figure 46: South America Carbon Nanotubes Market Volume Share (%), by End-user Industry 2025 & 2033
- Figure 47: South America Carbon Nanotubes Market Revenue (Million), by Country 2025 & 2033
- Figure 48: South America Carbon Nanotubes Market Volume (K Tons), by Country 2025 & 2033
- Figure 49: South America Carbon Nanotubes Market Revenue Share (%), by Country 2025 & 2033
- Figure 50: South America Carbon Nanotubes Market Volume Share (%), by Country 2025 & 2033
- Figure 51: Middle East and Africa Carbon Nanotubes Market Revenue (Million), by Type 2025 & 2033
- Figure 52: Middle East and Africa Carbon Nanotubes Market Volume (K Tons), by Type 2025 & 2033
- Figure 53: Middle East and Africa Carbon Nanotubes Market Revenue Share (%), by Type 2025 & 2033
- Figure 54: Middle East and Africa Carbon Nanotubes Market Volume Share (%), by Type 2025 & 2033
- Figure 55: Middle East and Africa Carbon Nanotubes Market Revenue (Million), by End-user Industry 2025 & 2033
- Figure 56: Middle East and Africa Carbon Nanotubes Market Volume (K Tons), by End-user Industry 2025 & 2033
- Figure 57: Middle East and Africa Carbon Nanotubes Market Revenue Share (%), by End-user Industry 2025 & 2033
- Figure 58: Middle East and Africa Carbon Nanotubes Market Volume Share (%), by End-user Industry 2025 & 2033
- Figure 59: Middle East and Africa Carbon Nanotubes Market Revenue (Million), by Country 2025 & 2033
- Figure 60: Middle East and Africa Carbon Nanotubes Market Volume (K Tons), by Country 2025 & 2033
- Figure 61: Middle East and Africa Carbon Nanotubes Market Revenue Share (%), by Country 2025 & 2033
- Figure 62: Middle East and Africa Carbon Nanotubes Market Volume Share (%), by Country 2025 & 2033
List of Tables
- Table 1: Global Carbon Nanotubes Market Revenue Million Forecast, by Type 2020 & 2033
- Table 2: Global Carbon Nanotubes Market Volume K Tons Forecast, by Type 2020 & 2033
- Table 3: Global Carbon Nanotubes Market Revenue Million Forecast, by End-user Industry 2020 & 2033
- Table 4: Global Carbon Nanotubes Market Volume K Tons Forecast, by End-user Industry 2020 & 2033
- Table 5: Global Carbon Nanotubes Market Revenue Million Forecast, by Region 2020 & 2033
- Table 6: Global Carbon Nanotubes Market Volume K Tons Forecast, by Region 2020 & 2033
- Table 7: Global Carbon Nanotubes Market Revenue Million Forecast, by Type 2020 & 2033
- Table 8: Global Carbon Nanotubes Market Volume K Tons Forecast, by Type 2020 & 2033
- Table 9: Global Carbon Nanotubes Market Revenue Million Forecast, by End-user Industry 2020 & 2033
- Table 10: Global Carbon Nanotubes Market Volume K Tons Forecast, by End-user Industry 2020 & 2033
- Table 11: Global Carbon Nanotubes Market Revenue Million Forecast, by Country 2020 & 2033
- Table 12: Global Carbon Nanotubes Market Volume K Tons Forecast, by Country 2020 & 2033
- Table 13: China Carbon Nanotubes Market Revenue (Million) Forecast, by Application 2020 & 2033
- Table 14: China Carbon Nanotubes Market Volume (K Tons) Forecast, by Application 2020 & 2033
- Table 15: India Carbon Nanotubes Market Revenue (Million) Forecast, by Application 2020 & 2033
- Table 16: India Carbon Nanotubes Market Volume (K Tons) Forecast, by Application 2020 & 2033
- Table 17: Japan Carbon Nanotubes Market Revenue (Million) Forecast, by Application 2020 & 2033
- Table 18: Japan Carbon Nanotubes Market Volume (K Tons) Forecast, by Application 2020 & 2033
- Table 19: South Korea Carbon Nanotubes Market Revenue (Million) Forecast, by Application 2020 & 2033
- Table 20: South Korea Carbon Nanotubes Market Volume (K Tons) Forecast, by Application 2020 & 2033
- Table 21: Rest of Asia Pacific Carbon Nanotubes Market Revenue (Million) Forecast, by Application 2020 & 2033
- Table 22: Rest of Asia Pacific Carbon Nanotubes Market Volume (K Tons) Forecast, by Application 2020 & 2033
- Table 23: Global Carbon Nanotubes Market Revenue Million Forecast, by Type 2020 & 2033
- Table 24: Global Carbon Nanotubes Market Volume K Tons Forecast, by Type 2020 & 2033
- Table 25: Global Carbon Nanotubes Market Revenue Million Forecast, by End-user Industry 2020 & 2033
- Table 26: Global Carbon Nanotubes Market Volume K Tons Forecast, by End-user Industry 2020 & 2033
- Table 27: Global Carbon Nanotubes Market Revenue Million Forecast, by Country 2020 & 2033
- Table 28: Global Carbon Nanotubes Market Volume K Tons Forecast, by Country 2020 & 2033
- Table 29: United States Carbon Nanotubes Market Revenue (Million) Forecast, by Application 2020 & 2033
- Table 30: United States Carbon Nanotubes Market Volume (K Tons) Forecast, by Application 2020 & 2033
- Table 31: Canada Carbon Nanotubes Market Revenue (Million) Forecast, by Application 2020 & 2033
- Table 32: Canada Carbon Nanotubes Market Volume (K Tons) Forecast, by Application 2020 & 2033
- Table 33: Mexico Carbon Nanotubes Market Revenue (Million) Forecast, by Application 2020 & 2033
- Table 34: Mexico Carbon Nanotubes Market Volume (K Tons) Forecast, by Application 2020 & 2033
- Table 35: Global Carbon Nanotubes Market Revenue Million Forecast, by Type 2020 & 2033
- Table 36: Global Carbon Nanotubes Market Volume K Tons Forecast, by Type 2020 & 2033
- Table 37: Global Carbon Nanotubes Market Revenue Million Forecast, by End-user Industry 2020 & 2033
- Table 38: Global Carbon Nanotubes Market Volume K Tons Forecast, by End-user Industry 2020 & 2033
- Table 39: Global Carbon Nanotubes Market Revenue Million Forecast, by Country 2020 & 2033
- Table 40: Global Carbon Nanotubes Market Volume K Tons Forecast, by Country 2020 & 2033
- Table 41: Germany Carbon Nanotubes Market Revenue (Million) Forecast, by Application 2020 & 2033
- Table 42: Germany Carbon Nanotubes Market Volume (K Tons) Forecast, by Application 2020 & 2033
- Table 43: United Kingdom Carbon Nanotubes Market Revenue (Million) Forecast, by Application 2020 & 2033
- Table 44: United Kingdom Carbon Nanotubes Market Volume (K Tons) Forecast, by Application 2020 & 2033
- Table 45: Italy Carbon Nanotubes Market Revenue (Million) Forecast, by Application 2020 & 2033
- Table 46: Italy Carbon Nanotubes Market Volume (K Tons) Forecast, by Application 2020 & 2033
- Table 47: France Carbon Nanotubes Market Revenue (Million) Forecast, by Application 2020 & 2033
- Table 48: France Carbon Nanotubes Market Volume (K Tons) Forecast, by Application 2020 & 2033
- Table 49: Spain Carbon Nanotubes Market Revenue (Million) Forecast, by Application 2020 & 2033
- Table 50: Spain Carbon Nanotubes Market Volume (K Tons) Forecast, by Application 2020 & 2033
- Table 51: Rest of Europe Carbon Nanotubes Market Revenue (Million) Forecast, by Application 2020 & 2033
- Table 52: Rest of Europe Carbon Nanotubes Market Volume (K Tons) Forecast, by Application 2020 & 2033
- Table 53: Global Carbon Nanotubes Market Revenue Million Forecast, by Type 2020 & 2033
- Table 54: Global Carbon Nanotubes Market Volume K Tons Forecast, by Type 2020 & 2033
- Table 55: Global Carbon Nanotubes Market Revenue Million Forecast, by End-user Industry 2020 & 2033
- Table 56: Global Carbon Nanotubes Market Volume K Tons Forecast, by End-user Industry 2020 & 2033
- Table 57: Global Carbon Nanotubes Market Revenue Million Forecast, by Country 2020 & 2033
- Table 58: Global Carbon Nanotubes Market Volume K Tons Forecast, by Country 2020 & 2033
- Table 59: Brazil Carbon Nanotubes Market Revenue (Million) Forecast, by Application 2020 & 2033
- Table 60: Brazil Carbon Nanotubes Market Volume (K Tons) Forecast, by Application 2020 & 2033
- Table 61: Argentina Carbon Nanotubes Market Revenue (Million) Forecast, by Application 2020 & 2033
- Table 62: Argentina Carbon Nanotubes Market Volume (K Tons) Forecast, by Application 2020 & 2033
- Table 63: Rest of South America Carbon Nanotubes Market Revenue (Million) Forecast, by Application 2020 & 2033
- Table 64: Rest of South America Carbon Nanotubes Market Volume (K Tons) Forecast, by Application 2020 & 2033
- Table 65: Global Carbon Nanotubes Market Revenue Million Forecast, by Type 2020 & 2033
- Table 66: Global Carbon Nanotubes Market Volume K Tons Forecast, by Type 2020 & 2033
- Table 67: Global Carbon Nanotubes Market Revenue Million Forecast, by End-user Industry 2020 & 2033
- Table 68: Global Carbon Nanotubes Market Volume K Tons Forecast, by End-user Industry 2020 & 2033
- Table 69: Global Carbon Nanotubes Market Revenue Million Forecast, by Country 2020 & 2033
- Table 70: Global Carbon Nanotubes Market Volume K Tons Forecast, by Country 2020 & 2033
- Table 71: Saudi Arabia Carbon Nanotubes Market Revenue (Million) Forecast, by Application 2020 & 2033
- Table 72: Saudi Arabia Carbon Nanotubes Market Volume (K Tons) Forecast, by Application 2020 & 2033
- Table 73: South Africa Carbon Nanotubes Market Revenue (Million) Forecast, by Application 2020 & 2033
- Table 74: South Africa Carbon Nanotubes Market Volume (K Tons) Forecast, by Application 2020 & 2033
- Table 75: Rest of Middle East and Africa Carbon Nanotubes Market Revenue (Million) Forecast, by Application 2020 & 2033
- Table 76: Rest of Middle East and Africa Carbon Nanotubes Market Volume (K Tons) Forecast, by Application 2020 & 2033
Frequently Asked Questions
1. What is the projected Compound Annual Growth Rate (CAGR) of the Carbon Nanotubes Market?
The projected CAGR is approximately 34.78%.
2. Which companies are prominent players in the Carbon Nanotubes Market?
Key companies in the market include Jiangsu Cnano Technology Co Ltd, Arkema, Meijo Nano Carbon, Raymor Industries Inc, Cabot Corporation, Nanocyl SA, Showa Denko KK (Resonac Holdings Corporation), Ocsial, Hyperion Catalysis International, LG Chem, Nano-C, CHASM, Chengdu Organic Chemicals Co Ltd (Timesnano), Kumho Petrochemical.
3. What are the main segments of the Carbon Nanotubes Market?
The market segments include Type, End-user Industry.
4. Can you provide details about the market size?
The market size is estimated to be USD 6.51 Million as of 2022.
5. What are some drivers contributing to market growth?
Growing Usage of Carbon Nantotubes in Electric Vehicles; Increasing Demand for Advance Materials in Numerous Applications.
6. What are the notable trends driving market growth?
Energy Segment to Dominate the Market.
7. Are there any restraints impacting market growth?
Environmental Concerns and Health Safety Issues; Other Restraints.
8. Can you provide examples of recent developments in the market?
May 2023: LG CHEM announced the construction of its fourth carbon nanotube (CNT) plant at Daesan, South Korea. The plant is slated for operation in 2025. Through the expansion, the company contributes to doubling LG Chem’s annual CNT production capability to 6,100 tons, strengthening its product portfolio.
9. What pricing options are available for accessing the report?
Pricing options include single-user, multi-user, and enterprise licenses priced at USD 4750, USD 5250, and USD 8750 respectively.
10. Is the market size provided in terms of value or volume?
The market size is provided in terms of value, measured in Million and volume, measured in K Tons.
11. Are there any specific market keywords associated with the report?
Yes, the market keyword associated with the report is "Carbon Nanotubes Market," which aids in identifying and referencing the specific market segment covered.
12. How do I determine which pricing option suits my needs best?
The pricing options vary based on user requirements and access needs. Individual users may opt for single-user licenses, while businesses requiring broader access may choose multi-user or enterprise licenses for cost-effective access to the report.
13. Are there any additional resources or data provided in the Carbon Nanotubes Market report?
While the report offers comprehensive insights, it's advisable to review the specific contents or supplementary materials provided to ascertain if additional resources or data are available.
14. How can I stay updated on further developments or reports in the Carbon Nanotubes Market?
To stay informed about further developments, trends, and reports in the Carbon Nanotubes Market, consider subscribing to industry newsletters, following relevant companies and organizations, or regularly checking reputable industry news sources and publications.
Methodology
Step 1 - Identification of Relevant Samples Size from Population Database


Step 2 - Approaches for Defining Global Market Size (Value, Volume* & Price*)

Note*: In applicable scenarios
Step 3 - Data Sources
Primary Research
- Web Analytics
- Survey Reports
- Research Institute
- Latest Research Reports
- Opinion Leaders
Secondary Research
- Annual Reports
- White Paper
- Latest Press Release
- Industry Association
- Paid Database
- Investor Presentations

Step 4 - Data Triangulation
Involves using different sources of information in order to increase the validity of a study
These sources are likely to be stakeholders in a program - participants, other researchers, program staff, other community members, and so on.
Then we put all data in single framework & apply various statistical tools to find out the dynamic on the market.
During the analysis stage, feedback from the stakeholder groups would be compared to determine areas of agreement as well as areas of divergence