

Key Insights
The global Zeolite market is poised for robust expansion, projected to reach approximately USD 2.89 billion in 2024, with a healthy Compound Annual Growth Rate (CAGR) of 3.8% anticipated to continue through 2033. This growth is significantly fueled by the increasing demand for zeolites across a spectrum of industrial applications, primarily as essential components in adsorbents and catalysts. The petrochemical industry's ongoing need for efficient refining processes and the burgeoning biogas sector, both heavily reliant on zeolite technology for purification and conversion, are key drivers. Furthermore, the escalating global focus on environmental sustainability is propelling the use of zeolites in water treatment and air purification systems, addressing concerns related to pollution control and resource management. The versatility of zeolites in molecular sieving and ion exchange capabilities makes them indispensable in these critical areas.
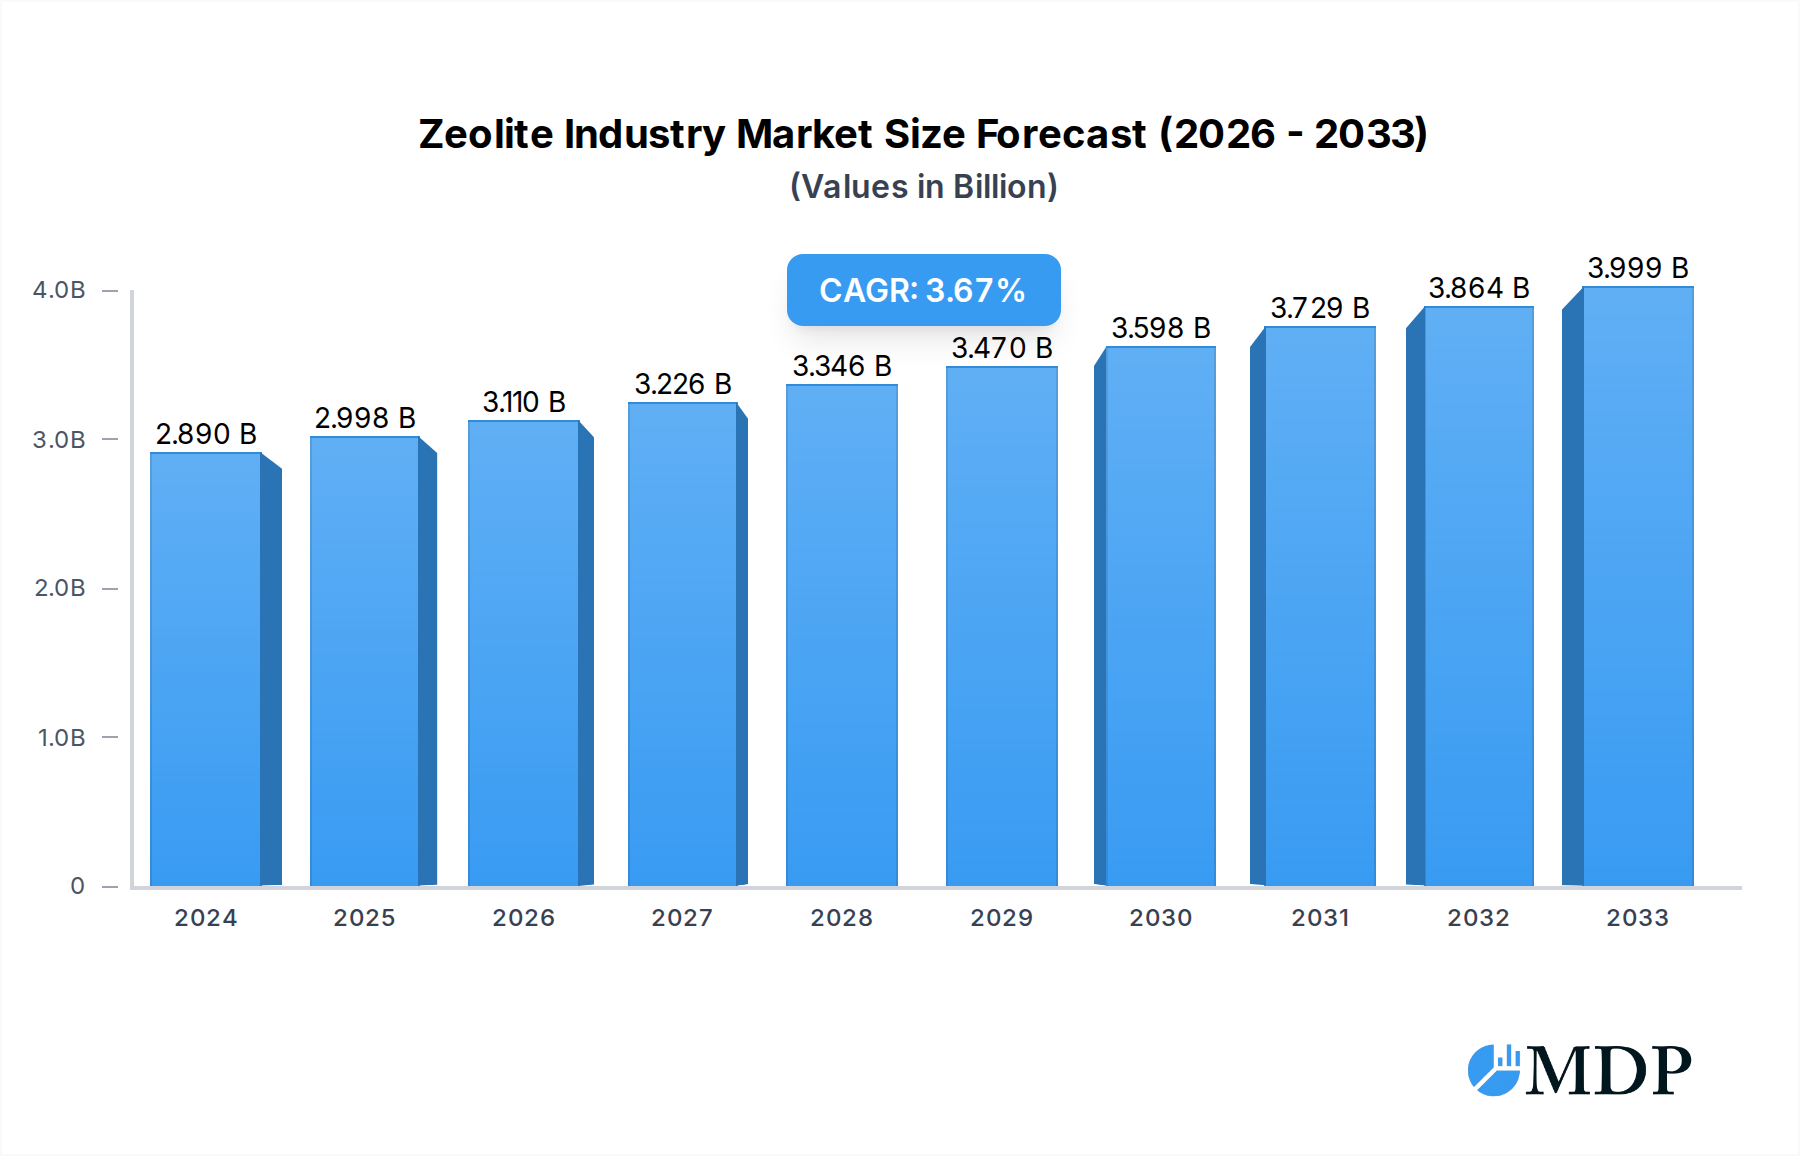
Zeolite Industry Market Size (In Billion)
The market's upward trajectory is further supported by the expanding applications in agriculture, for soil conditioning and nutrient delivery, and in the construction industry, where zeolites enhance concrete properties. While the market is primarily segmented into natural and synthetic zeolites, with synthetic variants offering tailored properties for specific high-performance applications, the overall demand landscape remains favorable. Key industry players are actively investing in research and development to innovate new zeolite formulations and enhance production efficiencies, further stimulating market growth. Potential restraints, such as the cost of production for certain synthetic zeolites and the availability of raw materials, are being addressed through technological advancements and strategic sourcing initiatives, ensuring the continued upward trend of this vital market.

Zeolite Industry Company Market Share
Unlocking the Billion-Dollar Zeolite Market: A Comprehensive Growth & Innovation Report (2019-2033)
This in-depth report provides an exhaustive analysis of the global zeolite industry, forecasting market expansion to over one billion dollars by 2025 and projecting sustained growth through 2033. Dive deep into the dynamic forces shaping this critical sector, from groundbreaking technological advancements to evolving end-user demands. We offer actionable insights for stakeholders seeking to capitalize on emerging opportunities in adsorbents, catalysts, detergents, and other high-growth applications across water treatment, air purification, agriculture, petrochemicals, and construction.
Zeolite Industry Market Dynamics & Concentration
The zeolite industry exhibits a moderate to high concentration, with a few dominant players holding significant market share. Key innovation drivers include the demand for sustainable solutions, enhanced catalyst performance, and advanced material science. Regulatory frameworks, particularly concerning environmental protection and emissions control, are increasingly influencing product development and adoption. Product substitutes, such as activated carbon and silica gel for certain adsorbent applications, exist but often fall short in terms of specific performance characteristics and regeneration capabilities offered by zeolites. End-user trends highlight a growing preference for zeolites in green technologies, including biogas upgrading and efficient wastewater treatment. Merger and acquisition (M&A) activities, while not rampant, are strategically focused on consolidating market presence, acquiring novel technologies, and expanding geographical reach. We anticipate a consistent stream of ten to twenty strategic M&A deals annually throughout the forecast period. The market share of leading companies is estimated to range from five to fifteen percent.
Zeolite Industry Industry Trends & Analysis
The global zeolite market is on an upward trajectory, driven by escalating demand for efficient and environmentally friendly solutions across a multitude of industries. The projected Compound Annual Growth Rate (CAGR) from 2025 to 2033 is an impressive six to eight percent, with the market size expected to reach well over one billion dollars within this timeframe. Technological disruptions are at the forefront, with continuous advancements in synthetic zeolite production leading to customized materials with tailored pore structures and functionalities. This innovation directly fuels their adoption in high-performance catalysts for petrochemical refining, where increased yields and reduced emissions are paramount. Consumer preferences are increasingly leaning towards eco-conscious products, bolstering the use of zeolites in laundry detergents as phosphate substitutes, contributing to cleaner waterways. Furthermore, the burgeoning green tech sector is a significant growth engine, with zeolites playing a crucial role in air purification systems for industrial and residential use, as well as in the efficient separation and purification of biogas for renewable energy production. Market penetration of zeolites in niche applications is steadily increasing, driven by their superior adsorption and ion-exchange properties. Competitive dynamics are characterized by a balance between established chemical giants and specialized zeolite manufacturers, all vying for market leadership through product differentiation and strategic collaborations. The market is projected to surpass one billion units in sales volume by 2030.
Leading Markets & Segments in Zeolite Industry
The Asia Pacific region is poised to dominate the global zeolite market, driven by rapid industrialization, robust manufacturing sectors, and increasing environmental regulations. Within this region, China stands out as a leading country due to its extensive petrochemical industry and growing demand for high-efficiency catalysts and adsorbents.
Dominant Segments:
Product Type:
- Synthetic Zeolites: Expected to lead due to their tailor-made properties for specific applications, offering superior performance and consistency compared to natural counterparts.
- Key Drivers: Advanced manufacturing techniques, precise control over pore size and structure, and suitability for high-tech applications like advanced catalysis and molecular sieves.
- Natural Zeolites: Will continue to hold a significant share, particularly in cost-sensitive applications like agriculture and certain water treatment processes.
- Key Drivers: Abundant reserves, lower production costs, and established use in traditional applications.
- Synthetic Zeolites: Expected to lead due to their tailor-made properties for specific applications, offering superior performance and consistency compared to natural counterparts.
Application:
- Catalysts: This segment is projected to witness the most substantial growth, propelled by the petrochemical and refining industries' need for advanced catalytic materials to improve efficiency and reduce environmental impact.
- Key Drivers: Demand for cleaner fuels, stricter emission standards, and the development of more selective and durable catalysts.
- Adsorbents: Crucial for purification processes, this segment will see consistent demand from water treatment, air purification, and industrial gas separation.
- Key Drivers: Growing concerns over water scarcity and pollution, rising air quality standards, and the need for efficient separation of industrial gases.
- Detergents: While a mature market, zeolites will maintain their position as effective builders in laundry detergents, contributing to eco-friendly formulations.
- Key Drivers: Environmental regulations limiting phosphate use and consumer demand for sustainable household products.
- Other Applications (Refining, Biogas): This segment is experiencing rapid expansion, particularly in biogas upgrading for renewable natural gas production and in specialized refining processes.
- Key Drivers: Global push for renewable energy, advancements in biogas purification technologies, and the pursuit of higher yields in oil and gas processing.
- Catalysts: This segment is projected to witness the most substantial growth, propelled by the petrochemical and refining industries' need for advanced catalytic materials to improve efficiency and reduce environmental impact.
End-user Industry:
- Petrochemical: This industry remains a primary consumer of zeolites, utilizing them extensively as catalysts in cracking, isomerization, and other critical refining processes.
- Key Drivers: Demand for gasoline and diesel, optimization of refinery operations, and the development of advanced petrochemical products.
- Water Treatment: The increasing global focus on clean water and wastewater management will drive significant growth in this sector.
- Key Drivers: Stringent environmental regulations, growing population, and industrial wastewater treatment needs.
- Air Purification: With rising concerns about air quality, the demand for zeolites in both industrial and residential air filtration systems is expected to surge.
- Key Drivers: Urbanization, industrial emissions, and health awareness regarding indoor air quality.
- Agriculture: Zeolites find applications in soil conditioning, animal feed additives, and controlled release of fertilizers, contributing to sustainable farming practices.
- Key Drivers: Need for improved soil health, enhanced crop yields, and sustainable agricultural practices.
- Construction: Zeolites are increasingly incorporated into building materials for their insulating and moisture-absorbing properties.
- Key Drivers: Demand for energy-efficient buildings and innovative construction materials.
- Petrochemical: This industry remains a primary consumer of zeolites, utilizing them extensively as catalysts in cracking, isomerization, and other critical refining processes.
Zeolite Industry Product Developments
Recent product developments in the zeolite industry are characterized by a strong focus on enhancing performance and expanding applications. Innovations are geared towards creating zeolites with precisely engineered pore structures and surface chemistries, leading to superior selectivity and activity in catalytic processes. New synthetic routes are enabling cost-effective production of high-purity zeolites, making them more accessible for emerging applications like carbon capture and advanced battery materials. The development of zeolite-based membranes for gas separation and purification is also gaining traction, offering energy-efficient alternatives to traditional methods. These advancements are driven by a commitment to sustainability and the need for specialized materials that can address complex industrial and environmental challenges, further solidifying zeolites' competitive advantage.
Key Drivers of Zeolite Industry Growth
The zeolite industry's robust growth is fueled by several interconnected factors. Technological advancements in synthesis and functionalization are continuously expanding the performance envelope of zeolites, enabling their use in more demanding applications. The global imperative for environmental sustainability is a primary driver, with zeolites offering crucial solutions in pollution control, emissions reduction, and renewable energy production. Stricter regulatory frameworks worldwide are mandating the use of cleaner technologies, where zeolites play a pivotal role as catalysts and adsorbents. Furthermore, economic growth in emerging economies translates to increased industrial activity, particularly in petrochemicals and construction, further boosting demand for zeolites. The increasing recognition of zeolites' superior performance and versatility across diverse sectors underpins this sustained growth trajectory.
Challenges in the Zeolite Industry Market
Despite its promising outlook, the zeolite industry faces several challenges. High production costs associated with certain high-purity synthetic zeolites can be a barrier to adoption in price-sensitive markets. Supply chain complexities and the availability of raw materials can also impact production and pricing stability. Intense competitive pressure from alternative materials and existing technologies necessitates continuous innovation and cost optimization. Navigating complex and evolving regulatory landscapes across different regions can also pose challenges for market entry and compliance. Overcoming these hurdles will be critical for unlocking the full potential of the billion-dollar zeolite market.
Emerging Opportunities in Zeolite Industry
Emerging opportunities in the zeolite industry are abundant, driven by global megatrends. The burgeoning demand for sustainable energy solutions presents significant growth prospects in biogas upgrading, CO2 capture, and hydrogen production. Advancements in materials science are unlocking new applications in pharmaceuticals, sensors, and advanced electronics. The increasing focus on circular economy principles is also creating opportunities for zeolites in waste valorization and resource recovery. Strategic partnerships between zeolite manufacturers, research institutions, and end-users are crucial for co-developing innovative solutions and accelerating market penetration in these high-potential areas, further solidifying their position in the multi-billion dollar market.
Leading Players in the Zeolite Industry Sector
- Honeywell International Inc
- Clariant
- SHOWA DENKO KK
- International Zeolite Corp
- Zeomex
- Interra Global
- KNT Group
- ZEOCEM AS
- BASF SE
- Arkema Group
- Tosoh Corporation
- W R Grace & Co
- Zeolyst International Inc
Key Milestones in Zeolite Industry Industry
- December 2022: International Zeolite Corp. announced an agreement with Niagara College's Horticultural & Environmental Sciences Innovation Centre (HESIC) for priority research support on IZ's proprietary grow system NEREA, marking a significant step in agricultural innovation.
- February 2022: International Zeolite Corp. and CoTec Holdings Corp. finalized a USD 2 million strategic investment in IZ, aimed at accelerating its go-to-market activities and commercialization in the agricultural and green tech segments, underscoring a commitment to disruptive agricultural solutions.
Strategic Outlook for Zeolite Industry Market
The strategic outlook for the zeolite industry is exceptionally bright, characterized by sustained innovation and expanding market reach. Growth accelerators include the increasing adoption of zeolites in carbon capture technologies, the development of advanced catalysts for cleaner fuel production, and their crucial role in sustainable agriculture and water management. Strategic opportunities lie in the exploration of novel applications in areas like pharmaceuticals, battery technology, and advanced materials. The industry is poised to witness continued expansion driven by a global commitment to sustainability and the unique, versatile properties of zeolites. This multi-billion dollar market offers significant potential for stakeholders who can align their strategies with these burgeoning trends and technological advancements.
Zeolite Industry Segmentation
-
1. Product Type
- 1.1. Natural
- 1.2. Synthetic
-
2. Application
- 2.1. Adsorbents
- 2.2. Catalysts
- 2.3. Detergents
- 2.4. Other Applications (Refining, Biogas)
-
3. End-user Industry
- 3.1. Water Treatment
- 3.2. Air Purification
- 3.3. Agriculture
- 3.4. Petrochemical
- 3.5. Construction
- 3.6. Other En
Zeolite Industry Segmentation By Geography
-
1. Asia Pacific
- 1.1. China
- 1.2. India
- 1.3. Japan
- 1.4. South Korea
- 1.5. Rest of Asia Pacific
-
2. North America
- 2.1. United States
- 2.2. Canada
- 2.3. Mexico
-
3. Europe
- 3.1. Germany
- 3.2. United Kingdom
- 3.3. Italy
- 3.4. France
- 3.5. Rest of Europe
-
4. South America
- 4.1. Brazil
- 4.2. Argentina
- 4.3. Rest of South America
- 5. Middle East
-
6. Saudi Arabia
- 6.1. South Africa
- 6.2. Rest of Middle East
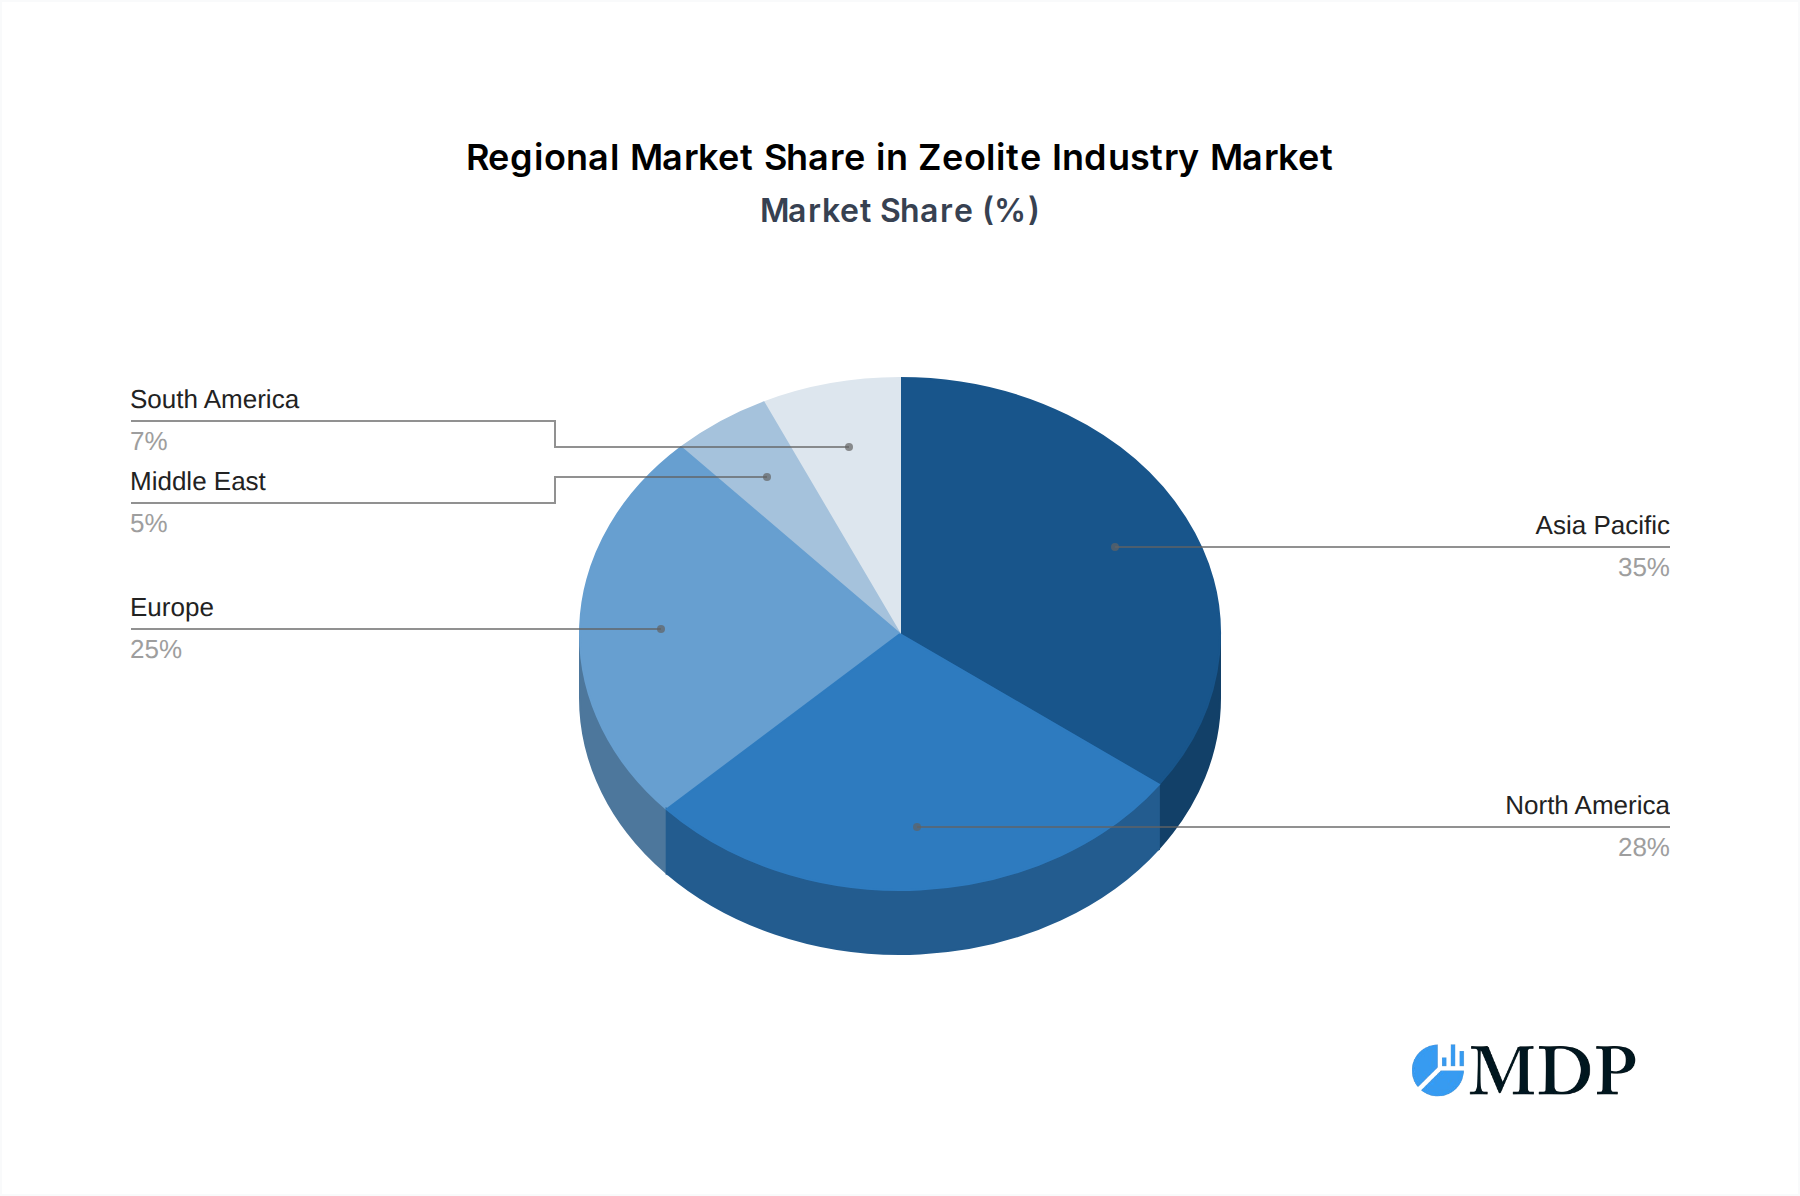
Zeolite Industry Regional Market Share
Geographic Coverage of Zeolite Industry
Zeolite Industry REPORT HIGHLIGHTS
| Aspects | Details |
|---|---|
| Study Period | 2020-2034 |
| Base Year | 2025 |
| Estimated Year | 2026 |
| Forecast Period | 2026-2034 |
| Historical Period | 2020-2025 |
| Growth Rate | CAGR of 9.3% from 2020-2034 |
| Segmentation |
|
Table of Contents
- 1. Introduction
- 1.1. Research Scope
- 1.2. Market Segmentation
- 1.3. Research Objective
- 1.4. Definitions and Assumptions
- 2. Executive Summary
- 2.1. Market Snapshot
- 3. Market Dynamics
- 3.1. Market Drivers
- 3.2. Market Restrains
- 3.3. Market Trends
- 3.4. Market Opportunities
- 4. Market Factor Analysis
- 4.1. Porters Five Forces
- 4.1.1. Bargaining Power of Suppliers
- 4.1.2. Bargaining Power of Buyers
- 4.1.3. Threat of New Entrants
- 4.1.4. Threat of Substitutes
- 4.1.5. Competitive Rivalry
- 4.2. PESTEL analysis
- 4.3. BCG Analysis
- 4.3.1. Stars (High Growth, High Market Share)
- 4.3.2. Cash Cows (Low Growth, High Market Share)
- 4.3.3. Question Mark (High Growth, Low Market Share)
- 4.3.4. Dogs (Low Growth, Low Market Share)
- 4.4. Ansoff Matrix Analysis
- 4.5. Supply Chain Analysis
- 4.6. Regulatory Landscape
- 4.7. Current Market Potential and Opportunity Assessment (TAM–SAM–SOM Framework)
- 4.8. MDP Analyst Note
- 4.1. Porters Five Forces
- 5. Market Analysis, Insights and Forecast 2021-2033
- 5.1. Market Analysis, Insights and Forecast - by Product Type
- 5.1.1. Natural
- 5.1.2. Synthetic
- 5.2. Market Analysis, Insights and Forecast - by Application
- 5.2.1. Adsorbents
- 5.2.2. Catalysts
- 5.2.3. Detergents
- 5.2.4. Other Applications (Refining, Biogas)
- 5.3. Market Analysis, Insights and Forecast - by End-user Industry
- 5.3.1. Water Treatment
- 5.3.2. Air Purification
- 5.3.3. Agriculture
- 5.3.4. Petrochemical
- 5.3.5. Construction
- 5.3.6. Other En
- 5.4. Market Analysis, Insights and Forecast - by Region
- 5.4.1. Asia Pacific
- 5.4.2. North America
- 5.4.3. Europe
- 5.4.4. South America
- 5.4.5. Middle East
- 5.4.6. Saudi Arabia
- 5.1. Market Analysis, Insights and Forecast - by Product Type
- 6. Global Zeolite Industry Analysis, Insights and Forecast, 2021-2033
- 6.1. Market Analysis, Insights and Forecast - by Product Type
- 6.1.1. Natural
- 6.1.2. Synthetic
- 6.2. Market Analysis, Insights and Forecast - by Application
- 6.2.1. Adsorbents
- 6.2.2. Catalysts
- 6.2.3. Detergents
- 6.2.4. Other Applications (Refining, Biogas)
- 6.3. Market Analysis, Insights and Forecast - by End-user Industry
- 6.3.1. Water Treatment
- 6.3.2. Air Purification
- 6.3.3. Agriculture
- 6.3.4. Petrochemical
- 6.3.5. Construction
- 6.3.6. Other En
- 6.1. Market Analysis, Insights and Forecast - by Product Type
- 7. Asia Pacific Zeolite Industry Analysis, Insights and Forecast, 2020-2032
- 7.1. Market Analysis, Insights and Forecast - by Product Type
- 7.1.1. Natural
- 7.1.2. Synthetic
- 7.2. Market Analysis, Insights and Forecast - by Application
- 7.2.1. Adsorbents
- 7.2.2. Catalysts
- 7.2.3. Detergents
- 7.2.4. Other Applications (Refining, Biogas)
- 7.3. Market Analysis, Insights and Forecast - by End-user Industry
- 7.3.1. Water Treatment
- 7.3.2. Air Purification
- 7.3.3. Agriculture
- 7.3.4. Petrochemical
- 7.3.5. Construction
- 7.3.6. Other En
- 7.1. Market Analysis, Insights and Forecast - by Product Type
- 8. North America Zeolite Industry Analysis, Insights and Forecast, 2020-2032
- 8.1. Market Analysis, Insights and Forecast - by Product Type
- 8.1.1. Natural
- 8.1.2. Synthetic
- 8.2. Market Analysis, Insights and Forecast - by Application
- 8.2.1. Adsorbents
- 8.2.2. Catalysts
- 8.2.3. Detergents
- 8.2.4. Other Applications (Refining, Biogas)
- 8.3. Market Analysis, Insights and Forecast - by End-user Industry
- 8.3.1. Water Treatment
- 8.3.2. Air Purification
- 8.3.3. Agriculture
- 8.3.4. Petrochemical
- 8.3.5. Construction
- 8.3.6. Other En
- 8.1. Market Analysis, Insights and Forecast - by Product Type
- 9. Europe Zeolite Industry Analysis, Insights and Forecast, 2020-2032
- 9.1. Market Analysis, Insights and Forecast - by Product Type
- 9.1.1. Natural
- 9.1.2. Synthetic
- 9.2. Market Analysis, Insights and Forecast - by Application
- 9.2.1. Adsorbents
- 9.2.2. Catalysts
- 9.2.3. Detergents
- 9.2.4. Other Applications (Refining, Biogas)
- 9.3. Market Analysis, Insights and Forecast - by End-user Industry
- 9.3.1. Water Treatment
- 9.3.2. Air Purification
- 9.3.3. Agriculture
- 9.3.4. Petrochemical
- 9.3.5. Construction
- 9.3.6. Other En
- 9.1. Market Analysis, Insights and Forecast - by Product Type
- 10. South America Zeolite Industry Analysis, Insights and Forecast, 2020-2032
- 10.1. Market Analysis, Insights and Forecast - by Product Type
- 10.1.1. Natural
- 10.1.2. Synthetic
- 10.2. Market Analysis, Insights and Forecast - by Application
- 10.2.1. Adsorbents
- 10.2.2. Catalysts
- 10.2.3. Detergents
- 10.2.4. Other Applications (Refining, Biogas)
- 10.3. Market Analysis, Insights and Forecast - by End-user Industry
- 10.3.1. Water Treatment
- 10.3.2. Air Purification
- 10.3.3. Agriculture
- 10.3.4. Petrochemical
- 10.3.5. Construction
- 10.3.6. Other En
- 10.1. Market Analysis, Insights and Forecast - by Product Type
- 11. Middle East Zeolite Industry Analysis, Insights and Forecast, 2020-2032
- 11.1. Market Analysis, Insights and Forecast - by Product Type
- 11.1.1. Natural
- 11.1.2. Synthetic
- 11.2. Market Analysis, Insights and Forecast - by Application
- 11.2.1. Adsorbents
- 11.2.2. Catalysts
- 11.2.3. Detergents
- 11.2.4. Other Applications (Refining, Biogas)
- 11.3. Market Analysis, Insights and Forecast - by End-user Industry
- 11.3.1. Water Treatment
- 11.3.2. Air Purification
- 11.3.3. Agriculture
- 11.3.4. Petrochemical
- 11.3.5. Construction
- 11.3.6. Other En
- 11.1. Market Analysis, Insights and Forecast - by Product Type
- 12. Saudi Arabia Zeolite Industry Analysis, Insights and Forecast, 2020-2032
- 12.1. Market Analysis, Insights and Forecast - by Product Type
- 12.1.1. Natural
- 12.1.2. Synthetic
- 12.2. Market Analysis, Insights and Forecast - by Application
- 12.2.1. Adsorbents
- 12.2.2. Catalysts
- 12.2.3. Detergents
- 12.2.4. Other Applications (Refining, Biogas)
- 12.3. Market Analysis, Insights and Forecast - by End-user Industry
- 12.3.1. Water Treatment
- 12.3.2. Air Purification
- 12.3.3. Agriculture
- 12.3.4. Petrochemical
- 12.3.5. Construction
- 12.3.6. Other En
- 12.1. Market Analysis, Insights and Forecast - by Product Type
- 13. Competitive Analysis
- 13.1. Company Profiles
- 13.1.1 Honeywell International Inc
- 13.1.1.1. Company Overview
- 13.1.1.2. Products
- 13.1.1.3. Company Financials
- 13.1.1.4. SWOT Analysis
- 13.1.2 Clariant
- 13.1.2.1. Company Overview
- 13.1.2.2. Products
- 13.1.2.3. Company Financials
- 13.1.2.4. SWOT Analysis
- 13.1.3 SHOWA DENKO KK
- 13.1.3.1. Company Overview
- 13.1.3.2. Products
- 13.1.3.3. Company Financials
- 13.1.3.4. SWOT Analysis
- 13.1.4 International Zeolite Corp
- 13.1.4.1. Company Overview
- 13.1.4.2. Products
- 13.1.4.3. Company Financials
- 13.1.4.4. SWOT Analysis
- 13.1.5 Zeomex
- 13.1.5.1. Company Overview
- 13.1.5.2. Products
- 13.1.5.3. Company Financials
- 13.1.5.4. SWOT Analysis
- 13.1.6 Interra Global
- 13.1.6.1. Company Overview
- 13.1.6.2. Products
- 13.1.6.3. Company Financials
- 13.1.6.4. SWOT Analysis
- 13.1.7 KNT Group
- 13.1.7.1. Company Overview
- 13.1.7.2. Products
- 13.1.7.3. Company Financials
- 13.1.7.4. SWOT Analysis
- 13.1.8 ZEOCEM AS
- 13.1.8.1. Company Overview
- 13.1.8.2. Products
- 13.1.8.3. Company Financials
- 13.1.8.4. SWOT Analysis
- 13.1.9 BASF SE
- 13.1.9.1. Company Overview
- 13.1.9.2. Products
- 13.1.9.3. Company Financials
- 13.1.9.4. SWOT Analysis
- 13.1.10 Arkema Group
- 13.1.10.1. Company Overview
- 13.1.10.2. Products
- 13.1.10.3. Company Financials
- 13.1.10.4. SWOT Analysis
- 13.1.11 Tosoh Corporation
- 13.1.11.1. Company Overview
- 13.1.11.2. Products
- 13.1.11.3. Company Financials
- 13.1.11.4. SWOT Analysis
- 13.1.12 W R Grace & Co
- 13.1.12.1. Company Overview
- 13.1.12.2. Products
- 13.1.12.3. Company Financials
- 13.1.12.4. SWOT Analysis
- 13.1.13 Zeolyst International Inc
- 13.1.13.1. Company Overview
- 13.1.13.2. Products
- 13.1.13.3. Company Financials
- 13.1.13.4. SWOT Analysis
- 13.1.1 Honeywell International Inc
- 13.2. Market Entropy
- 13.2.1 Company's Key Areas Served
- 13.2.2 Recent Developments
- 13.3. Company Market Share Analysis 2025
- 13.3.1 Top 5 Companies Market Share Analysis
- 13.3.2 Top 3 Companies Market Share Analysis
- 13.4. List of Potential Customers
- 14. Research Methodology
List of Figures
- Figure 1: Global Zeolite Industry Revenue Breakdown (million, %) by Region 2025 & 2033
- Figure 2: Global Zeolite Industry Volume Breakdown (K Tons, %) by Region 2025 & 2033
- Figure 3: Asia Pacific Zeolite Industry Revenue (million), by Product Type 2025 & 2033
- Figure 4: Asia Pacific Zeolite Industry Volume (K Tons), by Product Type 2025 & 2033
- Figure 5: Asia Pacific Zeolite Industry Revenue Share (%), by Product Type 2025 & 2033
- Figure 6: Asia Pacific Zeolite Industry Volume Share (%), by Product Type 2025 & 2033
- Figure 7: Asia Pacific Zeolite Industry Revenue (million), by Application 2025 & 2033
- Figure 8: Asia Pacific Zeolite Industry Volume (K Tons), by Application 2025 & 2033
- Figure 9: Asia Pacific Zeolite Industry Revenue Share (%), by Application 2025 & 2033
- Figure 10: Asia Pacific Zeolite Industry Volume Share (%), by Application 2025 & 2033
- Figure 11: Asia Pacific Zeolite Industry Revenue (million), by End-user Industry 2025 & 2033
- Figure 12: Asia Pacific Zeolite Industry Volume (K Tons), by End-user Industry 2025 & 2033
- Figure 13: Asia Pacific Zeolite Industry Revenue Share (%), by End-user Industry 2025 & 2033
- Figure 14: Asia Pacific Zeolite Industry Volume Share (%), by End-user Industry 2025 & 2033
- Figure 15: Asia Pacific Zeolite Industry Revenue (million), by Country 2025 & 2033
- Figure 16: Asia Pacific Zeolite Industry Volume (K Tons), by Country 2025 & 2033
- Figure 17: Asia Pacific Zeolite Industry Revenue Share (%), by Country 2025 & 2033
- Figure 18: Asia Pacific Zeolite Industry Volume Share (%), by Country 2025 & 2033
- Figure 19: North America Zeolite Industry Revenue (million), by Product Type 2025 & 2033
- Figure 20: North America Zeolite Industry Volume (K Tons), by Product Type 2025 & 2033
- Figure 21: North America Zeolite Industry Revenue Share (%), by Product Type 2025 & 2033
- Figure 22: North America Zeolite Industry Volume Share (%), by Product Type 2025 & 2033
- Figure 23: North America Zeolite Industry Revenue (million), by Application 2025 & 2033
- Figure 24: North America Zeolite Industry Volume (K Tons), by Application 2025 & 2033
- Figure 25: North America Zeolite Industry Revenue Share (%), by Application 2025 & 2033
- Figure 26: North America Zeolite Industry Volume Share (%), by Application 2025 & 2033
- Figure 27: North America Zeolite Industry Revenue (million), by End-user Industry 2025 & 2033
- Figure 28: North America Zeolite Industry Volume (K Tons), by End-user Industry 2025 & 2033
- Figure 29: North America Zeolite Industry Revenue Share (%), by End-user Industry 2025 & 2033
- Figure 30: North America Zeolite Industry Volume Share (%), by End-user Industry 2025 & 2033
- Figure 31: North America Zeolite Industry Revenue (million), by Country 2025 & 2033
- Figure 32: North America Zeolite Industry Volume (K Tons), by Country 2025 & 2033
- Figure 33: North America Zeolite Industry Revenue Share (%), by Country 2025 & 2033
- Figure 34: North America Zeolite Industry Volume Share (%), by Country 2025 & 2033
- Figure 35: Europe Zeolite Industry Revenue (million), by Product Type 2025 & 2033
- Figure 36: Europe Zeolite Industry Volume (K Tons), by Product Type 2025 & 2033
- Figure 37: Europe Zeolite Industry Revenue Share (%), by Product Type 2025 & 2033
- Figure 38: Europe Zeolite Industry Volume Share (%), by Product Type 2025 & 2033
- Figure 39: Europe Zeolite Industry Revenue (million), by Application 2025 & 2033
- Figure 40: Europe Zeolite Industry Volume (K Tons), by Application 2025 & 2033
- Figure 41: Europe Zeolite Industry Revenue Share (%), by Application 2025 & 2033
- Figure 42: Europe Zeolite Industry Volume Share (%), by Application 2025 & 2033
- Figure 43: Europe Zeolite Industry Revenue (million), by End-user Industry 2025 & 2033
- Figure 44: Europe Zeolite Industry Volume (K Tons), by End-user Industry 2025 & 2033
- Figure 45: Europe Zeolite Industry Revenue Share (%), by End-user Industry 2025 & 2033
- Figure 46: Europe Zeolite Industry Volume Share (%), by End-user Industry 2025 & 2033
- Figure 47: Europe Zeolite Industry Revenue (million), by Country 2025 & 2033
- Figure 48: Europe Zeolite Industry Volume (K Tons), by Country 2025 & 2033
- Figure 49: Europe Zeolite Industry Revenue Share (%), by Country 2025 & 2033
- Figure 50: Europe Zeolite Industry Volume Share (%), by Country 2025 & 2033
- Figure 51: South America Zeolite Industry Revenue (million), by Product Type 2025 & 2033
- Figure 52: South America Zeolite Industry Volume (K Tons), by Product Type 2025 & 2033
- Figure 53: South America Zeolite Industry Revenue Share (%), by Product Type 2025 & 2033
- Figure 54: South America Zeolite Industry Volume Share (%), by Product Type 2025 & 2033
- Figure 55: South America Zeolite Industry Revenue (million), by Application 2025 & 2033
- Figure 56: South America Zeolite Industry Volume (K Tons), by Application 2025 & 2033
- Figure 57: South America Zeolite Industry Revenue Share (%), by Application 2025 & 2033
- Figure 58: South America Zeolite Industry Volume Share (%), by Application 2025 & 2033
- Figure 59: South America Zeolite Industry Revenue (million), by End-user Industry 2025 & 2033
- Figure 60: South America Zeolite Industry Volume (K Tons), by End-user Industry 2025 & 2033
- Figure 61: South America Zeolite Industry Revenue Share (%), by End-user Industry 2025 & 2033
- Figure 62: South America Zeolite Industry Volume Share (%), by End-user Industry 2025 & 2033
- Figure 63: South America Zeolite Industry Revenue (million), by Country 2025 & 2033
- Figure 64: South America Zeolite Industry Volume (K Tons), by Country 2025 & 2033
- Figure 65: South America Zeolite Industry Revenue Share (%), by Country 2025 & 2033
- Figure 66: South America Zeolite Industry Volume Share (%), by Country 2025 & 2033
- Figure 67: Middle East Zeolite Industry Revenue (million), by Product Type 2025 & 2033
- Figure 68: Middle East Zeolite Industry Volume (K Tons), by Product Type 2025 & 2033
- Figure 69: Middle East Zeolite Industry Revenue Share (%), by Product Type 2025 & 2033
- Figure 70: Middle East Zeolite Industry Volume Share (%), by Product Type 2025 & 2033
- Figure 71: Middle East Zeolite Industry Revenue (million), by Application 2025 & 2033
- Figure 72: Middle East Zeolite Industry Volume (K Tons), by Application 2025 & 2033
- Figure 73: Middle East Zeolite Industry Revenue Share (%), by Application 2025 & 2033
- Figure 74: Middle East Zeolite Industry Volume Share (%), by Application 2025 & 2033
- Figure 75: Middle East Zeolite Industry Revenue (million), by End-user Industry 2025 & 2033
- Figure 76: Middle East Zeolite Industry Volume (K Tons), by End-user Industry 2025 & 2033
- Figure 77: Middle East Zeolite Industry Revenue Share (%), by End-user Industry 2025 & 2033
- Figure 78: Middle East Zeolite Industry Volume Share (%), by End-user Industry 2025 & 2033
- Figure 79: Middle East Zeolite Industry Revenue (million), by Country 2025 & 2033
- Figure 80: Middle East Zeolite Industry Volume (K Tons), by Country 2025 & 2033
- Figure 81: Middle East Zeolite Industry Revenue Share (%), by Country 2025 & 2033
- Figure 82: Middle East Zeolite Industry Volume Share (%), by Country 2025 & 2033
- Figure 83: Saudi Arabia Zeolite Industry Revenue (million), by Product Type 2025 & 2033
- Figure 84: Saudi Arabia Zeolite Industry Volume (K Tons), by Product Type 2025 & 2033
- Figure 85: Saudi Arabia Zeolite Industry Revenue Share (%), by Product Type 2025 & 2033
- Figure 86: Saudi Arabia Zeolite Industry Volume Share (%), by Product Type 2025 & 2033
- Figure 87: Saudi Arabia Zeolite Industry Revenue (million), by Application 2025 & 2033
- Figure 88: Saudi Arabia Zeolite Industry Volume (K Tons), by Application 2025 & 2033
- Figure 89: Saudi Arabia Zeolite Industry Revenue Share (%), by Application 2025 & 2033
- Figure 90: Saudi Arabia Zeolite Industry Volume Share (%), by Application 2025 & 2033
- Figure 91: Saudi Arabia Zeolite Industry Revenue (million), by End-user Industry 2025 & 2033
- Figure 92: Saudi Arabia Zeolite Industry Volume (K Tons), by End-user Industry 2025 & 2033
- Figure 93: Saudi Arabia Zeolite Industry Revenue Share (%), by End-user Industry 2025 & 2033
- Figure 94: Saudi Arabia Zeolite Industry Volume Share (%), by End-user Industry 2025 & 2033
- Figure 95: Saudi Arabia Zeolite Industry Revenue (million), by Country 2025 & 2033
- Figure 96: Saudi Arabia Zeolite Industry Volume (K Tons), by Country 2025 & 2033
- Figure 97: Saudi Arabia Zeolite Industry Revenue Share (%), by Country 2025 & 2033
- Figure 98: Saudi Arabia Zeolite Industry Volume Share (%), by Country 2025 & 2033
List of Tables
- Table 1: Global Zeolite Industry Revenue million Forecast, by Product Type 2020 & 2033
- Table 2: Global Zeolite Industry Volume K Tons Forecast, by Product Type 2020 & 2033
- Table 3: Global Zeolite Industry Revenue million Forecast, by Application 2020 & 2033
- Table 4: Global Zeolite Industry Volume K Tons Forecast, by Application 2020 & 2033
- Table 5: Global Zeolite Industry Revenue million Forecast, by End-user Industry 2020 & 2033
- Table 6: Global Zeolite Industry Volume K Tons Forecast, by End-user Industry 2020 & 2033
- Table 7: Global Zeolite Industry Revenue million Forecast, by Region 2020 & 2033
- Table 8: Global Zeolite Industry Volume K Tons Forecast, by Region 2020 & 2033
- Table 9: Global Zeolite Industry Revenue million Forecast, by Product Type 2020 & 2033
- Table 10: Global Zeolite Industry Volume K Tons Forecast, by Product Type 2020 & 2033
- Table 11: Global Zeolite Industry Revenue million Forecast, by Application 2020 & 2033
- Table 12: Global Zeolite Industry Volume K Tons Forecast, by Application 2020 & 2033
- Table 13: Global Zeolite Industry Revenue million Forecast, by End-user Industry 2020 & 2033
- Table 14: Global Zeolite Industry Volume K Tons Forecast, by End-user Industry 2020 & 2033
- Table 15: Global Zeolite Industry Revenue million Forecast, by Country 2020 & 2033
- Table 16: Global Zeolite Industry Volume K Tons Forecast, by Country 2020 & 2033
- Table 17: China Zeolite Industry Revenue (million) Forecast, by Application 2020 & 2033
- Table 18: China Zeolite Industry Volume (K Tons) Forecast, by Application 2020 & 2033
- Table 19: India Zeolite Industry Revenue (million) Forecast, by Application 2020 & 2033
- Table 20: India Zeolite Industry Volume (K Tons) Forecast, by Application 2020 & 2033
- Table 21: Japan Zeolite Industry Revenue (million) Forecast, by Application 2020 & 2033
- Table 22: Japan Zeolite Industry Volume (K Tons) Forecast, by Application 2020 & 2033
- Table 23: South Korea Zeolite Industry Revenue (million) Forecast, by Application 2020 & 2033
- Table 24: South Korea Zeolite Industry Volume (K Tons) Forecast, by Application 2020 & 2033
- Table 25: Rest of Asia Pacific Zeolite Industry Revenue (million) Forecast, by Application 2020 & 2033
- Table 26: Rest of Asia Pacific Zeolite Industry Volume (K Tons) Forecast, by Application 2020 & 2033
- Table 27: Global Zeolite Industry Revenue million Forecast, by Product Type 2020 & 2033
- Table 28: Global Zeolite Industry Volume K Tons Forecast, by Product Type 2020 & 2033
- Table 29: Global Zeolite Industry Revenue million Forecast, by Application 2020 & 2033
- Table 30: Global Zeolite Industry Volume K Tons Forecast, by Application 2020 & 2033
- Table 31: Global Zeolite Industry Revenue million Forecast, by End-user Industry 2020 & 2033
- Table 32: Global Zeolite Industry Volume K Tons Forecast, by End-user Industry 2020 & 2033
- Table 33: Global Zeolite Industry Revenue million Forecast, by Country 2020 & 2033
- Table 34: Global Zeolite Industry Volume K Tons Forecast, by Country 2020 & 2033
- Table 35: United States Zeolite Industry Revenue (million) Forecast, by Application 2020 & 2033
- Table 36: United States Zeolite Industry Volume (K Tons) Forecast, by Application 2020 & 2033
- Table 37: Canada Zeolite Industry Revenue (million) Forecast, by Application 2020 & 2033
- Table 38: Canada Zeolite Industry Volume (K Tons) Forecast, by Application 2020 & 2033
- Table 39: Mexico Zeolite Industry Revenue (million) Forecast, by Application 2020 & 2033
- Table 40: Mexico Zeolite Industry Volume (K Tons) Forecast, by Application 2020 & 2033
- Table 41: Global Zeolite Industry Revenue million Forecast, by Product Type 2020 & 2033
- Table 42: Global Zeolite Industry Volume K Tons Forecast, by Product Type 2020 & 2033
- Table 43: Global Zeolite Industry Revenue million Forecast, by Application 2020 & 2033
- Table 44: Global Zeolite Industry Volume K Tons Forecast, by Application 2020 & 2033
- Table 45: Global Zeolite Industry Revenue million Forecast, by End-user Industry 2020 & 2033
- Table 46: Global Zeolite Industry Volume K Tons Forecast, by End-user Industry 2020 & 2033
- Table 47: Global Zeolite Industry Revenue million Forecast, by Country 2020 & 2033
- Table 48: Global Zeolite Industry Volume K Tons Forecast, by Country 2020 & 2033
- Table 49: Germany Zeolite Industry Revenue (million) Forecast, by Application 2020 & 2033
- Table 50: Germany Zeolite Industry Volume (K Tons) Forecast, by Application 2020 & 2033
- Table 51: United Kingdom Zeolite Industry Revenue (million) Forecast, by Application 2020 & 2033
- Table 52: United Kingdom Zeolite Industry Volume (K Tons) Forecast, by Application 2020 & 2033
- Table 53: Italy Zeolite Industry Revenue (million) Forecast, by Application 2020 & 2033
- Table 54: Italy Zeolite Industry Volume (K Tons) Forecast, by Application 2020 & 2033
- Table 55: France Zeolite Industry Revenue (million) Forecast, by Application 2020 & 2033
- Table 56: France Zeolite Industry Volume (K Tons) Forecast, by Application 2020 & 2033
- Table 57: Rest of Europe Zeolite Industry Revenue (million) Forecast, by Application 2020 & 2033
- Table 58: Rest of Europe Zeolite Industry Volume (K Tons) Forecast, by Application 2020 & 2033
- Table 59: Global Zeolite Industry Revenue million Forecast, by Product Type 2020 & 2033
- Table 60: Global Zeolite Industry Volume K Tons Forecast, by Product Type 2020 & 2033
- Table 61: Global Zeolite Industry Revenue million Forecast, by Application 2020 & 2033
- Table 62: Global Zeolite Industry Volume K Tons Forecast, by Application 2020 & 2033
- Table 63: Global Zeolite Industry Revenue million Forecast, by End-user Industry 2020 & 2033
- Table 64: Global Zeolite Industry Volume K Tons Forecast, by End-user Industry 2020 & 2033
- Table 65: Global Zeolite Industry Revenue million Forecast, by Country 2020 & 2033
- Table 66: Global Zeolite Industry Volume K Tons Forecast, by Country 2020 & 2033
- Table 67: Brazil Zeolite Industry Revenue (million) Forecast, by Application 2020 & 2033
- Table 68: Brazil Zeolite Industry Volume (K Tons) Forecast, by Application 2020 & 2033
- Table 69: Argentina Zeolite Industry Revenue (million) Forecast, by Application 2020 & 2033
- Table 70: Argentina Zeolite Industry Volume (K Tons) Forecast, by Application 2020 & 2033
- Table 71: Rest of South America Zeolite Industry Revenue (million) Forecast, by Application 2020 & 2033
- Table 72: Rest of South America Zeolite Industry Volume (K Tons) Forecast, by Application 2020 & 2033
- Table 73: Global Zeolite Industry Revenue million Forecast, by Product Type 2020 & 2033
- Table 74: Global Zeolite Industry Volume K Tons Forecast, by Product Type 2020 & 2033
- Table 75: Global Zeolite Industry Revenue million Forecast, by Application 2020 & 2033
- Table 76: Global Zeolite Industry Volume K Tons Forecast, by Application 2020 & 2033
- Table 77: Global Zeolite Industry Revenue million Forecast, by End-user Industry 2020 & 2033
- Table 78: Global Zeolite Industry Volume K Tons Forecast, by End-user Industry 2020 & 2033
- Table 79: Global Zeolite Industry Revenue million Forecast, by Country 2020 & 2033
- Table 80: Global Zeolite Industry Volume K Tons Forecast, by Country 2020 & 2033
- Table 81: Global Zeolite Industry Revenue million Forecast, by Product Type 2020 & 2033
- Table 82: Global Zeolite Industry Volume K Tons Forecast, by Product Type 2020 & 2033
- Table 83: Global Zeolite Industry Revenue million Forecast, by Application 2020 & 2033
- Table 84: Global Zeolite Industry Volume K Tons Forecast, by Application 2020 & 2033
- Table 85: Global Zeolite Industry Revenue million Forecast, by End-user Industry 2020 & 2033
- Table 86: Global Zeolite Industry Volume K Tons Forecast, by End-user Industry 2020 & 2033
- Table 87: Global Zeolite Industry Revenue million Forecast, by Country 2020 & 2033
- Table 88: Global Zeolite Industry Volume K Tons Forecast, by Country 2020 & 2033
- Table 89: South Africa Zeolite Industry Revenue (million) Forecast, by Application 2020 & 2033
- Table 90: South Africa Zeolite Industry Volume (K Tons) Forecast, by Application 2020 & 2033
- Table 91: Rest of Middle East Zeolite Industry Revenue (million) Forecast, by Application 2020 & 2033
- Table 92: Rest of Middle East Zeolite Industry Volume (K Tons) Forecast, by Application 2020 & 2033
Frequently Asked Questions
1. What is the projected Compound Annual Growth Rate (CAGR) of the Zeolite Industry?
The projected CAGR is approximately 9.3%.
2. Which companies are prominent players in the Zeolite Industry?
Key companies in the market include Honeywell International Inc, Clariant, SHOWA DENKO KK, International Zeolite Corp, Zeomex, Interra Global, KNT Group, ZEOCEM AS, BASF SE, Arkema Group, Tosoh Corporation, W R Grace & Co, Zeolyst International Inc.
3. What are the main segments of the Zeolite Industry?
The market segments include Product Type, Application, End-user Industry.
4. Can you provide details about the market size?
The market size is estimated to be USD 34471.87 million as of 2022.
5. What are some drivers contributing to market growth?
Increasing Demand from Water Treatment Industry; Increasing Use of Zeolite as Refrigeration Adsorbents; Significant Usage of Zeolites for Catalytic Cracking in the Petroleum Industry.
6. What are the notable trends driving market growth?
Agriculture Industry to Dominate the Market.
7. Are there any restraints impacting market growth?
Usage of Substitutes for Zeolites.
8. Can you provide examples of recent developments in the market?
December 2022: International Zeolite Corp. is pleased to announce an agreement between Niagara College's Horticultural & Environmental Sciences Innovation Centre (HESIC). Under the terms of the agreement, Niagara College will provide priority and support for research projects in relationship to IZ's proprietary grow system NEREA, which HESIC will carry out.
9. What pricing options are available for accessing the report?
Pricing options include single-user, multi-user, and enterprise licenses priced at USD 4750, USD 5250, and USD 8750 respectively.
10. Is the market size provided in terms of value or volume?
The market size is provided in terms of value, measured in million and volume, measured in K Tons.
11. Are there any specific market keywords associated with the report?
Yes, the market keyword associated with the report is "Zeolite Industry," which aids in identifying and referencing the specific market segment covered.
12. How do I determine which pricing option suits my needs best?
The pricing options vary based on user requirements and access needs. Individual users may opt for single-user licenses, while businesses requiring broader access may choose multi-user or enterprise licenses for cost-effective access to the report.
13. Are there any additional resources or data provided in the Zeolite Industry report?
While the report offers comprehensive insights, it's advisable to review the specific contents or supplementary materials provided to ascertain if additional resources or data are available.
14. How can I stay updated on further developments or reports in the Zeolite Industry?
To stay informed about further developments, trends, and reports in the Zeolite Industry, consider subscribing to industry newsletters, following relevant companies and organizations, or regularly checking reputable industry news sources and publications.
Methodology
Step 1 - Identification of Relevant Samples Size from Population Database


Step 2 - Approaches for Defining Global Market Size (Value, Volume* & Price*)

Note*: In applicable scenarios
Step 3 - Data Sources
Primary Research
- Web Analytics
- Survey Reports
- Research Institute
- Latest Research Reports
- Opinion Leaders
Secondary Research
- Annual Reports
- White Paper
- Latest Press Release
- Industry Association
- Paid Database
- Investor Presentations

Step 4 - Data Triangulation
Involves using different sources of information in order to increase the validity of a study
These sources are likely to be stakeholders in a program - participants, other researchers, program staff, other community members, and so on.
Then we put all data in single framework & apply various statistical tools to find out the dynamic on the market.
During the analysis stage, feedback from the stakeholder groups would be compared to determine areas of agreement as well as areas of divergence