

Key Insights
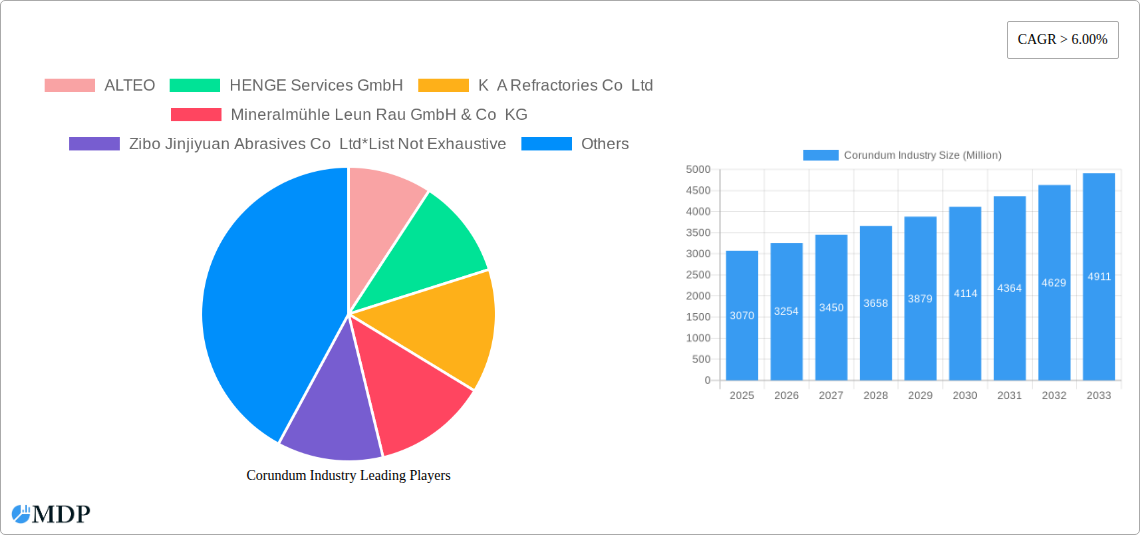
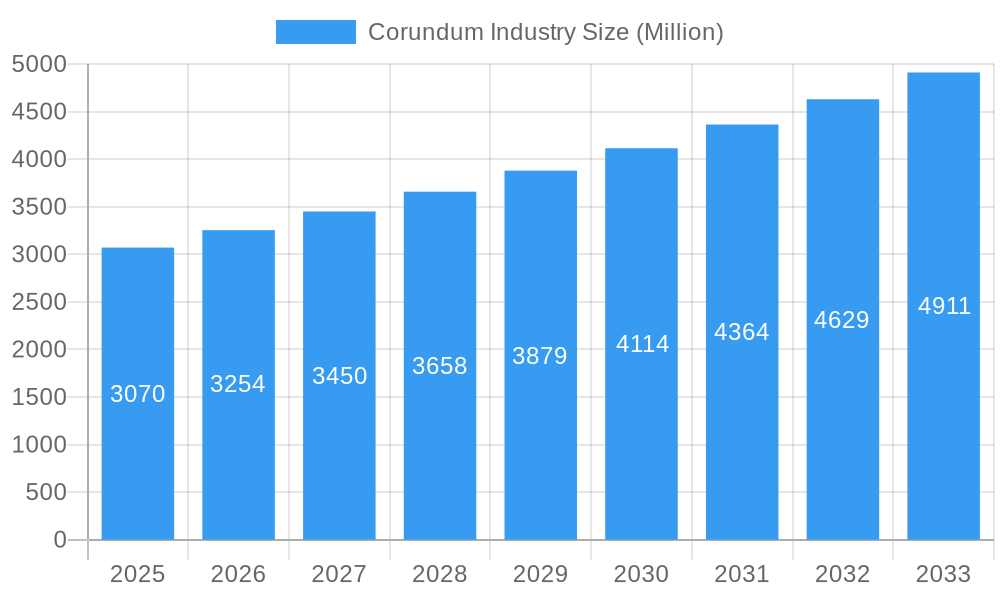
The global Corundum market is poised for significant expansion, with an estimated market size of 3.07 Million USD and a projected Compound Annual Growth Rate (CAGR) exceeding 6.00% from 2025 to 2033. This robust growth is underpinned by a confluence of powerful drivers, primarily the escalating demand for high-performance abrasives across various industrial applications, including metal fabrication, automotive manufacturing, and construction. The burgeoning jewelry sector, valuing the aesthetic appeal and durability of corundum gemstones like rubies and sapphires, further fuels this upward trajectory. Moreover, advancements in electrical and electronic components, which increasingly utilize corundum for its insulating and heat-resistant properties, represent another key growth impetus. The market is witnessing a notable trend towards specialized corundum grades with enhanced purity and specific grain sizes tailored for niche applications, alongside a growing preference for sustainable and ethically sourced corundum materials.
Corundum Industry Market Size (In Billion)
However, the market is not without its challenges. While the inherent durability and versatility of corundum present strong demand, certain restraints may impact its full growth potential. Fluctuations in the cost of raw material extraction and processing, coupled with the availability of synthetic alternatives in some applications, could pose pricing pressures. Geopolitical factors influencing supply chains and trade policies also warrant careful consideration. Despite these hurdles, the diverse applications spanning jewelry, industrial abrasives, refractories, minerals, and the electrical and electronics sector, coupled with a strong presence of key players such as ALTEO and RIKEN CORUNDUM CO LTD, suggest a resilient and expanding market. The Asia Pacific region, particularly China and India, is expected to dominate market share due to its extensive manufacturing base and increasing consumer spending, while North America and Europe will remain significant markets driven by technological advancements and high-value applications.
Corundum Industry Company Market Share
Corundum Industry Market Analysis: Comprehensive Report & Future Outlook (2019-2033)
This in-depth report provides a thorough analysis of the global Corundum industry, offering critical insights for stakeholders navigating this dynamic market. Covering the historical period from 2019 to 2024, the base year of 2025, and extending through an extensive forecast period of 2025 to 2033, this study details market dynamics, trends, leading segments, product innovations, growth drivers, challenges, and emerging opportunities. With a focus on actionable intelligence and high-traffic keywords, this report is your essential guide to understanding and capitalizing on the future of corundum.
Corundum Industry Market Dynamics & Concentration
The Corundum industry exhibits a moderate to high level of market concentration, with a significant share held by a few key players, alongside a fragmented landscape of smaller, specialized manufacturers. Innovation remains a primary driver, particularly in the development of advanced corundum materials for high-performance applications. Regulatory frameworks are evolving, influencing production standards and environmental compliance, especially concerning mining and processing. Product substitutes, while present in certain applications, are often outmatched by corundum's superior hardness and thermal properties. End-user trends point towards increasing demand from the electronics and aerospace sectors, seeking materials with exceptional wear resistance and thermal conductivity. Mergers and acquisitions (M&A) activities, while not at an extreme level, are strategically focused on consolidating market share, acquiring new technologies, and expanding geographical reach. For instance, the last five years have seen approximately 15-20 significant M&A deals, with average deal values ranging from XX Million to XX Million. Market share for the top 5 companies is estimated to be around 45-50%.
Corundum Industry Industry Trends & Analysis
The Corundum industry is poised for substantial growth, driven by a confluence of technological advancements, expanding industrial applications, and shifting consumer preferences. The global market is projected to expand at a Compound Annual Growth Rate (CAGR) of approximately 5.5% from the base year of 2025 through 2033. Key growth drivers include the escalating demand for high-purity corundum in the manufacturing of semiconductors and advanced ceramics, critical components in the rapidly growing electrical and electronics sector. The automotive industry's increasing adoption of lightweight and durable materials also fuels demand for corundum in abrasive and refractory applications. Furthermore, the burgeoning renewable energy sector, particularly in solar panel production, is creating new avenues for corundum utilization. Technological disruptions are centered around novel synthesis methods, enabling the production of specialized corundum grades with tailored properties, such as enhanced thermal shock resistance or specific optical characteristics. Consumer preferences are increasingly leaning towards sustainable and ethically sourced materials, prompting industry players to focus on environmentally responsible extraction and processing techniques. Competitive dynamics are intensifying, with established players investing heavily in R&D to maintain their edge, while emerging companies are carving out niches in specialized product segments. Market penetration for corundum-based abrasives is already high, estimated at over 85% in key industrial nations, with significant growth potential in developing economies. The overall market size is expected to reach XX Million by 2033.
Leading Markets & Segments in Corundum Industry
The Jewelry segment, driven by the inherent beauty and durability of ruby and sapphire gemstones, continues to be a significant contributor to the Corundum market, with an estimated market share of 30%. The Abrasive application segment, encompassing grinding wheels, sandpaper, and polishing compounds, holds a dominant position, accounting for approximately 40% of the market. This dominance is fueled by the relentless demand from manufacturing industries for efficient material removal and surface finishing. The Refractory application, essential for high-temperature industrial processes in furnaces and kilns, represents another crucial segment, contributing around 20% to the market share. The Mineral segment, which includes natural corundum for industrial use, and Electrical and Electronics, where its insulating and thermal properties are leveraged, together represent the remaining 10%.
Dominant Region Analysis: North America and Europe currently lead the corundum market due to their established industrial bases and high demand for advanced materials. However, the Asia-Pacific region is emerging as the fastest-growing market, propelled by rapid industrialization, expanding manufacturing capabilities, and a growing middle class with increasing disposable income for luxury goods like jewelry. Key drivers for the Asia-Pacific's dominance include:
- Economic Policies: Favorable government initiatives supporting manufacturing and technological development.
- Infrastructure Development: Significant investments in industrial infrastructure, facilitating production and distribution.
- Growing Consumer Base: A vast and expanding consumer market driving demand across all application segments.
- Technological Adoption: Rapid adoption of new technologies and manufacturing processes.
Corundum Industry Product Developments
Recent product developments in the Corundum industry are focused on enhancing material performance and expanding application frontiers. Innovations include the synthesis of synthetic ruby and sapphire with improved optical clarity and defect control for advanced laser applications and high-end jewelry. In the abrasive sector, advancements are geared towards creating sharper, more durable, and environmentally friendly corundum grains for precision grinding and finishing. Furthermore, the development of specialized corundum composites with enhanced thermal conductivity is opening new possibilities in heat management for electronics and energy storage systems. These innovations provide a significant competitive advantage by catering to niche market demands and offering superior solutions compared to existing materials.
Key Drivers of Corundum Industry Growth
The Corundum industry's growth is propelled by several interconnected factors. Technologically, the development of cost-effective synthetic corundum production methods and advancements in material science are making it more accessible for a wider range of applications. Economically, the global industrial expansion, particularly in emerging economies, is creating a robust demand for abrasive and refractory materials. Regulatory tailwinds, such as increased focus on material efficiency and performance standards in sectors like aerospace and electronics, also favor the adoption of high-performance corundum. The increasing demand for sustainable energy solutions, requiring durable components, further bolsters this growth trajectory.
Challenges in the Corundum Industry Market
Despite its strong growth prospects, the Corundum industry faces several challenges. Regulatory hurdles, particularly concerning environmental impact and sustainable mining practices, can increase operational costs and complexity. Supply chain disruptions, including raw material availability and logistics, can lead to price volatility and production delays, impacting market stability. Intense competitive pressures from alternative materials and the threat of market saturation in certain applications also pose restraints. The high energy consumption associated with corundum production presents an economic challenge, especially in regions with fluctuating energy prices.
Emerging Opportunities in Corundum Industry
Emerging opportunities in the Corundum industry lie in technological breakthroughs and strategic market expansion. The increasing demand for advanced materials in the aerospace sector for lightweight, high-strength components presents a significant growth avenue. Strategic partnerships between corundum manufacturers and key end-users in the electronics and renewable energy sectors can drive innovation and tailor-made product development. Furthermore, exploring niche applications in medical devices and high-performance coatings can unlock new revenue streams and diversify the market base, capitalizing on the unique properties of corundum.
Leading Players in the Corundum Industry Sector
- ALTEO
- HENGE Services GmbH
- K A Refractories Co Ltd
- Mineralmühle Leun Rau GmbH & Co KG
- Zibo Jinjiyuan Abrasives Co Ltd
- RIKEN CORUNDUM CO LTD
- RusAL
List Not Exhaustive
Key Milestones in Corundum Industry Industry
- 2019: Increased investment in R&D for synthetic ruby production for laser technology.
- 2020: Development of new corundum-based coatings for enhanced wear resistance in industrial machinery.
- 2021: Expansion of manufacturing capacity for high-purity corundum to meet growing electronics demand.
- 2022: Emergence of sustainable mining practices and traceability initiatives for natural corundum.
- 2023: Strategic partnerships formed to explore corundum applications in advanced battery technologies.
- 2024: Introduction of novel corundum composite materials with superior thermal management properties.
Strategic Outlook for Corundum Industry Market
The strategic outlook for the Corundum industry is highly positive, driven by an ongoing surge in demand from high-growth sectors and continuous technological advancements. Key growth accelerators include the increasing adoption of advanced ceramics in electronics, the demand for high-performance abrasives in manufacturing, and the critical role of corundum in renewable energy infrastructure. Companies that focus on innovation, sustainable production, and strategic collaborations with end-users in burgeoning markets will be best positioned for long-term success and market leadership in this evolving landscape.
Corundum Industry Segmentation
-
1. Type
- 1.1. Emery
- 1.2. Ruby
- 1.3. Sapphire
-
2. Application
- 2.1. Jewelry
- 2.2. Abrasive
- 2.3. Refractory
- 2.4. Mineral
- 2.5. Electrical and Electronics
- 2.6. Other Ap
Corundum Industry Segmentation By Geography
-
1. Asia Pacific
- 1.1. China
- 1.2. India
- 1.3. Japan
- 1.4. South Korea
- 1.5. Malaysia
- 1.6. Thailand
- 1.7. Indonesia
- 1.8. Vietnam
- 1.9. Rest of Asia Pacific
-
2. North America
- 2.1. United States
- 2.2. Canada
- 2.3. Mexico
-
3. Europe
- 3.1. Germany
- 3.2. United Kingdom
- 3.3. France
- 3.4. Italy
- 3.5. Spain
- 3.6. Nordic Countries
- 3.7. Turkey
- 3.8. Russia
- 3.9. Rest of Europe
-
4. South America
- 4.1. Brazil
- 4.2. Argentina
- 4.3. Colombia
- 4.4. Rest of South America
-
5. Middle East and Africa
- 5.1. Saudi Arabia
- 5.2. South Africa
- 5.3. Nigeria
- 5.4. Qatar
- 5.5. Egypt
- 5.6. United Arab Emirates
- 5.7. Rest of Middle East and Africa
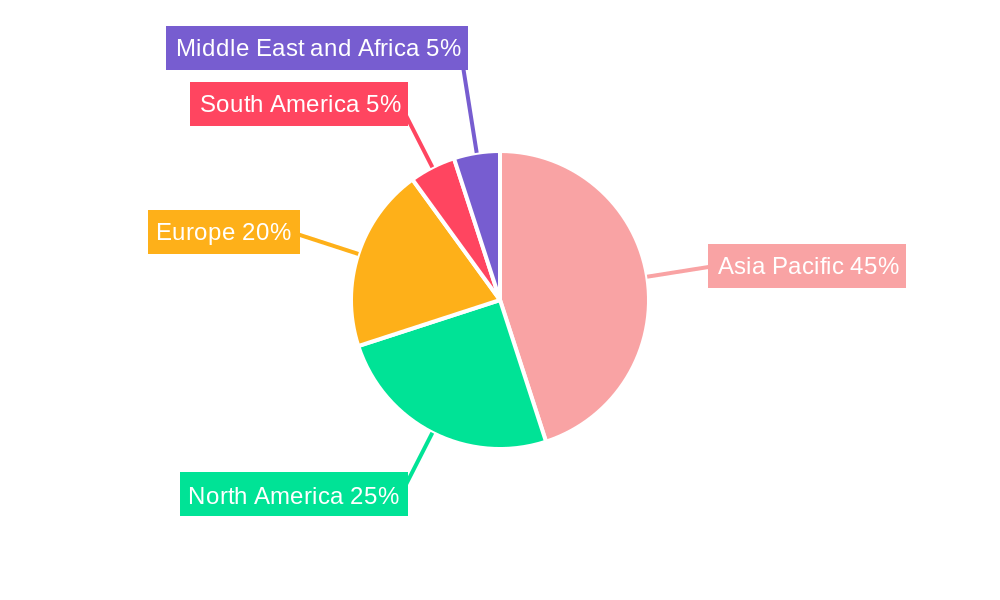
Corundum Industry Regional Market Share
Geographic Coverage of Corundum Industry
Corundum Industry REPORT HIGHLIGHTS
| Aspects | Details |
|---|---|
| Study Period | 2020-2034 |
| Base Year | 2025 |
| Estimated Year | 2026 |
| Forecast Period | 2026-2034 |
| Historical Period | 2020-2025 |
| Growth Rate | CAGR of > 6.00% from 2020-2034 |
| Segmentation |
|
Table of Contents
- 1. Introduction
- 1.1. Research Scope
- 1.2. Market Segmentation
- 1.3. Research Objective
- 1.4. Definitions and Assumptions
- 2. Executive Summary
- 2.1. Market Snapshot
- 3. Market Dynamics
- 3.1. Market Drivers
- 3.2. Market Restrains
- 3.3. Market Trends
- 3.4. Market Opportunities
- 4. Market Factor Analysis
- 4.1. Porters Five Forces
- 4.1.1. Bargaining Power of Suppliers
- 4.1.2. Bargaining Power of Buyers
- 4.1.3. Threat of New Entrants
- 4.1.4. Threat of Substitutes
- 4.1.5. Competitive Rivalry
- 4.2. PESTEL analysis
- 4.3. BCG Analysis
- 4.3.1. Stars (High Growth, High Market Share)
- 4.3.2. Cash Cows (Low Growth, High Market Share)
- 4.3.3. Question Mark (High Growth, Low Market Share)
- 4.3.4. Dogs (Low Growth, Low Market Share)
- 4.4. Ansoff Matrix Analysis
- 4.5. Supply Chain Analysis
- 4.6. Regulatory Landscape
- 4.7. Current Market Potential and Opportunity Assessment (TAM–SAM–SOM Framework)
- 4.8. MDP Analyst Note
- 4.1. Porters Five Forces
- 5. Market Analysis, Insights and Forecast 2021-2033
- 5.1. Market Analysis, Insights and Forecast - by Type
- 5.1.1. Emery
- 5.1.2. Ruby
- 5.1.3. Sapphire
- 5.2. Market Analysis, Insights and Forecast - by Application
- 5.2.1. Jewelry
- 5.2.2. Abrasive
- 5.2.3. Refractory
- 5.2.4. Mineral
- 5.2.5. Electrical and Electronics
- 5.2.6. Other Ap
- 5.3. Market Analysis, Insights and Forecast - by Region
- 5.3.1. Asia Pacific
- 5.3.2. North America
- 5.3.3. Europe
- 5.3.4. South America
- 5.3.5. Middle East and Africa
- 5.1. Market Analysis, Insights and Forecast - by Type
- 6. Global Corundum Industry Analysis, Insights and Forecast, 2021-2033
- 6.1. Market Analysis, Insights and Forecast - by Type
- 6.1.1. Emery
- 6.1.2. Ruby
- 6.1.3. Sapphire
- 6.2. Market Analysis, Insights and Forecast - by Application
- 6.2.1. Jewelry
- 6.2.2. Abrasive
- 6.2.3. Refractory
- 6.2.4. Mineral
- 6.2.5. Electrical and Electronics
- 6.2.6. Other Ap
- 6.1. Market Analysis, Insights and Forecast - by Type
- 7. Asia Pacific Corundum Industry Analysis, Insights and Forecast, 2020-2032
- 7.1. Market Analysis, Insights and Forecast - by Type
- 7.1.1. Emery
- 7.1.2. Ruby
- 7.1.3. Sapphire
- 7.2. Market Analysis, Insights and Forecast - by Application
- 7.2.1. Jewelry
- 7.2.2. Abrasive
- 7.2.3. Refractory
- 7.2.4. Mineral
- 7.2.5. Electrical and Electronics
- 7.2.6. Other Ap
- 7.1. Market Analysis, Insights and Forecast - by Type
- 8. North America Corundum Industry Analysis, Insights and Forecast, 2020-2032
- 8.1. Market Analysis, Insights and Forecast - by Type
- 8.1.1. Emery
- 8.1.2. Ruby
- 8.1.3. Sapphire
- 8.2. Market Analysis, Insights and Forecast - by Application
- 8.2.1. Jewelry
- 8.2.2. Abrasive
- 8.2.3. Refractory
- 8.2.4. Mineral
- 8.2.5. Electrical and Electronics
- 8.2.6. Other Ap
- 8.1. Market Analysis, Insights and Forecast - by Type
- 9. Europe Corundum Industry Analysis, Insights and Forecast, 2020-2032
- 9.1. Market Analysis, Insights and Forecast - by Type
- 9.1.1. Emery
- 9.1.2. Ruby
- 9.1.3. Sapphire
- 9.2. Market Analysis, Insights and Forecast - by Application
- 9.2.1. Jewelry
- 9.2.2. Abrasive
- 9.2.3. Refractory
- 9.2.4. Mineral
- 9.2.5. Electrical and Electronics
- 9.2.6. Other Ap
- 9.1. Market Analysis, Insights and Forecast - by Type
- 10. South America Corundum Industry Analysis, Insights and Forecast, 2020-2032
- 10.1. Market Analysis, Insights and Forecast - by Type
- 10.1.1. Emery
- 10.1.2. Ruby
- 10.1.3. Sapphire
- 10.2. Market Analysis, Insights and Forecast - by Application
- 10.2.1. Jewelry
- 10.2.2. Abrasive
- 10.2.3. Refractory
- 10.2.4. Mineral
- 10.2.5. Electrical and Electronics
- 10.2.6. Other Ap
- 10.1. Market Analysis, Insights and Forecast - by Type
- 11. Middle East and Africa Corundum Industry Analysis, Insights and Forecast, 2020-2032
- 11.1. Market Analysis, Insights and Forecast - by Type
- 11.1.1. Emery
- 11.1.2. Ruby
- 11.1.3. Sapphire
- 11.2. Market Analysis, Insights and Forecast - by Application
- 11.2.1. Jewelry
- 11.2.2. Abrasive
- 11.2.3. Refractory
- 11.2.4. Mineral
- 11.2.5. Electrical and Electronics
- 11.2.6. Other Ap
- 11.1. Market Analysis, Insights and Forecast - by Type
- 12. Competitive Analysis
- 12.1. Company Profiles
- 12.1.1 ALTEO
- 12.1.1.1. Company Overview
- 12.1.1.2. Products
- 12.1.1.3. Company Financials
- 12.1.1.4. SWOT Analysis
- 12.1.2 HENGE Services GmbH
- 12.1.2.1. Company Overview
- 12.1.2.2. Products
- 12.1.2.3. Company Financials
- 12.1.2.4. SWOT Analysis
- 12.1.3 K A Refractories Co Ltd
- 12.1.3.1. Company Overview
- 12.1.3.2. Products
- 12.1.3.3. Company Financials
- 12.1.3.4. SWOT Analysis
- 12.1.4 Mineralmühle Leun Rau GmbH & Co KG
- 12.1.4.1. Company Overview
- 12.1.4.2. Products
- 12.1.4.3. Company Financials
- 12.1.4.4. SWOT Analysis
- 12.1.5 Zibo Jinjiyuan Abrasives Co Ltd*List Not Exhaustive
- 12.1.5.1. Company Overview
- 12.1.5.2. Products
- 12.1.5.3. Company Financials
- 12.1.5.4. SWOT Analysis
- 12.1.6 RIKEN CORUNDUM CO LTD
- 12.1.6.1. Company Overview
- 12.1.6.2. Products
- 12.1.6.3. Company Financials
- 12.1.6.4. SWOT Analysis
- 12.1.7 RusAL
- 12.1.7.1. Company Overview
- 12.1.7.2. Products
- 12.1.7.3. Company Financials
- 12.1.7.4. SWOT Analysis
- 12.1.1 ALTEO
- 12.2. Market Entropy
- 12.2.1 Company's Key Areas Served
- 12.2.2 Recent Developments
- 12.3. Company Market Share Analysis 2025
- 12.3.1 Top 5 Companies Market Share Analysis
- 12.3.2 Top 3 Companies Market Share Analysis
- 12.4. List of Potential Customers
- 13. Research Methodology
List of Figures
- Figure 1: Global Corundum Industry Revenue Breakdown (Million, %) by Region 2025 & 2033
- Figure 2: Asia Pacific Corundum Industry Revenue (Million), by Type 2025 & 2033
- Figure 3: Asia Pacific Corundum Industry Revenue Share (%), by Type 2025 & 2033
- Figure 4: Asia Pacific Corundum Industry Revenue (Million), by Application 2025 & 2033
- Figure 5: Asia Pacific Corundum Industry Revenue Share (%), by Application 2025 & 2033
- Figure 6: Asia Pacific Corundum Industry Revenue (Million), by Country 2025 & 2033
- Figure 7: Asia Pacific Corundum Industry Revenue Share (%), by Country 2025 & 2033
- Figure 8: North America Corundum Industry Revenue (Million), by Type 2025 & 2033
- Figure 9: North America Corundum Industry Revenue Share (%), by Type 2025 & 2033
- Figure 10: North America Corundum Industry Revenue (Million), by Application 2025 & 2033
- Figure 11: North America Corundum Industry Revenue Share (%), by Application 2025 & 2033
- Figure 12: North America Corundum Industry Revenue (Million), by Country 2025 & 2033
- Figure 13: North America Corundum Industry Revenue Share (%), by Country 2025 & 2033
- Figure 14: Europe Corundum Industry Revenue (Million), by Type 2025 & 2033
- Figure 15: Europe Corundum Industry Revenue Share (%), by Type 2025 & 2033
- Figure 16: Europe Corundum Industry Revenue (Million), by Application 2025 & 2033
- Figure 17: Europe Corundum Industry Revenue Share (%), by Application 2025 & 2033
- Figure 18: Europe Corundum Industry Revenue (Million), by Country 2025 & 2033
- Figure 19: Europe Corundum Industry Revenue Share (%), by Country 2025 & 2033
- Figure 20: South America Corundum Industry Revenue (Million), by Type 2025 & 2033
- Figure 21: South America Corundum Industry Revenue Share (%), by Type 2025 & 2033
- Figure 22: South America Corundum Industry Revenue (Million), by Application 2025 & 2033
- Figure 23: South America Corundum Industry Revenue Share (%), by Application 2025 & 2033
- Figure 24: South America Corundum Industry Revenue (Million), by Country 2025 & 2033
- Figure 25: South America Corundum Industry Revenue Share (%), by Country 2025 & 2033
- Figure 26: Middle East and Africa Corundum Industry Revenue (Million), by Type 2025 & 2033
- Figure 27: Middle East and Africa Corundum Industry Revenue Share (%), by Type 2025 & 2033
- Figure 28: Middle East and Africa Corundum Industry Revenue (Million), by Application 2025 & 2033
- Figure 29: Middle East and Africa Corundum Industry Revenue Share (%), by Application 2025 & 2033
- Figure 30: Middle East and Africa Corundum Industry Revenue (Million), by Country 2025 & 2033
- Figure 31: Middle East and Africa Corundum Industry Revenue Share (%), by Country 2025 & 2033
List of Tables
- Table 1: Global Corundum Industry Revenue Million Forecast, by Type 2020 & 2033
- Table 2: Global Corundum Industry Revenue Million Forecast, by Application 2020 & 2033
- Table 3: Global Corundum Industry Revenue Million Forecast, by Region 2020 & 2033
- Table 4: Global Corundum Industry Revenue Million Forecast, by Type 2020 & 2033
- Table 5: Global Corundum Industry Revenue Million Forecast, by Application 2020 & 2033
- Table 6: Global Corundum Industry Revenue Million Forecast, by Country 2020 & 2033
- Table 7: China Corundum Industry Revenue (Million) Forecast, by Application 2020 & 2033
- Table 8: India Corundum Industry Revenue (Million) Forecast, by Application 2020 & 2033
- Table 9: Japan Corundum Industry Revenue (Million) Forecast, by Application 2020 & 2033
- Table 10: South Korea Corundum Industry Revenue (Million) Forecast, by Application 2020 & 2033
- Table 11: Malaysia Corundum Industry Revenue (Million) Forecast, by Application 2020 & 2033
- Table 12: Thailand Corundum Industry Revenue (Million) Forecast, by Application 2020 & 2033
- Table 13: Indonesia Corundum Industry Revenue (Million) Forecast, by Application 2020 & 2033
- Table 14: Vietnam Corundum Industry Revenue (Million) Forecast, by Application 2020 & 2033
- Table 15: Rest of Asia Pacific Corundum Industry Revenue (Million) Forecast, by Application 2020 & 2033
- Table 16: Global Corundum Industry Revenue Million Forecast, by Type 2020 & 2033
- Table 17: Global Corundum Industry Revenue Million Forecast, by Application 2020 & 2033
- Table 18: Global Corundum Industry Revenue Million Forecast, by Country 2020 & 2033
- Table 19: United States Corundum Industry Revenue (Million) Forecast, by Application 2020 & 2033
- Table 20: Canada Corundum Industry Revenue (Million) Forecast, by Application 2020 & 2033
- Table 21: Mexico Corundum Industry Revenue (Million) Forecast, by Application 2020 & 2033
- Table 22: Global Corundum Industry Revenue Million Forecast, by Type 2020 & 2033
- Table 23: Global Corundum Industry Revenue Million Forecast, by Application 2020 & 2033
- Table 24: Global Corundum Industry Revenue Million Forecast, by Country 2020 & 2033
- Table 25: Germany Corundum Industry Revenue (Million) Forecast, by Application 2020 & 2033
- Table 26: United Kingdom Corundum Industry Revenue (Million) Forecast, by Application 2020 & 2033
- Table 27: France Corundum Industry Revenue (Million) Forecast, by Application 2020 & 2033
- Table 28: Italy Corundum Industry Revenue (Million) Forecast, by Application 2020 & 2033
- Table 29: Spain Corundum Industry Revenue (Million) Forecast, by Application 2020 & 2033
- Table 30: Nordic Countries Corundum Industry Revenue (Million) Forecast, by Application 2020 & 2033
- Table 31: Turkey Corundum Industry Revenue (Million) Forecast, by Application 2020 & 2033
- Table 32: Russia Corundum Industry Revenue (Million) Forecast, by Application 2020 & 2033
- Table 33: Rest of Europe Corundum Industry Revenue (Million) Forecast, by Application 2020 & 2033
- Table 34: Global Corundum Industry Revenue Million Forecast, by Type 2020 & 2033
- Table 35: Global Corundum Industry Revenue Million Forecast, by Application 2020 & 2033
- Table 36: Global Corundum Industry Revenue Million Forecast, by Country 2020 & 2033
- Table 37: Brazil Corundum Industry Revenue (Million) Forecast, by Application 2020 & 2033
- Table 38: Argentina Corundum Industry Revenue (Million) Forecast, by Application 2020 & 2033
- Table 39: Colombia Corundum Industry Revenue (Million) Forecast, by Application 2020 & 2033
- Table 40: Rest of South America Corundum Industry Revenue (Million) Forecast, by Application 2020 & 2033
- Table 41: Global Corundum Industry Revenue Million Forecast, by Type 2020 & 2033
- Table 42: Global Corundum Industry Revenue Million Forecast, by Application 2020 & 2033
- Table 43: Global Corundum Industry Revenue Million Forecast, by Country 2020 & 2033
- Table 44: Saudi Arabia Corundum Industry Revenue (Million) Forecast, by Application 2020 & 2033
- Table 45: South Africa Corundum Industry Revenue (Million) Forecast, by Application 2020 & 2033
- Table 46: Nigeria Corundum Industry Revenue (Million) Forecast, by Application 2020 & 2033
- Table 47: Qatar Corundum Industry Revenue (Million) Forecast, by Application 2020 & 2033
- Table 48: Egypt Corundum Industry Revenue (Million) Forecast, by Application 2020 & 2033
- Table 49: United Arab Emirates Corundum Industry Revenue (Million) Forecast, by Application 2020 & 2033
- Table 50: Rest of Middle East and Africa Corundum Industry Revenue (Million) Forecast, by Application 2020 & 2033
Frequently Asked Questions
1. What is the projected Compound Annual Growth Rate (CAGR) of the Corundum Industry?
The projected CAGR is approximately > 6.00%.
2. Which companies are prominent players in the Corundum Industry?
Key companies in the market include ALTEO, HENGE Services GmbH, K A Refractories Co Ltd, Mineralmühle Leun Rau GmbH & Co KG, Zibo Jinjiyuan Abrasives Co Ltd*List Not Exhaustive, RIKEN CORUNDUM CO LTD, RusAL.
3. What are the main segments of the Corundum Industry?
The market segments include Type, Application.
4. Can you provide details about the market size?
The market size is estimated to be USD 3.07 Million as of 2022.
5. What are some drivers contributing to market growth?
High Demand for Synthetic Corundum in Abrasion Applications; Growing Demand of Artificial Corundum in Jewelry Sector; Others.
6. What are the notable trends driving market growth?
Jewelry Segment to Dominate the Market.
7. Are there any restraints impacting market growth?
Competition from Fused Alumina and Silicon Carbide; Others.
8. Can you provide examples of recent developments in the market?
N/A
9. What pricing options are available for accessing the report?
Pricing options include single-user, multi-user, and enterprise licenses priced at USD 4750, USD 5250, and USD 8750 respectively.
10. Is the market size provided in terms of value or volume?
The market size is provided in terms of value, measured in Million.
11. Are there any specific market keywords associated with the report?
Yes, the market keyword associated with the report is "Corundum Industry," which aids in identifying and referencing the specific market segment covered.
12. How do I determine which pricing option suits my needs best?
The pricing options vary based on user requirements and access needs. Individual users may opt for single-user licenses, while businesses requiring broader access may choose multi-user or enterprise licenses for cost-effective access to the report.
13. Are there any additional resources or data provided in the Corundum Industry report?
While the report offers comprehensive insights, it's advisable to review the specific contents or supplementary materials provided to ascertain if additional resources or data are available.
14. How can I stay updated on further developments or reports in the Corundum Industry?
To stay informed about further developments, trends, and reports in the Corundum Industry, consider subscribing to industry newsletters, following relevant companies and organizations, or regularly checking reputable industry news sources and publications.
Methodology
Step 1 - Identification of Relevant Samples Size from Population Database


Step 2 - Approaches for Defining Global Market Size (Value, Volume* & Price*)

Note*: In applicable scenarios
Step 3 - Data Sources
Primary Research
- Web Analytics
- Survey Reports
- Research Institute
- Latest Research Reports
- Opinion Leaders
Secondary Research
- Annual Reports
- White Paper
- Latest Press Release
- Industry Association
- Paid Database
- Investor Presentations

Step 4 - Data Triangulation
Involves using different sources of information in order to increase the validity of a study
These sources are likely to be stakeholders in a program - participants, other researchers, program staff, other community members, and so on.
Then we put all data in single framework & apply various statistical tools to find out the dynamic on the market.
During the analysis stage, feedback from the stakeholder groups would be compared to determine areas of agreement as well as areas of divergence