

Key Insights
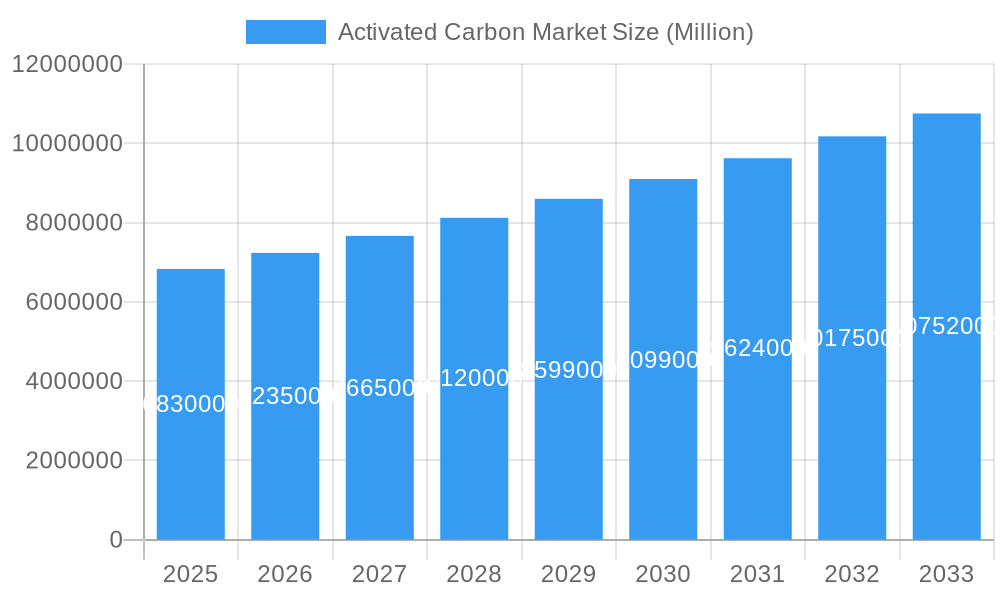
The global Activated Carbon Market is poised for substantial growth, projected to reach an estimated $6.83 Million by 2025, exhibiting a Compound Annual Growth Rate (CAGR) of 5.95% from 2019-2033. This robust expansion is fueled by an increasing demand for environmental protection and stringent regulations worldwide, particularly concerning water and air quality. The primary drivers for this market are the escalating need for efficient purification solutions in industries like water treatment, food and beverage, and healthcare, alongside the growing adoption of activated carbon in metal extraction and medicine. The market is segmented into product types such as Powdered Activated Carbons (PAC), Granular Activated Carbons (GAC), and Extruded or Pelletized Activated Carbon, catering to diverse applications including gas purification and water purification. Key end-user industries, including Water Treatment, Food and Beverage, and Healthcare, are significant contributors to this market's upward trajectory.
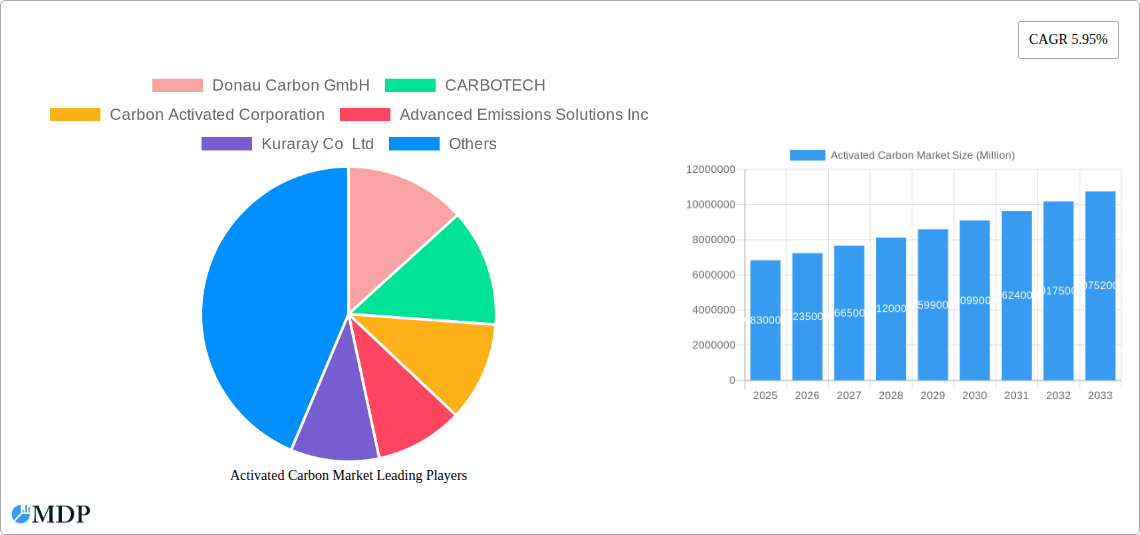
Activated Carbon Market Market Size (In Million)
The market's dynamism is further shaped by prevailing trends such as the development of innovative activated carbon technologies for enhanced adsorption capacities and specialized applications, alongside a growing preference for sustainable and eco-friendly purification methods. However, the market faces certain restraints, including the fluctuating raw material costs, particularly for coal and wood, and the capital-intensive nature of manufacturing processes. Geographically, the Asia Pacific region, led by China and India, is anticipated to be a dominant force due to rapid industrialization and increasing environmental awareness. North America and Europe also represent significant markets, driven by established environmental regulations and advanced technological adoption. Key players like Donau Carbon GmbH, CARBOTECH, and Cabot Corporation are actively innovating and expanding their product portfolios to capture a larger market share.
Activated Carbon Market Company Market Share
Activated Carbon Market: Comprehensive Analysis and Strategic Outlook (2019-2033)
This in-depth Activated Carbon Market report provides an exhaustive analysis of the global market, encompassing detailed segmentation, key trends, growth drivers, challenges, and a strategic outlook. Leveraging advanced analytics and extensive primary and secondary research, this report offers invaluable insights for stakeholders seeking to understand market dynamics and capitalize on emerging opportunities. The study covers the historical period from 2019 to 2024, with a base year of 2025 and a comprehensive forecast period extending to 2033. Our analysis includes market size estimates in Million USD for all values.
Activated Carbon Market Market Dynamics & Concentration
The global activated carbon market is characterized by moderate concentration, with a few dominant players holding significant market share, alongside a growing number of specialized manufacturers. Innovation drivers are primarily fueled by increasing environmental regulations mandating stringent emission and effluent standards, particularly in water and air purification applications. The demand for high-performance activated carbon with tailored pore structures for specific contaminant removal is also a significant innovation impetus. Regulatory frameworks worldwide are increasingly favoring sustainable and efficient purification technologies, directly boosting the activated carbon market size. Product substitutes, while existing (e.g., zeolites, ion exchange resins), often lack the broad-spectrum adsorption capabilities and cost-effectiveness of activated carbon for many applications, leading to its continued dominance. End-user trends are shifting towards circular economy principles, with a growing interest in再生 activated carbon solutions and the development of bio-based activated carbons derived from sustainable feedstocks. Merger and acquisition (M&A) activities have been observed as companies aim to expand their geographical reach, product portfolios, and technological capabilities. For instance, the divestiture of Cabot Corporation's activated carbon unit highlights strategic realignments within the industry. The market is projected to witness a steady influx of new entrants attracted by the robust growth prospects.
Activated Carbon Market Industry Trends & Analysis
The activated carbon market is poised for substantial growth, driven by a confluence of factors including escalating global demand for clean water and air, stringent environmental regulations, and advancements in material science. The market size is projected to reach $XX Million by 2033, exhibiting a Compound Annual Growth Rate (CAGR) of approximately XX% during the forecast period. A key growth driver is the increasing industrialization and urbanization, leading to higher volumes of wastewater and air emissions requiring effective treatment. The water purification segment, particularly for potable water and industrial effluent treatment, continues to be a dominant application, bolstered by growing awareness of water scarcity and the need for high-quality water. Similarly, gas purification applications, encompassing industrial emissions control, automotive vapor recovery, and indoor air quality improvement, are experiencing robust expansion. Technological disruptions are emerging in the form of novel activated carbon production methods, such as microwave-assisted activation and steam activation enhancements, leading to improved adsorption capacities and reduced production costs. Furthermore, research into developing specialized activated carbons with enhanced selectivity for specific pollutants, including emerging contaminants like PFAS, is gaining traction. Consumer preferences are increasingly aligning with sustainable and eco-friendly solutions, propelling the demand for activated carbons derived from renewable resources like coconut shells and wood. The competitive landscape is dynamic, with established players investing heavily in R&D and strategic partnerships to maintain their market positions. The growing adoption of activated carbon in niche applications such as food and beverage processing for decolorization and purification, and in the pharmaceutical industry for drug purification and medical applications, further contributes to market penetration.
Leading Markets & Segments in Activated Carbon Market
The Granular Activated Carbon (GAC) segment is a dominant force within the activated carbon product type classification, largely attributed to its widespread use in large-scale water and gas purification systems. Its ease of handling, regeneration capabilities, and high adsorption capacity make it ideal for industrial and municipal applications. In the application landscape, Water Purification commands the largest market share. This dominance is fueled by global initiatives for safe drinking water access, stringent wastewater discharge regulations, and the growing need for industrial process water purification. Economic policies promoting sustainable resource management and substantial investments in water infrastructure development in both developed and developing economies are key drivers.
The Water Treatment end-user industry is therefore a primary beneficiary and contributor to the activated carbon market's growth. Infrastructure development projects focused on expanding and upgrading water treatment facilities are crucial. Furthermore, the Food and Beverage industry’s reliance on activated carbon for decolorization, deodorization, and purification processes in sugar, edible oil, and beverage production, further solidifies its importance. Within the Other End-user Industries, the mining sector's use of activated carbon in gold recovery (metal extraction) represents a significant and consistent demand driver.
Activated Carbon Market Product Developments
Product development in the activated carbon market is focused on enhancing adsorption efficiency, selectivity, and sustainability. Innovations include the development of highly microporous activated carbons for the capture of small volatile organic compounds (VOCs) and specialized carbons designed for the removal of specific heavy metals or emerging contaminants like per- and polyfluoroalkyl substances (PFAS). The integration of advanced materials and surface modification techniques aims to create activated carbons with tailored pore structures and functionalities, offering competitive advantages in niche applications. Furthermore, the trend towards producing activated carbons from renewable biomass sources, such as agricultural waste and forestry by-products, is gaining momentum, aligning with market demands for eco-friendly solutions.
Key Drivers of Activated Carbon Market Growth
The activated carbon market is experiencing significant growth, primarily propelled by increasingly stringent environmental regulations worldwide mandating the reduction of pollutants in air and water. Technological advancements in activation processes and material science are yielding activated carbons with enhanced adsorption capacities and tailored properties for specific applications. The growing global emphasis on water security and the need for effective wastewater treatment solutions are creating sustained demand. Furthermore, the expanding use of activated carbon in diverse industrial processes, including food and beverage purification and metal extraction, along with its critical role in healthcare and pharmaceutical applications, are significant growth accelerators.
Challenges in the Activated Carbon Market Market
Despite its robust growth trajectory, the activated carbon market faces several challenges. Fluctuations in the price and availability of raw materials, particularly for coconut shell-based activated carbon, can impact production costs and market stability. The high energy consumption associated with the manufacturing process also presents an environmental concern and contributes to operational expenses. Moreover, the development of advanced substitutes and competing purification technologies poses a competitive threat in certain applications. Stringent regulatory requirements for activated carbon production and disposal can also add to compliance costs for manufacturers.
Emerging Opportunities in Activated Carbon Market
The activated carbon market is ripe with emerging opportunities driven by technological breakthroughs and evolving industry needs. The increasing focus on capturing carbon dioxide from industrial emissions and the atmosphere presents a significant long-term growth avenue. The development of innovative activated carbon materials for energy storage applications, such as supercapacitors and battery electrodes, is also gaining traction. Furthermore, the growing demand for activated carbon in emerging economies, coupled with strategic partnerships and collaborations aimed at expanding production capacity and market reach, are key catalysts for future growth.
Leading Players in the Activated Carbon Market Sector
- Donau Carbon GmbH
- CARBOTECH
- Carbon Activated Corporation
- Advanced Emissions Solutions Inc
- Kuraray Co Ltd
- CPL Activated Carbons
- Evoqua Water Technologies LLC
- Cabot Corporation
- Kureha Corporation
- Ingevity
- Silcarbon Aktivkohle GmbH
- Haycarb (Pvt ) Ltd
- Puragen Activated Carbons
- Jacobi Carbons Group
- Albemarle Corporation
- Veolia (Veolia Water Technologies)
Key Milestones in Activated Carbon Market Industry
- March 2022: Cabot Corporation sold off its activated carbon unit, Norit Activated Carbon, to One Equity Partners. Following the divestiture, Norit Activated Carbon became an independent company serving its customers with a broad portfolio of activated carbon solutions through its ten production facilities in seven countries.
Strategic Outlook for Activated Carbon Market Market
The activated carbon market is projected for sustained expansion, driven by increasing environmental consciousness and regulatory mandates. Strategic opportunities lie in developing sustainable and cost-effective production methods, particularly from renewable feedstocks. Companies that can innovate in high-performance activated carbons for emerging contaminants and advanced applications, such as CO2 capture and energy storage, are well-positioned for future success. Expansion into untapped geographical markets and strategic partnerships for technology development and market access will be crucial for capitalizing on the evolving market landscape and accelerating growth.
Activated Carbon Market Segmentation
-
1. Product Type
- 1.1. Powdered Activated Carbons (PAC)
- 1.2. Granular Activated Carbons (GAC)
- 1.3. Extruded or Pelletized Activated Carbon
-
2. Application
- 2.1. Gas Purification
- 2.2. Water Purification
- 2.3. Metal Extraction
- 2.4. Medicine
- 2.5. Other Applications
-
3. End-user Industry
- 3.1. Water Treatment
- 3.2. Food and Beverage
- 3.3. Healthcare
- 3.4. Automotive
- 3.5. Industrial Processing
- 3.6. Other End-user Industries
Activated Carbon Market Segmentation By Geography
-
1. Asia Pacific
- 1.1. China
- 1.2. India
- 1.3. Japan
- 1.4. South Korea
- 1.5. Rest of Asia Pacific
-
2. North America
- 2.1. United States
- 2.2. Canada
- 2.3. Mexico
-
3. Europe
- 3.1. Germany
- 3.2. United Kingdom
- 3.3. France
- 3.4. Italy
- 3.5. Spain
- 3.6. Rest of Europe
-
4. South America
- 4.1. Brazil
- 4.2. Argentina
- 4.3. Rest of South America
-
5. Middle East and Africa
- 5.1. Saudi Arabia
- 5.2. South Africa
- 5.3. Rest of Middle East and Africa
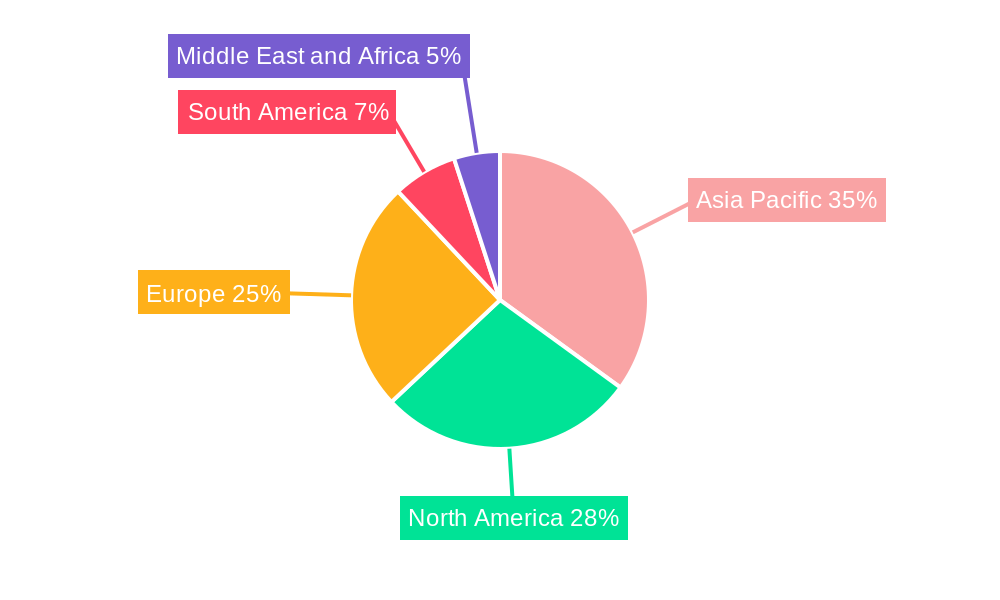
Activated Carbon Market Regional Market Share
Geographic Coverage of Activated Carbon Market
Activated Carbon Market REPORT HIGHLIGHTS
| Aspects | Details |
|---|---|
| Study Period | 2020-2034 |
| Base Year | 2025 |
| Estimated Year | 2026 |
| Forecast Period | 2026-2034 |
| Historical Period | 2020-2025 |
| Growth Rate | CAGR of 5.95% from 2020-2034 |
| Segmentation |
|
Table of Contents
- 1. Introduction
- 1.1. Research Scope
- 1.2. Market Segmentation
- 1.3. Research Objective
- 1.4. Definitions and Assumptions
- 2. Executive Summary
- 2.1. Market Snapshot
- 3. Market Dynamics
- 3.1. Market Drivers
- 3.2. Market Restrains
- 3.3. Market Trends
- 3.4. Market Opportunities
- 4. Market Factor Analysis
- 4.1. Porters Five Forces
- 4.1.1. Bargaining Power of Suppliers
- 4.1.2. Bargaining Power of Buyers
- 4.1.3. Threat of New Entrants
- 4.1.4. Threat of Substitutes
- 4.1.5. Competitive Rivalry
- 4.2. PESTEL analysis
- 4.3. BCG Analysis
- 4.3.1. Stars (High Growth, High Market Share)
- 4.3.2. Cash Cows (Low Growth, High Market Share)
- 4.3.3. Question Mark (High Growth, Low Market Share)
- 4.3.4. Dogs (Low Growth, Low Market Share)
- 4.4. Ansoff Matrix Analysis
- 4.5. Supply Chain Analysis
- 4.6. Regulatory Landscape
- 4.7. Current Market Potential and Opportunity Assessment (TAM–SAM–SOM Framework)
- 4.8. MDP Analyst Note
- 4.1. Porters Five Forces
- 5. Market Analysis, Insights and Forecast 2021-2033
- 5.1. Market Analysis, Insights and Forecast - by Product Type
- 5.1.1. Powdered Activated Carbons (PAC)
- 5.1.2. Granular Activated Carbons (GAC)
- 5.1.3. Extruded or Pelletized Activated Carbon
- 5.2. Market Analysis, Insights and Forecast - by Application
- 5.2.1. Gas Purification
- 5.2.2. Water Purification
- 5.2.3. Metal Extraction
- 5.2.4. Medicine
- 5.2.5. Other Applications
- 5.3. Market Analysis, Insights and Forecast - by End-user Industry
- 5.3.1. Water Treatment
- 5.3.2. Food and Beverage
- 5.3.3. Healthcare
- 5.3.4. Automotive
- 5.3.5. Industrial Processing
- 5.3.6. Other End-user Industries
- 5.4. Market Analysis, Insights and Forecast - by Region
- 5.4.1. Asia Pacific
- 5.4.2. North America
- 5.4.3. Europe
- 5.4.4. South America
- 5.4.5. Middle East and Africa
- 5.1. Market Analysis, Insights and Forecast - by Product Type
- 6. Global Activated Carbon Market Analysis, Insights and Forecast, 2021-2033
- 6.1. Market Analysis, Insights and Forecast - by Product Type
- 6.1.1. Powdered Activated Carbons (PAC)
- 6.1.2. Granular Activated Carbons (GAC)
- 6.1.3. Extruded or Pelletized Activated Carbon
- 6.2. Market Analysis, Insights and Forecast - by Application
- 6.2.1. Gas Purification
- 6.2.2. Water Purification
- 6.2.3. Metal Extraction
- 6.2.4. Medicine
- 6.2.5. Other Applications
- 6.3. Market Analysis, Insights and Forecast - by End-user Industry
- 6.3.1. Water Treatment
- 6.3.2. Food and Beverage
- 6.3.3. Healthcare
- 6.3.4. Automotive
- 6.3.5. Industrial Processing
- 6.3.6. Other End-user Industries
- 6.1. Market Analysis, Insights and Forecast - by Product Type
- 7. Asia Pacific Activated Carbon Market Analysis, Insights and Forecast, 2020-2032
- 7.1. Market Analysis, Insights and Forecast - by Product Type
- 7.1.1. Powdered Activated Carbons (PAC)
- 7.1.2. Granular Activated Carbons (GAC)
- 7.1.3. Extruded or Pelletized Activated Carbon
- 7.2. Market Analysis, Insights and Forecast - by Application
- 7.2.1. Gas Purification
- 7.2.2. Water Purification
- 7.2.3. Metal Extraction
- 7.2.4. Medicine
- 7.2.5. Other Applications
- 7.3. Market Analysis, Insights and Forecast - by End-user Industry
- 7.3.1. Water Treatment
- 7.3.2. Food and Beverage
- 7.3.3. Healthcare
- 7.3.4. Automotive
- 7.3.5. Industrial Processing
- 7.3.6. Other End-user Industries
- 7.1. Market Analysis, Insights and Forecast - by Product Type
- 8. North America Activated Carbon Market Analysis, Insights and Forecast, 2020-2032
- 8.1. Market Analysis, Insights and Forecast - by Product Type
- 8.1.1. Powdered Activated Carbons (PAC)
- 8.1.2. Granular Activated Carbons (GAC)
- 8.1.3. Extruded or Pelletized Activated Carbon
- 8.2. Market Analysis, Insights and Forecast - by Application
- 8.2.1. Gas Purification
- 8.2.2. Water Purification
- 8.2.3. Metal Extraction
- 8.2.4. Medicine
- 8.2.5. Other Applications
- 8.3. Market Analysis, Insights and Forecast - by End-user Industry
- 8.3.1. Water Treatment
- 8.3.2. Food and Beverage
- 8.3.3. Healthcare
- 8.3.4. Automotive
- 8.3.5. Industrial Processing
- 8.3.6. Other End-user Industries
- 8.1. Market Analysis, Insights and Forecast - by Product Type
- 9. Europe Activated Carbon Market Analysis, Insights and Forecast, 2020-2032
- 9.1. Market Analysis, Insights and Forecast - by Product Type
- 9.1.1. Powdered Activated Carbons (PAC)
- 9.1.2. Granular Activated Carbons (GAC)
- 9.1.3. Extruded or Pelletized Activated Carbon
- 9.2. Market Analysis, Insights and Forecast - by Application
- 9.2.1. Gas Purification
- 9.2.2. Water Purification
- 9.2.3. Metal Extraction
- 9.2.4. Medicine
- 9.2.5. Other Applications
- 9.3. Market Analysis, Insights and Forecast - by End-user Industry
- 9.3.1. Water Treatment
- 9.3.2. Food and Beverage
- 9.3.3. Healthcare
- 9.3.4. Automotive
- 9.3.5. Industrial Processing
- 9.3.6. Other End-user Industries
- 9.1. Market Analysis, Insights and Forecast - by Product Type
- 10. South America Activated Carbon Market Analysis, Insights and Forecast, 2020-2032
- 10.1. Market Analysis, Insights and Forecast - by Product Type
- 10.1.1. Powdered Activated Carbons (PAC)
- 10.1.2. Granular Activated Carbons (GAC)
- 10.1.3. Extruded or Pelletized Activated Carbon
- 10.2. Market Analysis, Insights and Forecast - by Application
- 10.2.1. Gas Purification
- 10.2.2. Water Purification
- 10.2.3. Metal Extraction
- 10.2.4. Medicine
- 10.2.5. Other Applications
- 10.3. Market Analysis, Insights and Forecast - by End-user Industry
- 10.3.1. Water Treatment
- 10.3.2. Food and Beverage
- 10.3.3. Healthcare
- 10.3.4. Automotive
- 10.3.5. Industrial Processing
- 10.3.6. Other End-user Industries
- 10.1. Market Analysis, Insights and Forecast - by Product Type
- 11. Middle East and Africa Activated Carbon Market Analysis, Insights and Forecast, 2020-2032
- 11.1. Market Analysis, Insights and Forecast - by Product Type
- 11.1.1. Powdered Activated Carbons (PAC)
- 11.1.2. Granular Activated Carbons (GAC)
- 11.1.3. Extruded or Pelletized Activated Carbon
- 11.2. Market Analysis, Insights and Forecast - by Application
- 11.2.1. Gas Purification
- 11.2.2. Water Purification
- 11.2.3. Metal Extraction
- 11.2.4. Medicine
- 11.2.5. Other Applications
- 11.3. Market Analysis, Insights and Forecast - by End-user Industry
- 11.3.1. Water Treatment
- 11.3.2. Food and Beverage
- 11.3.3. Healthcare
- 11.3.4. Automotive
- 11.3.5. Industrial Processing
- 11.3.6. Other End-user Industries
- 11.1. Market Analysis, Insights and Forecast - by Product Type
- 12. Competitive Analysis
- 12.1. Company Profiles
- 12.1.1 Donau Carbon GmbH
- 12.1.1.1. Company Overview
- 12.1.1.2. Products
- 12.1.1.3. Company Financials
- 12.1.1.4. SWOT Analysis
- 12.1.2 CARBOTECH
- 12.1.2.1. Company Overview
- 12.1.2.2. Products
- 12.1.2.3. Company Financials
- 12.1.2.4. SWOT Analysis
- 12.1.3 Carbon Activated Corporation
- 12.1.3.1. Company Overview
- 12.1.3.2. Products
- 12.1.3.3. Company Financials
- 12.1.3.4. SWOT Analysis
- 12.1.4 Advanced Emissions Solutions Inc
- 12.1.4.1. Company Overview
- 12.1.4.2. Products
- 12.1.4.3. Company Financials
- 12.1.4.4. SWOT Analysis
- 12.1.5 Kuraray Co Ltd
- 12.1.5.1. Company Overview
- 12.1.5.2. Products
- 12.1.5.3. Company Financials
- 12.1.5.4. SWOT Analysis
- 12.1.6 CPL Activated Carbons
- 12.1.6.1. Company Overview
- 12.1.6.2. Products
- 12.1.6.3. Company Financials
- 12.1.6.4. SWOT Analysis
- 12.1.7 Evoqua Water Technologies LLC
- 12.1.7.1. Company Overview
- 12.1.7.2. Products
- 12.1.7.3. Company Financials
- 12.1.7.4. SWOT Analysis
- 12.1.8 Cabot Corporation
- 12.1.8.1. Company Overview
- 12.1.8.2. Products
- 12.1.8.3. Company Financials
- 12.1.8.4. SWOT Analysis
- 12.1.9 Kureha Corporation
- 12.1.9.1. Company Overview
- 12.1.9.2. Products
- 12.1.9.3. Company Financials
- 12.1.9.4. SWOT Analysis
- 12.1.10 Ingevity
- 12.1.10.1. Company Overview
- 12.1.10.2. Products
- 12.1.10.3. Company Financials
- 12.1.10.4. SWOT Analysis
- 12.1.11 Silcarbon Aktivkohle GmbH
- 12.1.11.1. Company Overview
- 12.1.11.2. Products
- 12.1.11.3. Company Financials
- 12.1.11.4. SWOT Analysis
- 12.1.12 Haycarb (Pvt ) Ltd
- 12.1.12.1. Company Overview
- 12.1.12.2. Products
- 12.1.12.3. Company Financials
- 12.1.12.4. SWOT Analysis
- 12.1.13 Puragen Activated Carbons
- 12.1.13.1. Company Overview
- 12.1.13.2. Products
- 12.1.13.3. Company Financials
- 12.1.13.4. SWOT Analysis
- 12.1.14 Jacobi Carbons Group
- 12.1.14.1. Company Overview
- 12.1.14.2. Products
- 12.1.14.3. Company Financials
- 12.1.14.4. SWOT Analysis
- 12.1.15 Albemarle Corporation
- 12.1.15.1. Company Overview
- 12.1.15.2. Products
- 12.1.15.3. Company Financials
- 12.1.15.4. SWOT Analysis
- 12.1.16 Veolia (Veolia Water Technologies)*List Not Exhaustive
- 12.1.16.1. Company Overview
- 12.1.16.2. Products
- 12.1.16.3. Company Financials
- 12.1.16.4. SWOT Analysis
- 12.1.1 Donau Carbon GmbH
- 12.2. Market Entropy
- 12.2.1 Company's Key Areas Served
- 12.2.2 Recent Developments
- 12.3. Company Market Share Analysis 2025
- 12.3.1 Top 5 Companies Market Share Analysis
- 12.3.2 Top 3 Companies Market Share Analysis
- 12.4. List of Potential Customers
- 13. Research Methodology
List of Figures
- Figure 1: Global Activated Carbon Market Revenue Breakdown (Million, %) by Region 2025 & 2033
- Figure 2: Asia Pacific Activated Carbon Market Revenue (Million), by Product Type 2025 & 2033
- Figure 3: Asia Pacific Activated Carbon Market Revenue Share (%), by Product Type 2025 & 2033
- Figure 4: Asia Pacific Activated Carbon Market Revenue (Million), by Application 2025 & 2033
- Figure 5: Asia Pacific Activated Carbon Market Revenue Share (%), by Application 2025 & 2033
- Figure 6: Asia Pacific Activated Carbon Market Revenue (Million), by End-user Industry 2025 & 2033
- Figure 7: Asia Pacific Activated Carbon Market Revenue Share (%), by End-user Industry 2025 & 2033
- Figure 8: Asia Pacific Activated Carbon Market Revenue (Million), by Country 2025 & 2033
- Figure 9: Asia Pacific Activated Carbon Market Revenue Share (%), by Country 2025 & 2033
- Figure 10: North America Activated Carbon Market Revenue (Million), by Product Type 2025 & 2033
- Figure 11: North America Activated Carbon Market Revenue Share (%), by Product Type 2025 & 2033
- Figure 12: North America Activated Carbon Market Revenue (Million), by Application 2025 & 2033
- Figure 13: North America Activated Carbon Market Revenue Share (%), by Application 2025 & 2033
- Figure 14: North America Activated Carbon Market Revenue (Million), by End-user Industry 2025 & 2033
- Figure 15: North America Activated Carbon Market Revenue Share (%), by End-user Industry 2025 & 2033
- Figure 16: North America Activated Carbon Market Revenue (Million), by Country 2025 & 2033
- Figure 17: North America Activated Carbon Market Revenue Share (%), by Country 2025 & 2033
- Figure 18: Europe Activated Carbon Market Revenue (Million), by Product Type 2025 & 2033
- Figure 19: Europe Activated Carbon Market Revenue Share (%), by Product Type 2025 & 2033
- Figure 20: Europe Activated Carbon Market Revenue (Million), by Application 2025 & 2033
- Figure 21: Europe Activated Carbon Market Revenue Share (%), by Application 2025 & 2033
- Figure 22: Europe Activated Carbon Market Revenue (Million), by End-user Industry 2025 & 2033
- Figure 23: Europe Activated Carbon Market Revenue Share (%), by End-user Industry 2025 & 2033
- Figure 24: Europe Activated Carbon Market Revenue (Million), by Country 2025 & 2033
- Figure 25: Europe Activated Carbon Market Revenue Share (%), by Country 2025 & 2033
- Figure 26: South America Activated Carbon Market Revenue (Million), by Product Type 2025 & 2033
- Figure 27: South America Activated Carbon Market Revenue Share (%), by Product Type 2025 & 2033
- Figure 28: South America Activated Carbon Market Revenue (Million), by Application 2025 & 2033
- Figure 29: South America Activated Carbon Market Revenue Share (%), by Application 2025 & 2033
- Figure 30: South America Activated Carbon Market Revenue (Million), by End-user Industry 2025 & 2033
- Figure 31: South America Activated Carbon Market Revenue Share (%), by End-user Industry 2025 & 2033
- Figure 32: South America Activated Carbon Market Revenue (Million), by Country 2025 & 2033
- Figure 33: South America Activated Carbon Market Revenue Share (%), by Country 2025 & 2033
- Figure 34: Middle East and Africa Activated Carbon Market Revenue (Million), by Product Type 2025 & 2033
- Figure 35: Middle East and Africa Activated Carbon Market Revenue Share (%), by Product Type 2025 & 2033
- Figure 36: Middle East and Africa Activated Carbon Market Revenue (Million), by Application 2025 & 2033
- Figure 37: Middle East and Africa Activated Carbon Market Revenue Share (%), by Application 2025 & 2033
- Figure 38: Middle East and Africa Activated Carbon Market Revenue (Million), by End-user Industry 2025 & 2033
- Figure 39: Middle East and Africa Activated Carbon Market Revenue Share (%), by End-user Industry 2025 & 2033
- Figure 40: Middle East and Africa Activated Carbon Market Revenue (Million), by Country 2025 & 2033
- Figure 41: Middle East and Africa Activated Carbon Market Revenue Share (%), by Country 2025 & 2033
List of Tables
- Table 1: Global Activated Carbon Market Revenue Million Forecast, by Product Type 2020 & 2033
- Table 2: Global Activated Carbon Market Revenue Million Forecast, by Application 2020 & 2033
- Table 3: Global Activated Carbon Market Revenue Million Forecast, by End-user Industry 2020 & 2033
- Table 4: Global Activated Carbon Market Revenue Million Forecast, by Region 2020 & 2033
- Table 5: Global Activated Carbon Market Revenue Million Forecast, by Product Type 2020 & 2033
- Table 6: Global Activated Carbon Market Revenue Million Forecast, by Application 2020 & 2033
- Table 7: Global Activated Carbon Market Revenue Million Forecast, by End-user Industry 2020 & 2033
- Table 8: Global Activated Carbon Market Revenue Million Forecast, by Country 2020 & 2033
- Table 9: China Activated Carbon Market Revenue (Million) Forecast, by Application 2020 & 2033
- Table 10: India Activated Carbon Market Revenue (Million) Forecast, by Application 2020 & 2033
- Table 11: Japan Activated Carbon Market Revenue (Million) Forecast, by Application 2020 & 2033
- Table 12: South Korea Activated Carbon Market Revenue (Million) Forecast, by Application 2020 & 2033
- Table 13: Rest of Asia Pacific Activated Carbon Market Revenue (Million) Forecast, by Application 2020 & 2033
- Table 14: Global Activated Carbon Market Revenue Million Forecast, by Product Type 2020 & 2033
- Table 15: Global Activated Carbon Market Revenue Million Forecast, by Application 2020 & 2033
- Table 16: Global Activated Carbon Market Revenue Million Forecast, by End-user Industry 2020 & 2033
- Table 17: Global Activated Carbon Market Revenue Million Forecast, by Country 2020 & 2033
- Table 18: United States Activated Carbon Market Revenue (Million) Forecast, by Application 2020 & 2033
- Table 19: Canada Activated Carbon Market Revenue (Million) Forecast, by Application 2020 & 2033
- Table 20: Mexico Activated Carbon Market Revenue (Million) Forecast, by Application 2020 & 2033
- Table 21: Global Activated Carbon Market Revenue Million Forecast, by Product Type 2020 & 2033
- Table 22: Global Activated Carbon Market Revenue Million Forecast, by Application 2020 & 2033
- Table 23: Global Activated Carbon Market Revenue Million Forecast, by End-user Industry 2020 & 2033
- Table 24: Global Activated Carbon Market Revenue Million Forecast, by Country 2020 & 2033
- Table 25: Germany Activated Carbon Market Revenue (Million) Forecast, by Application 2020 & 2033
- Table 26: United Kingdom Activated Carbon Market Revenue (Million) Forecast, by Application 2020 & 2033
- Table 27: France Activated Carbon Market Revenue (Million) Forecast, by Application 2020 & 2033
- Table 28: Italy Activated Carbon Market Revenue (Million) Forecast, by Application 2020 & 2033
- Table 29: Spain Activated Carbon Market Revenue (Million) Forecast, by Application 2020 & 2033
- Table 30: Rest of Europe Activated Carbon Market Revenue (Million) Forecast, by Application 2020 & 2033
- Table 31: Global Activated Carbon Market Revenue Million Forecast, by Product Type 2020 & 2033
- Table 32: Global Activated Carbon Market Revenue Million Forecast, by Application 2020 & 2033
- Table 33: Global Activated Carbon Market Revenue Million Forecast, by End-user Industry 2020 & 2033
- Table 34: Global Activated Carbon Market Revenue Million Forecast, by Country 2020 & 2033
- Table 35: Brazil Activated Carbon Market Revenue (Million) Forecast, by Application 2020 & 2033
- Table 36: Argentina Activated Carbon Market Revenue (Million) Forecast, by Application 2020 & 2033
- Table 37: Rest of South America Activated Carbon Market Revenue (Million) Forecast, by Application 2020 & 2033
- Table 38: Global Activated Carbon Market Revenue Million Forecast, by Product Type 2020 & 2033
- Table 39: Global Activated Carbon Market Revenue Million Forecast, by Application 2020 & 2033
- Table 40: Global Activated Carbon Market Revenue Million Forecast, by End-user Industry 2020 & 2033
- Table 41: Global Activated Carbon Market Revenue Million Forecast, by Country 2020 & 2033
- Table 42: Saudi Arabia Activated Carbon Market Revenue (Million) Forecast, by Application 2020 & 2033
- Table 43: South Africa Activated Carbon Market Revenue (Million) Forecast, by Application 2020 & 2033
- Table 44: Rest of Middle East and Africa Activated Carbon Market Revenue (Million) Forecast, by Application 2020 & 2033
Frequently Asked Questions
1. What is the projected Compound Annual Growth Rate (CAGR) of the Activated Carbon Market?
The projected CAGR is approximately 5.95%.
2. Which companies are prominent players in the Activated Carbon Market?
Key companies in the market include Donau Carbon GmbH, CARBOTECH, Carbon Activated Corporation, Advanced Emissions Solutions Inc, Kuraray Co Ltd, CPL Activated Carbons, Evoqua Water Technologies LLC, Cabot Corporation, Kureha Corporation, Ingevity, Silcarbon Aktivkohle GmbH, Haycarb (Pvt ) Ltd, Puragen Activated Carbons, Jacobi Carbons Group, Albemarle Corporation, Veolia (Veolia Water Technologies)*List Not Exhaustive.
3. What are the main segments of the Activated Carbon Market?
The market segments include Product Type, Application, End-user Industry.
4. Can you provide details about the market size?
The market size is estimated to be USD 4.32 Million as of 2022.
5. What are some drivers contributing to market growth?
Conformance to Stringent Environmental Regulations in Water Treatment Applications in the United States; Augmenting Prominence for Air Pollution Control (Especially Mercury Removal).
6. What are the notable trends driving market growth?
Water Treatment Industry to Dominate the Market.
7. Are there any restraints impacting market growth?
Narrower Markets Due to Increased Costs of Some Grades of Activated Carbon; Threat of Substitutes Like Silica Gel and Development of Better Alternatives.
8. Can you provide examples of recent developments in the market?
March 2022: Cabot Corporation sold off its activated carbon unit, Norit Activated Carbon, to One Equity Partners. Following the divestiture, Norit Activated Carbon became an independent company serving its customers with a broad portfolio of activated carbon solutions through its ten production facilities in seven countries.
9. What pricing options are available for accessing the report?
Pricing options include single-user, multi-user, and enterprise licenses priced at USD 4750, USD 5250, and USD 8750 respectively.
10. Is the market size provided in terms of value or volume?
The market size is provided in terms of value, measured in Million.
11. Are there any specific market keywords associated with the report?
Yes, the market keyword associated with the report is "Activated Carbon Market," which aids in identifying and referencing the specific market segment covered.
12. How do I determine which pricing option suits my needs best?
The pricing options vary based on user requirements and access needs. Individual users may opt for single-user licenses, while businesses requiring broader access may choose multi-user or enterprise licenses for cost-effective access to the report.
13. Are there any additional resources or data provided in the Activated Carbon Market report?
While the report offers comprehensive insights, it's advisable to review the specific contents or supplementary materials provided to ascertain if additional resources or data are available.
14. How can I stay updated on further developments or reports in the Activated Carbon Market?
To stay informed about further developments, trends, and reports in the Activated Carbon Market, consider subscribing to industry newsletters, following relevant companies and organizations, or regularly checking reputable industry news sources and publications.
Methodology
Step 1 - Identification of Relevant Samples Size from Population Database


Step 2 - Approaches for Defining Global Market Size (Value, Volume* & Price*)

Note*: In applicable scenarios
Step 3 - Data Sources
Primary Research
- Web Analytics
- Survey Reports
- Research Institute
- Latest Research Reports
- Opinion Leaders
Secondary Research
- Annual Reports
- White Paper
- Latest Press Release
- Industry Association
- Paid Database
- Investor Presentations

Step 4 - Data Triangulation
Involves using different sources of information in order to increase the validity of a study
These sources are likely to be stakeholders in a program - participants, other researchers, program staff, other community members, and so on.
Then we put all data in single framework & apply various statistical tools to find out the dynamic on the market.
During the analysis stage, feedback from the stakeholder groups would be compared to determine areas of agreement as well as areas of divergence