

Key Insights
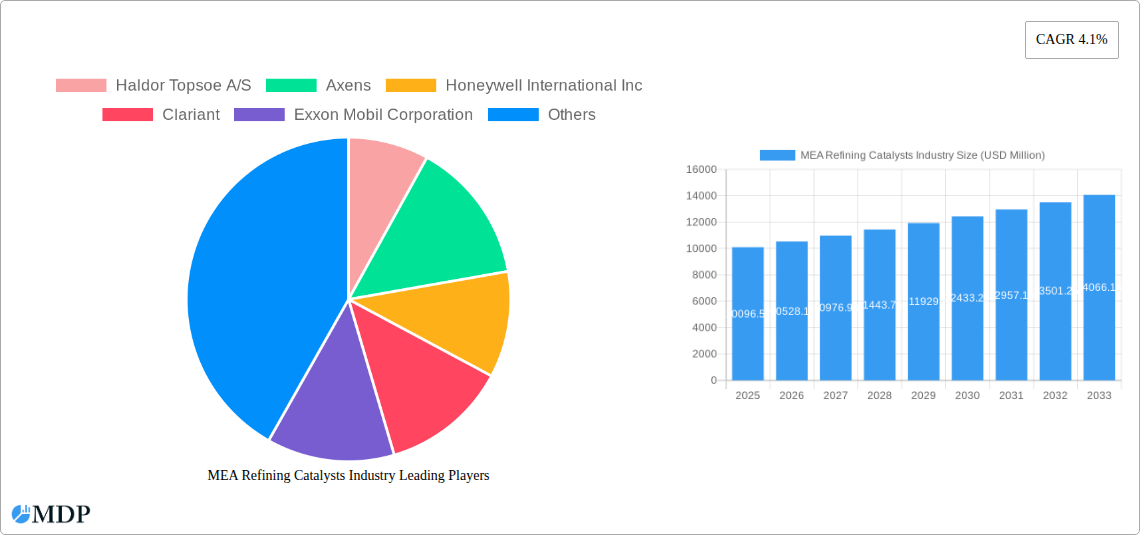
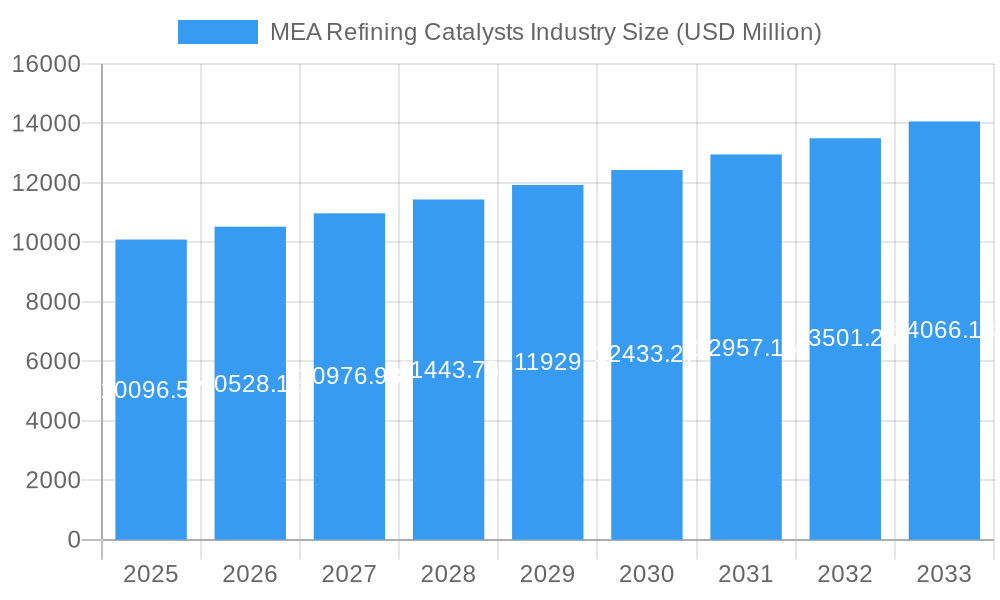
The Middle East and Africa (MEA) Refining Catalysts Industry is poised for significant growth, driven by increasing demand for refined petroleum products and the strategic importance of upgrading crude oil quality. The market is projected to reach USD 10,096.57 million by 2025, with a robust Compound Annual Growth Rate (CAGR) of 4.3% anticipated throughout the forecast period from 2025 to 2033. This expansion is underpinned by substantial investments in refining capacity across the region, particularly in countries like Saudi Arabia, the UAE, and Kuwait, which are keen to maximize the value of their hydrocarbon reserves. The demand for advanced refining catalysts is also being fueled by stringent environmental regulations that necessitate cleaner fuel production, pushing refineries to adopt more efficient and sophisticated catalytic processes. Furthermore, the ongoing efforts to diversify economies away from crude oil exports are indirectly supporting the refining sector's growth, as it forms a crucial part of the downstream value chain.
MEA Refining Catalysts Industry Market Size (In Billion)
Key growth drivers for the MEA Refining Catalysts Industry include the expansion and modernization of existing refineries, the construction of new integrated refining and petrochemical complexes, and the increasing emphasis on producing higher-value refined products such as gasoline, diesel, and jet fuel. Trends such as the rising adoption of Fluid Catalytic Cracking (FCC) catalysts for maximizing gasoline production, alongside the growing use of hydrotreating catalysts to meet sulfur content mandates, are shaping market dynamics. While the market benefits from strong regional demand, potential restraints include the volatility of crude oil prices, which can impact refinery profitability and investment decisions, and the significant capital expenditure required for catalyst upgrades. Nonetheless, the strategic imperative for energy security and economic diversification within the MEA region ensures a sustained and positive outlook for refining catalysts.
MEA Refining Catalysts Industry Company Market Share
The Middle East and Africa (MEA) refining catalysts industry is characterized by a moderate to high market concentration, with a few dominant global players holding significant market share. Key innovators such as Haldor Topsoe A/S, Honeywell International Inc, Clariant, W R Grace & Co -Conn, BASF SE, and Albemarle Corporation are at the forefront of developing advanced catalyst technologies. These companies are driven by the ever-increasing demand for cleaner fuels, stricter environmental regulations, and the need for enhanced refinery efficiency. Regulatory frameworks, particularly those focused on emissions reduction and fuel quality standards across key MEA nations like Saudi Arabia, Kuwait, and the UAE, significantly influence market dynamics.
Product substitutes, while present in the form of alternative refining processes or catalyst regeneration techniques, are often limited in their ability to match the performance and cost-effectiveness of specialized catalysts. End-user trends are heavily influenced by the region's vast crude oil reserves and its ambition to become a global refining hub. This translates into a strong demand for catalysts used in Fluid Catalytic Cracking (FCC), Hydrotreating, Hydrocracking, and Reforming processes. Merger and acquisition (M&A) activities, while not as frenzied as in some other industrial sectors, are strategic moves to consolidate market presence, acquire new technologies, and expand geographical reach. For instance, the historical period witnessed approximately 5-10 significant M&A deals focused on expanding technological portfolios or market access within the MEA region.
MEA Refining Catalysts Industry Industry Trends & Analysis
The MEA refining catalysts industry is projected to experience robust growth, driven by several interconnected trends that are reshaping the refining landscape. A primary growth driver is the continuous escalation in demand for cleaner transportation fuels, propelled by stringent environmental regulations enacted by governments across Saudi Arabia, Kuwait, Qatar, Nigeria, and the United Arab Emirates. These regulations mandate lower sulfur content in gasoline and diesel, necessitating the use of advanced Hydrotreating Catalysts and Fluid Catalytic Cracking (FCC) Catalysts with superior desulfurization capabilities. Furthermore, the region's strategic focus on increasing its refining capacity to meet both domestic energy needs and export demands fuels the adoption of high-performance catalysts.
Technological disruptions are playing a pivotal role, with significant investments being poured into research and development by leading companies like Axens, Exxon Mobil Corporation, Evonik Industries AG, DuPont, and Johnson Matthey. Innovations are centered around catalysts that offer higher activity, selectivity, and longer lifespans, thereby reducing operational costs and improving yield. The development of Zeolite-based catalysts and those incorporating advanced Metal and Chemical Compounds are key areas of focus for FCC and hydroprocessing applications. Consumer preferences, though indirectly influencing the catalyst market, are shaped by the availability of high-quality fuels at competitive prices, which in turn is dependent on efficient refining operations enabled by advanced catalysts.
The competitive dynamics within the MEA refining catalysts market are intense, characterized by both established global players and emerging regional contenders. Companies are vying for market share through product differentiation, strategic partnerships with national oil companies (NOCs), and localized technical support. The market penetration of advanced catalyst technologies is steadily increasing as refineries adopt newer, more efficient processes. The Compound Annual Growth Rate (CAGR) for the MEA refining catalysts market is estimated to be between 4.5% and 6.0% during the forecast period of 2025–2033, reflecting the sustained demand and technological evolution.
Leading Markets & Segments in MEA Refining Catalysts Industry
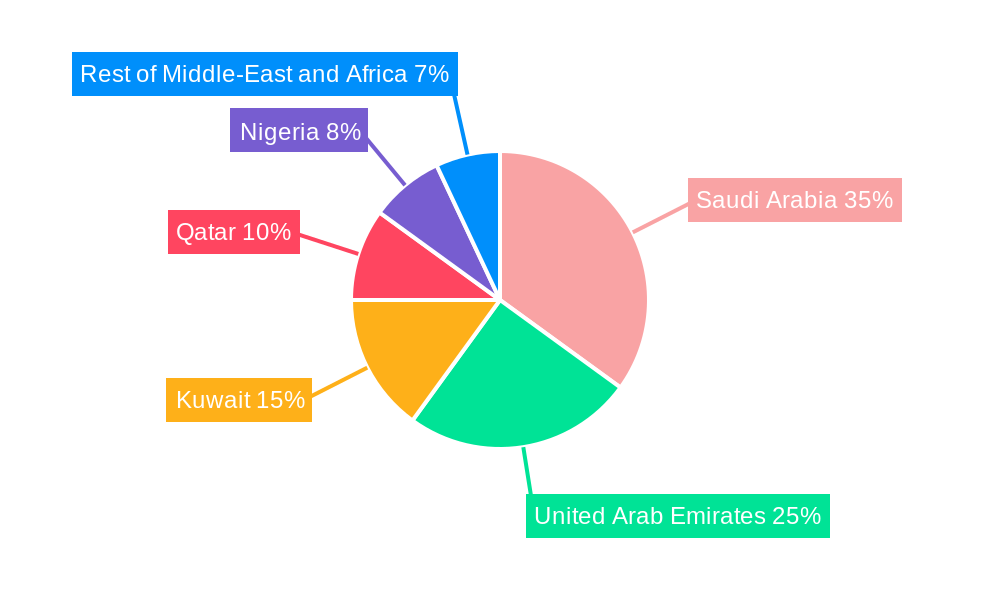
Saudi Arabia stands as the undisputed leading market within the MEA refining catalysts industry, accounting for an estimated 35-40% of the total regional market value. This dominance is underpinned by the Kingdom's colossal refining infrastructure, its strategic position as a global oil producer, and its ambitious Vision 2030 plan, which includes significant investments in downstream refining operations to diversify its economy and increase value addition from its hydrocarbon resources. The sheer scale of refining capacity in Saudi Arabia, with major players like Saudi Arabian Oil Co (Saudi Aramco) continually upgrading and expanding their facilities, creates an insatiable demand for a wide array of refining catalysts.
Geographically, the Rest of Middle-East and Africa segment, while diverse, collectively represents a significant and growing market, driven by the industrialization and increasing energy demands of various nations. However, within the core MEA region, Kuwait and the United Arab Emirates also represent substantial markets, with their well-established refining sectors and ongoing modernization efforts. Nigeria, as Africa's largest oil producer, presents a unique but growing opportunity, particularly as it seeks to enhance its domestic refining capabilities and reduce reliance on imported refined products.
In terms of catalyst types, Hydrotreating Catalysts and Fluid Catalytic Cracking (FCC) Catalysts are the most dominant segments, reflecting the widespread need for producing low-sulfur fuels and maximizing gasoline yields. The demand for Hydrocracking Catalysts is also on a significant upward trajectory as refineries aim to convert heavier crude fractions into lighter, higher-value products.
- Key Drivers of Dominance in Saudi Arabia:
- Massive Refining Capacity: Home to some of the world's largest and most technologically advanced refineries.
- Government Support for Downstream Expansion: Vision 2030 prioritizes increasing refining output and value addition.
- Strict Fuel Quality Standards: Mandates for low-sulfur fuels necessitate advanced hydrotreating and FCC catalysts.
- Technological Adoption: Continuous investment in upgrading existing facilities and building new ones with state-of-the-art technologies.
- Strategic Location: A key hub for exporting refined products to global markets.
The Zeolite ingredient segment plays a crucial role across these catalyst types, particularly in FCC applications, where its unique porous structure enables highly efficient cracking of hydrocarbons. The market for Metal-based catalysts, essential for hydroprocessing, is also substantial. While Chemical Compounds represent a broader category, specific advanced chemical formulations are critical for enhancing catalyst performance and selectivity in various refining processes.
MEA Refining Catalysts Industry Product Developments
The MEA refining catalysts industry is witnessing a continuous stream of product innovations aimed at enhancing efficiency, reducing emissions, and maximizing yields. Key developments include the introduction of next-generation Fluid Catalytic Cracking (FCC) Catalysts with superior resistance to deactivation and improved selectivity for light olefins, crucial for petrochemical feedstock. Advanced Hydrotreating Catalysts are being developed with higher activity and stability, enabling deeper desulfurization and denitrogenation of feedstocks to meet stringent fuel specifications. Furthermore, there is a growing focus on shape-selective zeolites and novel metal impregnation techniques to create catalysts with tailored pore structures and active sites, offering significant competitive advantages in specific refining applications. These advancements are directly aligned with the market's need for cost-effective and environmentally compliant refining solutions.
Key Drivers of MEA Refining Catalysts Industry Growth
The MEA refining catalysts industry's growth is propelled by a confluence of factors. Stringent environmental regulations mandating lower sulfur content in fuels are a primary catalyst, forcing refineries to adopt advanced hydrotreating and FCC catalysts. The growing demand for refined products, driven by population growth and industrialization across the region, necessitates increased refining capacity and higher catalyst throughput. Technological advancements by major players like BASF SE and Honeywell International Inc, leading to more efficient, selective, and longer-lasting catalysts, also contribute significantly by improving refinery economics. Moreover, the strategic investments by national oil companies in upgrading and expanding their refining infrastructure to diversify economies and increase value addition from crude oil are creating sustained demand for these critical catalysts.
Challenges in the MEA Refining Catalysts Industry Market
Despite the promising growth trajectory, the MEA refining catalysts industry faces several challenges. Fluctuations in crude oil prices can impact refinery investment decisions, indirectly affecting catalyst demand. Intense competition from a consolidated global market can put pressure on pricing and profit margins for local and smaller players. Supply chain disruptions, particularly for specialized raw materials and the logistics of delivering catalysts to remote refinery locations, can lead to delays and increased costs. Furthermore, evolving regulatory landscapes can sometimes outpace the development and adoption of new catalyst technologies, creating a lag in compliance.
Emerging Opportunities in MEA Refining Catalysts Industry
Emerging opportunities within the MEA refining catalysts industry are primarily centered around innovation and strategic expansion. The growing global emphasis on decarbonization presents opportunities for catalysts that facilitate cleaner refining processes, such as those enabling the production of blue hydrogen or efficient carbon capture technologies within refineries. The increasing demand for petrochemical feedstocks, driven by the region's diversification strategies, is creating a market for catalysts that optimize the production of olefins and other valuable byproducts. Strategic partnerships between global catalyst manufacturers and regional refineries offer significant potential for localized solutions, technology transfer, and market penetration. Furthermore, the development of regenerative catalyst technologies and catalyst recycling initiatives presents a sustainable growth avenue.
Leading Players in the MEA Refining Catalysts Industry Sector
- Haldor Topsoe A/S
- Axens
- Honeywell International Inc
- Clariant
- Exxon Mobil Corporation
- Evonik Industries AG
- W R Grace & Co -Conn
- BASF SE
- Chevron Corporation
- DuPont
- Saudi Arabian Oil Co
- JGC C & C
- Johnson Matthey
- Albemarle Corporation
Key Milestones in MEA Refining Catalysts Industry Industry
- 2019: Increased focus on advanced hydrotreating catalysts to meet stricter fuel sulfur regulations across the GCC.
- 2020: Introduction of novel zeolite formulations for FCC units to boost propylene and light olefin yields.
- 2021: Strategic partnerships formed between global catalyst providers and national oil companies for localized R&D and supply.
- 2022: Significant investment in catalyst regeneration technologies to enhance sustainability and reduce costs for refineries.
- 2023: Launch of catalysts with improved stability and activity for processing heavier and more challenging crude feedstocks.
- 2024: Expansion of refining capacity in key MEA nations, directly driving demand for a broad spectrum of refining catalysts.
Strategic Outlook for MEA Refining Catalysts Industry Market
The strategic outlook for the MEA refining catalysts industry is overwhelmingly positive, driven by the region's pivotal role in global energy markets and its commitment to refining modernization. Growth accelerators will include the continuous development of high-performance catalysts that address environmental compliance and operational efficiency. The increasing integration of petrochemical production with refining will create demand for specialized catalysts that optimize the yield of valuable intermediates. Furthermore, digitalization and AI-driven catalyst management systems are expected to enhance predictive maintenance and optimize catalyst performance, presenting a strategic opportunity for service providers. Strategic collaborations and the adoption of sustainable catalyst solutions will be crucial for long-term success and market leadership in this dynamic sector.
MEA Refining Catalysts Industry Segmentation
-
1. Ingredient
- 1.1. Zeolite
- 1.2. Metal
- 1.3. Chemical Compounds
-
2. Type
- 2.1. Fluid Catalytic Cracking Catalysts
- 2.2. Reforming Catalysts
- 2.3. Hydrotreating Catalysts
- 2.4. Hydrocracking Catalysts
- 2.5. Isomerization Catalysts
- 2.6. Alkylation Catalysts
-
3. Geography
- 3.1. Saudi Arabia
- 3.2. Kuwait
- 3.3. Qatar
- 3.4. Nigeria
- 3.5. United Arab Emirates
- 3.6. Rest of Middle-East and Africa
MEA Refining Catalysts Industry Segmentation By Geography
- 1. Saudi Arabia
- 2. Kuwait
- 3. Qatar
- 4. Nigeria
- 5. United Arab Emirates
- 6. Rest of Middle East and Africa
MEA Refining Catalysts Industry Regional Market Share
Geographic Coverage of MEA Refining Catalysts Industry
MEA Refining Catalysts Industry REPORT HIGHLIGHTS
| Aspects | Details |
|---|---|
| Study Period | 2020-2034 |
| Base Year | 2025 |
| Estimated Year | 2026 |
| Forecast Period | 2026-2034 |
| Historical Period | 2020-2025 |
| Growth Rate | CAGR of 5.85% from 2020-2034 |
| Segmentation |
|
Table of Contents
- 1. Introduction
- 1.1. Research Scope
- 1.2. Market Segmentation
- 1.3. Research Objective
- 1.4. Definitions and Assumptions
- 2. Executive Summary
- 2.1. Market Snapshot
- 3. Market Dynamics
- 3.1. Market Drivers
- 3.2. Market Restrains
- 3.3. Market Trends
- 3.4. Market Opportunities
- 4. Market Factor Analysis
- 4.1. Porters Five Forces
- 4.1.1. Bargaining Power of Suppliers
- 4.1.2. Bargaining Power of Buyers
- 4.1.3. Threat of New Entrants
- 4.1.4. Threat of Substitutes
- 4.1.5. Competitive Rivalry
- 4.2. PESTEL analysis
- 4.3. BCG Analysis
- 4.3.1. Stars (High Growth, High Market Share)
- 4.3.2. Cash Cows (Low Growth, High Market Share)
- 4.3.3. Question Mark (High Growth, Low Market Share)
- 4.3.4. Dogs (Low Growth, Low Market Share)
- 4.4. Ansoff Matrix Analysis
- 4.5. Supply Chain Analysis
- 4.6. Regulatory Landscape
- 4.7. Current Market Potential and Opportunity Assessment (TAM–SAM–SOM Framework)
- 4.8. MDP Analyst Note
- 4.1. Porters Five Forces
- 5. Market Analysis, Insights and Forecast 2021-2033
- 5.1. Market Analysis, Insights and Forecast - by Ingredient
- 5.1.1. Zeolite
- 5.1.2. Metal
- 5.1.3. Chemical Compounds
- 5.2. Market Analysis, Insights and Forecast - by Type
- 5.2.1. Fluid Catalytic Cracking Catalysts
- 5.2.2. Reforming Catalysts
- 5.2.3. Hydrotreating Catalysts
- 5.2.4. Hydrocracking Catalysts
- 5.2.5. Isomerization Catalysts
- 5.2.6. Alkylation Catalysts
- 5.3. Market Analysis, Insights and Forecast - by Geography
- 5.3.1. Saudi Arabia
- 5.3.2. Kuwait
- 5.3.3. Qatar
- 5.3.4. Nigeria
- 5.3.5. United Arab Emirates
- 5.3.6. Rest of Middle-East and Africa
- 5.4. Market Analysis, Insights and Forecast - by Region
- 5.4.1. Saudi Arabia
- 5.4.2. Kuwait
- 5.4.3. Qatar
- 5.4.4. Nigeria
- 5.4.5. United Arab Emirates
- 5.4.6. Rest of Middle East and Africa
- 5.1. Market Analysis, Insights and Forecast - by Ingredient
- 6. MEA Refining Catalysts Industry Analysis, Insights and Forecast, 2021-2033
- 6.1. Market Analysis, Insights and Forecast - by Ingredient
- 6.1.1. Zeolite
- 6.1.2. Metal
- 6.1.3. Chemical Compounds
- 6.2. Market Analysis, Insights and Forecast - by Type
- 6.2.1. Fluid Catalytic Cracking Catalysts
- 6.2.2. Reforming Catalysts
- 6.2.3. Hydrotreating Catalysts
- 6.2.4. Hydrocracking Catalysts
- 6.2.5. Isomerization Catalysts
- 6.2.6. Alkylation Catalysts
- 6.3. Market Analysis, Insights and Forecast - by Geography
- 6.3.1. Saudi Arabia
- 6.3.2. Kuwait
- 6.3.3. Qatar
- 6.3.4. Nigeria
- 6.3.5. United Arab Emirates
- 6.3.6. Rest of Middle-East and Africa
- 6.1. Market Analysis, Insights and Forecast - by Ingredient
- 7. Saudi Arabia MEA Refining Catalysts Industry Analysis, Insights and Forecast, 2020-2032
- 7.1. Market Analysis, Insights and Forecast - by Ingredient
- 7.1.1. Zeolite
- 7.1.2. Metal
- 7.1.3. Chemical Compounds
- 7.2. Market Analysis, Insights and Forecast - by Type
- 7.2.1. Fluid Catalytic Cracking Catalysts
- 7.2.2. Reforming Catalysts
- 7.2.3. Hydrotreating Catalysts
- 7.2.4. Hydrocracking Catalysts
- 7.2.5. Isomerization Catalysts
- 7.2.6. Alkylation Catalysts
- 7.3. Market Analysis, Insights and Forecast - by Geography
- 7.3.1. Saudi Arabia
- 7.3.2. Kuwait
- 7.3.3. Qatar
- 7.3.4. Nigeria
- 7.3.5. United Arab Emirates
- 7.3.6. Rest of Middle-East and Africa
- 7.1. Market Analysis, Insights and Forecast - by Ingredient
- 8. Kuwait MEA Refining Catalysts Industry Analysis, Insights and Forecast, 2020-2032
- 8.1. Market Analysis, Insights and Forecast - by Ingredient
- 8.1.1. Zeolite
- 8.1.2. Metal
- 8.1.3. Chemical Compounds
- 8.2. Market Analysis, Insights and Forecast - by Type
- 8.2.1. Fluid Catalytic Cracking Catalysts
- 8.2.2. Reforming Catalysts
- 8.2.3. Hydrotreating Catalysts
- 8.2.4. Hydrocracking Catalysts
- 8.2.5. Isomerization Catalysts
- 8.2.6. Alkylation Catalysts
- 8.3. Market Analysis, Insights and Forecast - by Geography
- 8.3.1. Saudi Arabia
- 8.3.2. Kuwait
- 8.3.3. Qatar
- 8.3.4. Nigeria
- 8.3.5. United Arab Emirates
- 8.3.6. Rest of Middle-East and Africa
- 8.1. Market Analysis, Insights and Forecast - by Ingredient
- 9. Qatar MEA Refining Catalysts Industry Analysis, Insights and Forecast, 2020-2032
- 9.1. Market Analysis, Insights and Forecast - by Ingredient
- 9.1.1. Zeolite
- 9.1.2. Metal
- 9.1.3. Chemical Compounds
- 9.2. Market Analysis, Insights and Forecast - by Type
- 9.2.1. Fluid Catalytic Cracking Catalysts
- 9.2.2. Reforming Catalysts
- 9.2.3. Hydrotreating Catalysts
- 9.2.4. Hydrocracking Catalysts
- 9.2.5. Isomerization Catalysts
- 9.2.6. Alkylation Catalysts
- 9.3. Market Analysis, Insights and Forecast - by Geography
- 9.3.1. Saudi Arabia
- 9.3.2. Kuwait
- 9.3.3. Qatar
- 9.3.4. Nigeria
- 9.3.5. United Arab Emirates
- 9.3.6. Rest of Middle-East and Africa
- 9.1. Market Analysis, Insights and Forecast - by Ingredient
- 10. Nigeria MEA Refining Catalysts Industry Analysis, Insights and Forecast, 2020-2032
- 10.1. Market Analysis, Insights and Forecast - by Ingredient
- 10.1.1. Zeolite
- 10.1.2. Metal
- 10.1.3. Chemical Compounds
- 10.2. Market Analysis, Insights and Forecast - by Type
- 10.2.1. Fluid Catalytic Cracking Catalysts
- 10.2.2. Reforming Catalysts
- 10.2.3. Hydrotreating Catalysts
- 10.2.4. Hydrocracking Catalysts
- 10.2.5. Isomerization Catalysts
- 10.2.6. Alkylation Catalysts
- 10.3. Market Analysis, Insights and Forecast - by Geography
- 10.3.1. Saudi Arabia
- 10.3.2. Kuwait
- 10.3.3. Qatar
- 10.3.4. Nigeria
- 10.3.5. United Arab Emirates
- 10.3.6. Rest of Middle-East and Africa
- 10.1. Market Analysis, Insights and Forecast - by Ingredient
- 11. United Arab Emirates MEA Refining Catalysts Industry Analysis, Insights and Forecast, 2020-2032
- 11.1. Market Analysis, Insights and Forecast - by Ingredient
- 11.1.1. Zeolite
- 11.1.2. Metal
- 11.1.3. Chemical Compounds
- 11.2. Market Analysis, Insights and Forecast - by Type
- 11.2.1. Fluid Catalytic Cracking Catalysts
- 11.2.2. Reforming Catalysts
- 11.2.3. Hydrotreating Catalysts
- 11.2.4. Hydrocracking Catalysts
- 11.2.5. Isomerization Catalysts
- 11.2.6. Alkylation Catalysts
- 11.3. Market Analysis, Insights and Forecast - by Geography
- 11.3.1. Saudi Arabia
- 11.3.2. Kuwait
- 11.3.3. Qatar
- 11.3.4. Nigeria
- 11.3.5. United Arab Emirates
- 11.3.6. Rest of Middle-East and Africa
- 11.1. Market Analysis, Insights and Forecast - by Ingredient
- 12. Rest of Middle East and Africa MEA Refining Catalysts Industry Analysis, Insights and Forecast, 2020-2032
- 12.1. Market Analysis, Insights and Forecast - by Ingredient
- 12.1.1. Zeolite
- 12.1.2. Metal
- 12.1.3. Chemical Compounds
- 12.2. Market Analysis, Insights and Forecast - by Type
- 12.2.1. Fluid Catalytic Cracking Catalysts
- 12.2.2. Reforming Catalysts
- 12.2.3. Hydrotreating Catalysts
- 12.2.4. Hydrocracking Catalysts
- 12.2.5. Isomerization Catalysts
- 12.2.6. Alkylation Catalysts
- 12.3. Market Analysis, Insights and Forecast - by Geography
- 12.3.1. Saudi Arabia
- 12.3.2. Kuwait
- 12.3.3. Qatar
- 12.3.4. Nigeria
- 12.3.5. United Arab Emirates
- 12.3.6. Rest of Middle-East and Africa
- 12.1. Market Analysis, Insights and Forecast - by Ingredient
- 13. Competitive Analysis
- 13.1. Company Profiles
- 13.1.1 Haldor Topsoe A/S
- 13.1.1.1. Company Overview
- 13.1.1.2. Products
- 13.1.1.3. Company Financials
- 13.1.1.4. SWOT Analysis
- 13.1.2 Axens
- 13.1.2.1. Company Overview
- 13.1.2.2. Products
- 13.1.2.3. Company Financials
- 13.1.2.4. SWOT Analysis
- 13.1.3 Honeywell International Inc
- 13.1.3.1. Company Overview
- 13.1.3.2. Products
- 13.1.3.3. Company Financials
- 13.1.3.4. SWOT Analysis
- 13.1.4 Clariant
- 13.1.4.1. Company Overview
- 13.1.4.2. Products
- 13.1.4.3. Company Financials
- 13.1.4.4. SWOT Analysis
- 13.1.5 Exxon Mobil Corporation
- 13.1.5.1. Company Overview
- 13.1.5.2. Products
- 13.1.5.3. Company Financials
- 13.1.5.4. SWOT Analysis
- 13.1.6 Evonik Industries AG
- 13.1.6.1. Company Overview
- 13.1.6.2. Products
- 13.1.6.3. Company Financials
- 13.1.6.4. SWOT Analysis
- 13.1.7 W R Grace & Co -Conn
- 13.1.7.1. Company Overview
- 13.1.7.2. Products
- 13.1.7.3. Company Financials
- 13.1.7.4. SWOT Analysis
- 13.1.8 BASF SE
- 13.1.8.1. Company Overview
- 13.1.8.2. Products
- 13.1.8.3. Company Financials
- 13.1.8.4. SWOT Analysis
- 13.1.9 Chevron Corporation
- 13.1.9.1. Company Overview
- 13.1.9.2. Products
- 13.1.9.3. Company Financials
- 13.1.9.4. SWOT Analysis
- 13.1.10 DuPont
- 13.1.10.1. Company Overview
- 13.1.10.2. Products
- 13.1.10.3. Company Financials
- 13.1.10.4. SWOT Analysis
- 13.1.11 Saudi Arabian Oil Co
- 13.1.11.1. Company Overview
- 13.1.11.2. Products
- 13.1.11.3. Company Financials
- 13.1.11.4. SWOT Analysis
- 13.1.12 JGC C & C
- 13.1.12.1. Company Overview
- 13.1.12.2. Products
- 13.1.12.3. Company Financials
- 13.1.12.4. SWOT Analysis
- 13.1.13 Johnson Matthey
- 13.1.13.1. Company Overview
- 13.1.13.2. Products
- 13.1.13.3. Company Financials
- 13.1.13.4. SWOT Analysis
- 13.1.14 Albemarle Corporation
- 13.1.14.1. Company Overview
- 13.1.14.2. Products
- 13.1.14.3. Company Financials
- 13.1.14.4. SWOT Analysis
- 13.1.1 Haldor Topsoe A/S
- 13.2. Market Entropy
- 13.2.1 Company's Key Areas Served
- 13.2.2 Recent Developments
- 13.3. Company Market Share Analysis 2025
- 13.3.1 Top 5 Companies Market Share Analysis
- 13.3.2 Top 3 Companies Market Share Analysis
- 13.4. List of Potential Customers
- 14. Research Methodology
List of Figures
- Figure 1: MEA Refining Catalysts Industry Revenue Breakdown (billion, %) by Product 2025 & 2033
- Figure 2: MEA Refining Catalysts Industry Share (%) by Company 2025
List of Tables
- Table 1: MEA Refining Catalysts Industry Revenue billion Forecast, by Ingredient 2020 & 2033
- Table 2: MEA Refining Catalysts Industry Volume K Tons Forecast, by Ingredient 2020 & 2033
- Table 3: MEA Refining Catalysts Industry Revenue billion Forecast, by Type 2020 & 2033
- Table 4: MEA Refining Catalysts Industry Volume K Tons Forecast, by Type 2020 & 2033
- Table 5: MEA Refining Catalysts Industry Revenue billion Forecast, by Geography 2020 & 2033
- Table 6: MEA Refining Catalysts Industry Volume K Tons Forecast, by Geography 2020 & 2033
- Table 7: MEA Refining Catalysts Industry Revenue billion Forecast, by Region 2020 & 2033
- Table 8: MEA Refining Catalysts Industry Volume K Tons Forecast, by Region 2020 & 2033
- Table 9: MEA Refining Catalysts Industry Revenue billion Forecast, by Ingredient 2020 & 2033
- Table 10: MEA Refining Catalysts Industry Volume K Tons Forecast, by Ingredient 2020 & 2033
- Table 11: MEA Refining Catalysts Industry Revenue billion Forecast, by Type 2020 & 2033
- Table 12: MEA Refining Catalysts Industry Volume K Tons Forecast, by Type 2020 & 2033
- Table 13: MEA Refining Catalysts Industry Revenue billion Forecast, by Geography 2020 & 2033
- Table 14: MEA Refining Catalysts Industry Volume K Tons Forecast, by Geography 2020 & 2033
- Table 15: MEA Refining Catalysts Industry Revenue billion Forecast, by Country 2020 & 2033
- Table 16: MEA Refining Catalysts Industry Volume K Tons Forecast, by Country 2020 & 2033
- Table 17: MEA Refining Catalysts Industry Revenue billion Forecast, by Ingredient 2020 & 2033
- Table 18: MEA Refining Catalysts Industry Volume K Tons Forecast, by Ingredient 2020 & 2033
- Table 19: MEA Refining Catalysts Industry Revenue billion Forecast, by Type 2020 & 2033
- Table 20: MEA Refining Catalysts Industry Volume K Tons Forecast, by Type 2020 & 2033
- Table 21: MEA Refining Catalysts Industry Revenue billion Forecast, by Geography 2020 & 2033
- Table 22: MEA Refining Catalysts Industry Volume K Tons Forecast, by Geography 2020 & 2033
- Table 23: MEA Refining Catalysts Industry Revenue billion Forecast, by Country 2020 & 2033
- Table 24: MEA Refining Catalysts Industry Volume K Tons Forecast, by Country 2020 & 2033
- Table 25: MEA Refining Catalysts Industry Revenue billion Forecast, by Ingredient 2020 & 2033
- Table 26: MEA Refining Catalysts Industry Volume K Tons Forecast, by Ingredient 2020 & 2033
- Table 27: MEA Refining Catalysts Industry Revenue billion Forecast, by Type 2020 & 2033
- Table 28: MEA Refining Catalysts Industry Volume K Tons Forecast, by Type 2020 & 2033
- Table 29: MEA Refining Catalysts Industry Revenue billion Forecast, by Geography 2020 & 2033
- Table 30: MEA Refining Catalysts Industry Volume K Tons Forecast, by Geography 2020 & 2033
- Table 31: MEA Refining Catalysts Industry Revenue billion Forecast, by Country 2020 & 2033
- Table 32: MEA Refining Catalysts Industry Volume K Tons Forecast, by Country 2020 & 2033
- Table 33: MEA Refining Catalysts Industry Revenue billion Forecast, by Ingredient 2020 & 2033
- Table 34: MEA Refining Catalysts Industry Volume K Tons Forecast, by Ingredient 2020 & 2033
- Table 35: MEA Refining Catalysts Industry Revenue billion Forecast, by Type 2020 & 2033
- Table 36: MEA Refining Catalysts Industry Volume K Tons Forecast, by Type 2020 & 2033
- Table 37: MEA Refining Catalysts Industry Revenue billion Forecast, by Geography 2020 & 2033
- Table 38: MEA Refining Catalysts Industry Volume K Tons Forecast, by Geography 2020 & 2033
- Table 39: MEA Refining Catalysts Industry Revenue billion Forecast, by Country 2020 & 2033
- Table 40: MEA Refining Catalysts Industry Volume K Tons Forecast, by Country 2020 & 2033
- Table 41: MEA Refining Catalysts Industry Revenue billion Forecast, by Ingredient 2020 & 2033
- Table 42: MEA Refining Catalysts Industry Volume K Tons Forecast, by Ingredient 2020 & 2033
- Table 43: MEA Refining Catalysts Industry Revenue billion Forecast, by Type 2020 & 2033
- Table 44: MEA Refining Catalysts Industry Volume K Tons Forecast, by Type 2020 & 2033
- Table 45: MEA Refining Catalysts Industry Revenue billion Forecast, by Geography 2020 & 2033
- Table 46: MEA Refining Catalysts Industry Volume K Tons Forecast, by Geography 2020 & 2033
- Table 47: MEA Refining Catalysts Industry Revenue billion Forecast, by Country 2020 & 2033
- Table 48: MEA Refining Catalysts Industry Volume K Tons Forecast, by Country 2020 & 2033
- Table 49: MEA Refining Catalysts Industry Revenue billion Forecast, by Ingredient 2020 & 2033
- Table 50: MEA Refining Catalysts Industry Volume K Tons Forecast, by Ingredient 2020 & 2033
- Table 51: MEA Refining Catalysts Industry Revenue billion Forecast, by Type 2020 & 2033
- Table 52: MEA Refining Catalysts Industry Volume K Tons Forecast, by Type 2020 & 2033
- Table 53: MEA Refining Catalysts Industry Revenue billion Forecast, by Geography 2020 & 2033
- Table 54: MEA Refining Catalysts Industry Volume K Tons Forecast, by Geography 2020 & 2033
- Table 55: MEA Refining Catalysts Industry Revenue billion Forecast, by Country 2020 & 2033
- Table 56: MEA Refining Catalysts Industry Volume K Tons Forecast, by Country 2020 & 2033
Frequently Asked Questions
1. What is the projected Compound Annual Growth Rate (CAGR) of the MEA Refining Catalysts Industry?
The projected CAGR is approximately 5.85%.
2. Which companies are prominent players in the MEA Refining Catalysts Industry?
Key companies in the market include Haldor Topsoe A/S, Axens, Honeywell International Inc, Clariant, Exxon Mobil Corporation, Evonik Industries AG, W R Grace & Co -Conn, BASF SE, Chevron Corporation, DuPont, Saudi Arabian Oil Co, JGC C & C, Johnson Matthey, Albemarle Corporation.
3. What are the main segments of the MEA Refining Catalysts Industry?
The market segments include Ingredient, Type, Geography.
4. Can you provide details about the market size?
The market size is estimated to be USD 1.2 billion as of 2022.
5. What are some drivers contributing to market growth?
; Accelerating Demand For Higher Octane Fuels; Increasing Investments in Refineries.
6. What are the notable trends driving market growth?
Fluid Catalytic Cracking (FCC) Catalysts to Dominate the Market.
7. Are there any restraints impacting market growth?
; Volatility in Precious Metal Prices.
8. Can you provide examples of recent developments in the market?
N/A
9. What pricing options are available for accessing the report?
Pricing options include single-user, multi-user, and enterprise licenses priced at USD 3,950, USD 4,950, and USD 6,950 respectively.
10. Is the market size provided in terms of value or volume?
The market size is provided in terms of value, measured in billion and volume, measured in K Tons.
11. Are there any specific market keywords associated with the report?
Yes, the market keyword associated with the report is "MEA Refining Catalysts Industry," which aids in identifying and referencing the specific market segment covered.
12. How do I determine which pricing option suits my needs best?
The pricing options vary based on user requirements and access needs. Individual users may opt for single-user licenses, while businesses requiring broader access may choose multi-user or enterprise licenses for cost-effective access to the report.
13. Are there any additional resources or data provided in the MEA Refining Catalysts Industry report?
While the report offers comprehensive insights, it's advisable to review the specific contents or supplementary materials provided to ascertain if additional resources or data are available.
14. How can I stay updated on further developments or reports in the MEA Refining Catalysts Industry?
To stay informed about further developments, trends, and reports in the MEA Refining Catalysts Industry, consider subscribing to industry newsletters, following relevant companies and organizations, or regularly checking reputable industry news sources and publications.
Methodology
Step 1 - Identification of Relevant Samples Size from Population Database


Step 2 - Approaches for Defining Global Market Size (Value, Volume* & Price*)

Note*: In applicable scenarios
Step 3 - Data Sources
Primary Research
- Web Analytics
- Survey Reports
- Research Institute
- Latest Research Reports
- Opinion Leaders
Secondary Research
- Annual Reports
- White Paper
- Latest Press Release
- Industry Association
- Paid Database
- Investor Presentations

Step 4 - Data Triangulation
Involves using different sources of information in order to increase the validity of a study
These sources are likely to be stakeholders in a program - participants, other researchers, program staff, other community members, and so on.
Then we put all data in single framework & apply various statistical tools to find out the dynamic on the market.
During the analysis stage, feedback from the stakeholder groups would be compared to determine areas of agreement as well as areas of divergence