

Key Insights
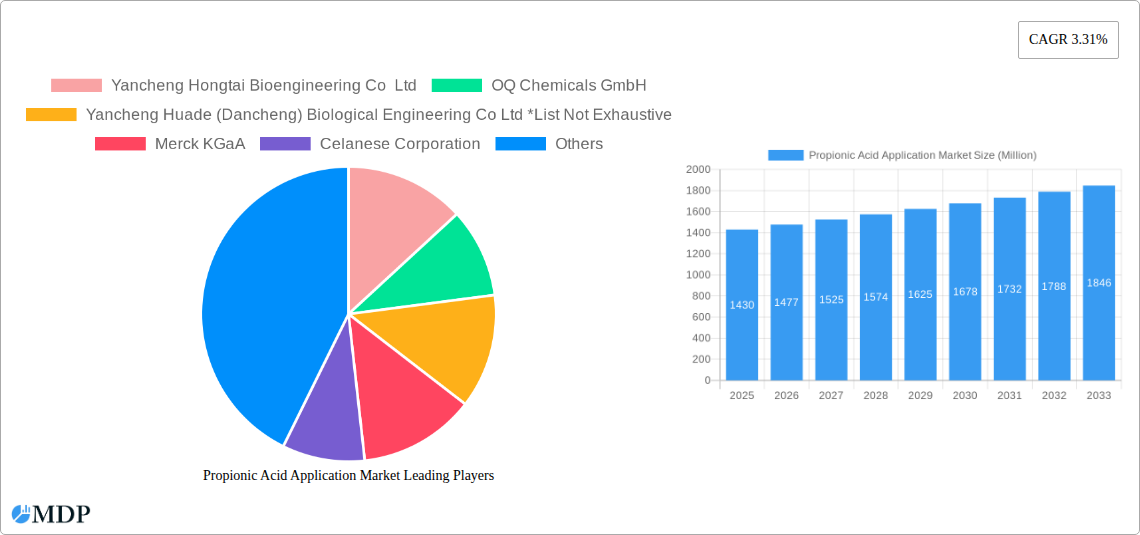
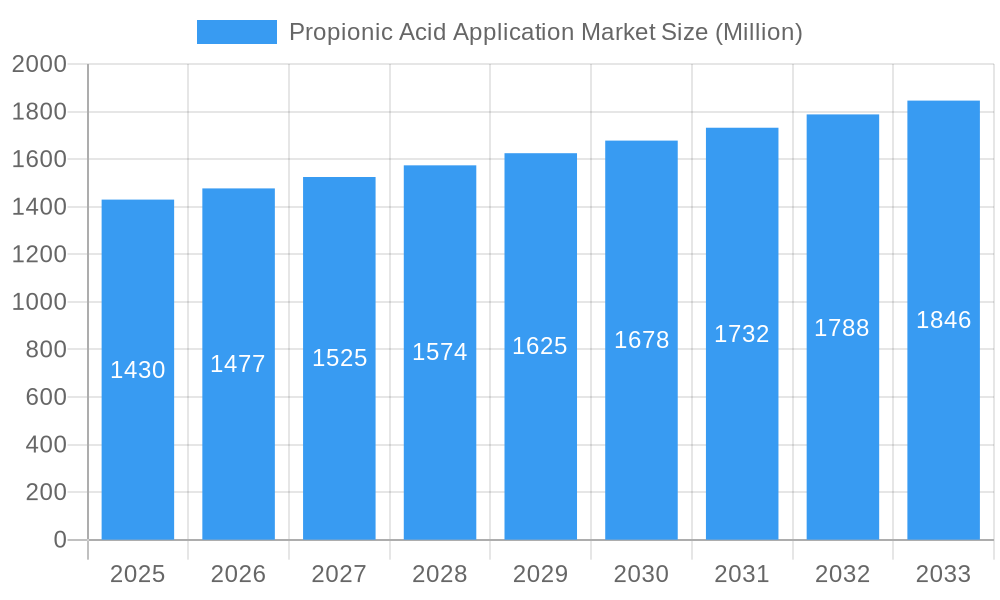
The global Propionic Acid Application Market is projected to reach an estimated $1.43 billion in 2025, demonstrating a robust compound annual growth rate (CAGR) of 3.3% through 2033. This steady expansion is fueled by a confluence of factors, with a significant driver being the increasing demand for its use as a preservative in animal feed and food products, crucial for extending shelf life and preventing spoilage. The versatile nature of propionic acid also contributes to its growth, finding applications in the production of cellulose acetate propionate, a key component in certain plastics and coatings, as well as its role in the synthesis of various chemical compounds like herbicides and plasticizers. Emerging applications within the pharmaceutical and personal care sectors are also anticipated to bolster market performance, reflecting a diversification of propionic acid's utility.
Propionic Acid Application Market Market Size (In Billion)
Despite its strong growth trajectory, the market faces certain headwinds. Potential restraints include the volatility of raw material prices, particularly for petrochemical feedstocks, which can impact production costs and pricing strategies for propionic acid manufacturers. Additionally, stringent regulatory frameworks surrounding the use of chemical additives in food and feed, while ensuring safety, can also present compliance challenges and necessitate ongoing research and development for product innovation. Nevertheless, the overarching trend of an expanding global population, coupled with a growing emphasis on food security and efficient agricultural practices, underpins a positive outlook for the propionic acid market. Key end-user industries such as agriculture, food and beverage, and pharmaceuticals are expected to drive future demand, with Asia Pacific poised to be a significant growth region due to its rapidly developing economies and substantial agricultural output.
Propionic Acid Application Market Company Market Share
Propionic Acid Application Market: A Comprehensive Analysis (2019-2033) - Driving Growth in Agriculture, Food, and Pharmaceuticals
Report Overview:
This in-depth analysis of the global Propionic Acid Application Market projects a robust growth trajectory, driven by increasing demand in animal feed, food preservation, and burgeoning applications across various industrial sectors. Valued at billions of dollars, the market is expected to witness a compound annual growth rate (CAGR) of xx% from 2025 to 2033. The report provides critical insights into market dynamics, key trends, leading segments, product developments, growth drivers, challenges, emerging opportunities, and the competitive landscape. With a study period encompassing historical data from 2019-2024 and a forecast period extending to 2033, this report serves as an indispensable resource for industry stakeholders seeking to capitalize on the evolving propionic acid market.
Propionic Acid Application Market Dynamics & Concentration
The global Propionic Acid Application Market is characterized by moderate to high concentration, with a few key players holding significant market share. Innovation drivers are primarily centered around developing more sustainable production methods, enhancing product purity for sensitive applications like pharmaceuticals, and expanding the utility of propionic acid derivatives. Regulatory frameworks, particularly concerning food safety and environmental impact, play a crucial role in shaping market entry and product development. Product substitutes, such as sorbic acid and sodium benzoate in food preservation, and alternative preservatives in animal feed, present a constant competitive pressure. End-user trends indicate a growing preference for natural and bio-based ingredients, which, while a challenge for traditional propionic acid production, also presents an opportunity for bio-fermentation-based propionic acid. Mergers and acquisitions (M&A) activities are moderately present, aimed at consolidating market presence, expanding product portfolios, and acquiring innovative technologies. The market share distribution is dynamic, with key players like BASF SE and Eastman Chemical Company continuously vying for leadership.
- Market Concentration: Moderate to High
- Key Innovation Drivers: Sustainable production, high purity grades, novel derivative applications.
- Regulatory Influence: Food safety standards (e.g., FDA, EFSA), environmental regulations.
- Product Substitutes: Sorbic acid, sodium benzoate, propionates from alternative sources.
- End-User Trends: Demand for natural and bio-based solutions, increased focus on efficacy and safety.
- M&A Activities: Strategic acquisitions for technology and market access.
- Estimated M&A Deal Count (2019-2024): xx
Propionic Acid Application Market Industry Trends & Analysis
The Propionic Acid Application Market is experiencing significant growth, propelled by several intersecting industry trends and technological advancements. A primary growth driver is the escalating demand for propionic acid and its salts as effective preservatives in animal feed, safeguarding against mold and extending shelf life, which in turn enhances livestock health and productivity. The global livestock industry's expansion, particularly in emerging economies, directly fuels this segment. Simultaneously, the food and beverage industry continues to leverage propionic acid and its derivatives for their potent antifungal properties, extending the shelf life of baked goods, dairy products, and processed foods, thereby reducing food waste and meeting consumer demands for longer-lasting products.
Technological disruptions are also shaping the market. Advancements in fermentation technologies are enabling more sustainable and cost-effective production of propionic acid from renewable feedstocks, aligning with the growing environmental consciousness of consumers and manufacturers. This shift towards bio-based propionic acid is a significant trend, potentially disrupting traditional petrochemical-based production. Consumer preferences are increasingly leaning towards products with cleaner labels and minimal artificial additives. While propionic acid is a recognized and approved preservative, there is a growing interest in its bio-derived counterparts. The pharmaceutical sector is also exploring new applications for propionic acid derivatives in drug synthesis and formulation, contributing to market expansion.
Competitive dynamics are intensifying, with established chemical giants investing in R&D to optimize production processes and develop high-value propionic acid derivatives. The market penetration of propionic acid is expected to deepen across various applications due to its proven efficacy and cost-effectiveness. The forecast CAGR of xx% from 2025 to 2033 underscores the robust market expansion anticipated. The market value, currently in the billions, is projected to reach significantly higher figures by 2033, driven by both volume growth and value-added product development. The interplay of these factors – robust demand from core applications, technological innovation, shifting consumer preferences, and strategic investments by leading players – is setting a strong foundation for sustained growth in the propionic acid application market.
Leading Markets & Segments in Propionic Acid Application Market
The global Propionic Acid Application Market is segmented by application and end-user industry, with specific regions and countries exhibiting dominant consumption patterns.
Dominant Region & Key Markets:
North America and Europe currently lead the market, owing to well-established agriculture and food processing industries, coupled with stringent food safety regulations that necessitate effective preservation methods. The Asia Pacific region, however, is emerging as a high-growth market, driven by rapid industrialization, a burgeoning population, and increasing disposable incomes leading to higher consumption of processed foods and animal products. Countries like China and India are expected to be significant contributors to this growth.
- Key Drivers for Regional Dominance:
- Economic Policies: Supportive government policies for agriculture and food processing industries.
- Infrastructure: Advanced logistics and cold chain infrastructure enabling efficient distribution of processed goods and animal feed.
- Consumer Demand: Rising demand for preserved foods and meat products.
- Regulatory Landscape: Stringent food safety and animal health regulations mandating preservative use.
Dominant Segments by Application:
Animal Feed and Food Preservatives: This segment is the largest and fastest-growing, driven by the global demand for meat, dairy, and processed foods. Propionic acid and its salts are crucial for preventing spoilage, inhibiting mold growth, and extending the shelf life of these products, thereby reducing waste and ensuring food security. The livestock sector's growth, especially in developing economies, directly fuels this segment.
- Key Drivers for Dominance:
- Food Security Concerns: Need to preserve food and reduce spoilage.
- Livestock Health & Productivity: Ensuring the quality and safety of animal feed.
- Economic Viability: Cost-effectiveness of propionic acid as a preservative.
- Regulatory Approval: Widespread acceptance and approval by food safety authorities.
- Key Drivers for Dominance:
Calcium, Ammonium, and Sodium Salts: These salts are crucial derivatives, offering enhanced solubility and efficacy in various applications, particularly in animal feed and food preservation. Their widespread use underscores their importance in the market.
Cellulose Acetate Propionate (CAP): CAP finds applications in coatings, films, and plastics, contributing to the market's diversification. Growth in these niche areas, while smaller than traditional applications, adds to the overall market value.
Herbicides: Propionic acid derivatives are also utilized in certain herbicide formulations, contributing to the agricultural sector's demand.
Plasticizers: The use of propionic acid in plasticizers adds another dimension to its industrial applications.
Other Applications: This encompasses a range of niche uses in the pharmaceutical, personal care, and chemical synthesis industries, which are expected to see incremental growth.
Dominant Segments by End-user Industry:
Agriculture: This is the leading end-user industry, primarily through the demand for propionic acid in animal feed. The efficiency and health of livestock are directly impacted by the quality of feed, making propionic acid an indispensable additive.
- Key Drivers for Dominance:
- Global Meat Consumption: Rising demand for protein sources.
- Feed Efficiency Improvements: Enhancing the nutritional value and safety of animal feed.
- Disease Prevention: Inhibiting fungal and bacterial growth in feed.
- Key Drivers for Dominance:
Food and Beverage: This sector is the second-largest consumer, utilizing propionic acid for its exceptional mold and yeast inhibition properties in a wide array of food products, from baked goods to cheese. The ongoing trend of convenience foods and longer shelf-life expectations further bolsters this segment.
- Key Drivers for Dominance:
- Extended Shelf Life: Meeting consumer demand for durable products.
- Reduced Food Waste: Minimizing spoilage and economic losses.
- Product Quality: Maintaining the freshness and appeal of food items.
- Key Drivers for Dominance:
Personal Care: While a smaller segment, propionic acid and its derivatives are used in some cosmetic and personal care products for their antimicrobial properties.
Pharmaceutical: Emerging applications in pharmaceutical synthesis and drug formulation are contributing to the growth of this segment, offering potential for high-value products.
Other End-user Industries: This includes various chemical manufacturing and industrial applications, representing a diverse but growing demand base.
Propionic Acid Application Market Product Developments
Product development in the Propionic Acid Application Market is increasingly focused on enhancing sustainability and expanding application efficacy. Innovations are emerging in bio-fermentation processes, aiming to produce propionic acid from renewable resources, thereby reducing the carbon footprint and aligning with market demand for eco-friendly chemicals. Manufacturers are also developing high-purity grades of propionic acid for sensitive applications like pharmaceuticals and specialized food ingredients. Furthermore, research into novel propionic acid derivatives with improved functionalities, such as enhanced antimicrobial activity or specialized plasticizing capabilities, is ongoing. These developments aim to unlock new market opportunities and provide competitive advantages by offering tailored solutions to specific industry needs, driving market growth through value-added products.
Key Drivers of Propionic Acid Application Market Growth
The Propionic Acid Application Market is propelled by a confluence of critical growth drivers. The ever-increasing global demand for animal protein, leading to the expansion of the livestock industry, is a primary catalyst, driving the consumption of propionic acid as an essential animal feed preservative. Concurrently, the food and beverage sector's continuous need for effective mold and yeast inhibitors to extend product shelf life and combat food waste significantly contributes to market expansion. Regulatory approvals and the recognized efficacy of propionic acid and its salts in maintaining product safety and quality further bolster its market position. Emerging applications in the pharmaceutical and personal care industries, coupled with technological advancements in bio-based production, are creating new avenues for growth and diversification within the market, promising sustained upward momentum.
Challenges in the Propionic Acid Application Market Market
Despite its strong growth potential, the Propionic Acid Application Market faces several challenges. Fluctuations in raw material prices, particularly those derived from petrochemical feedstocks, can impact production costs and profitability. Increasing regulatory scrutiny and evolving environmental standards worldwide necessitate continuous investment in compliance and sustainable production methods. The development and adoption of alternative preservatives, though often less cost-effective or as broadly applicable, pose a competitive threat. Furthermore, supply chain disruptions, exacerbated by global events, can affect the availability and timely delivery of propionic acid, leading to potential production delays for end-users. Addressing these challenges through strategic sourcing, process optimization, and innovation is crucial for sustained market success.
Emerging Opportunities in Propionic Acid Application Market
The Propionic Acid Application Market is ripe with emerging opportunities, primarily driven by advancements in sustainable production and expanding niche applications. The growing consumer and industry demand for bio-based and environmentally friendly chemicals presents a significant opportunity for manufacturers leveraging fermentation technologies to produce propionic acid from renewable resources. This aligns with corporate sustainability goals and appeals to a growing segment of conscious consumers. Furthermore, ongoing research into novel pharmaceutical applications of propionic acid derivatives, such as in drug synthesis and controlled release formulations, offers high-value market potential. Strategic partnerships between propionic acid producers and end-user industries can lead to the co-development of innovative solutions tailored to specific needs, unlocking new market segments and accelerating adoption.
Leading Players in the Propionic Acid Application Market Sector
- Yancheng Hongtai Bioengineering Co Ltd
- OQ Chemicals GmbH
- Yancheng Huade (Dancheng) Biological Engineering Co Ltd
- Merck KGaA
- Celanese Corporation
- Shanghai Jianbei Organic Chemical Co Ltd
- BASF SE
- Dow
- Eastman Chemical Company
- Daicel Corporation
- Hawkins
- Perstorp
Key Milestones in Propionic Acid Application Market Industry
- September 2022: BASF SE achieved a Carbon Neutral certification from the Carbon Trust, and now the company is offering propionic acid and neopentyl glycol with zero carbon footprint.
- April 2022: Perstorp plans to build a new carboxylic acid manufacturing plant in Sweden by 2024, adding a production capacity of around 70,000 metric tons per year for naturally occurring carboxylic acids such as Propionic Acid.
Strategic Outlook for Propionic Acid Application Market Market
The strategic outlook for the Propionic Acid Application Market is characterized by sustained growth and increasing diversification. The continued expansion of the animal feed and food preservation sectors will remain a core growth accelerator, driven by global population increases and rising protein consumption. Strategic investments in bio-based production technologies are crucial for manufacturers to cater to the growing demand for sustainable solutions and gain a competitive edge. Exploring and developing novel applications in the pharmaceutical and specialty chemical sectors offers significant potential for value creation and market expansion. Furthermore, forging strategic alliances and partnerships will be key to enhancing market reach, sharing technological expertise, and co-developing innovative products that address evolving industry needs. The market's robust fundamentals, coupled with a focus on sustainability and innovation, point towards a promising future.
Propionic Acid Application Market Segmentation
-
1. Application
- 1.1. Animal Feed and Food Preservatives
- 1.2. Calcium, Ammonium, and Sodium Salts
- 1.3. Cellulose Acetate Propionate
- 1.4. Herbicides
- 1.5. Plasticizers
- 1.6. Other Applications
-
2. End-user Industry
- 2.1. Agriculture
- 2.2. Food and Beverage
- 2.3. Personal Care
- 2.4. Pharmaceutical
- 2.5. Other End-user Industries
Propionic Acid Application Market Segmentation By Geography
-
1. Asia Pacific
- 1.1. China
- 1.2. India
- 1.3. Japan
- 1.4. South Korea
- 1.5. Rest of Asia Pacific
-
2. North America
- 2.1. United States
- 2.2. Canada
- 2.3. Mexico
-
3. Europe
- 3.1. Germany
- 3.2. United Kingdom
- 3.3. Italy
- 3.4. France
- 3.5. Rest of Europe
-
4. South America
- 4.1. Argentina
- 4.2. Brazil
- 4.3. Rest of South America
-
5. Middle East and Africa
- 5.1. Saudi Arabia
- 5.2. South Africa
- 5.3. Rest of Middle East and Africa
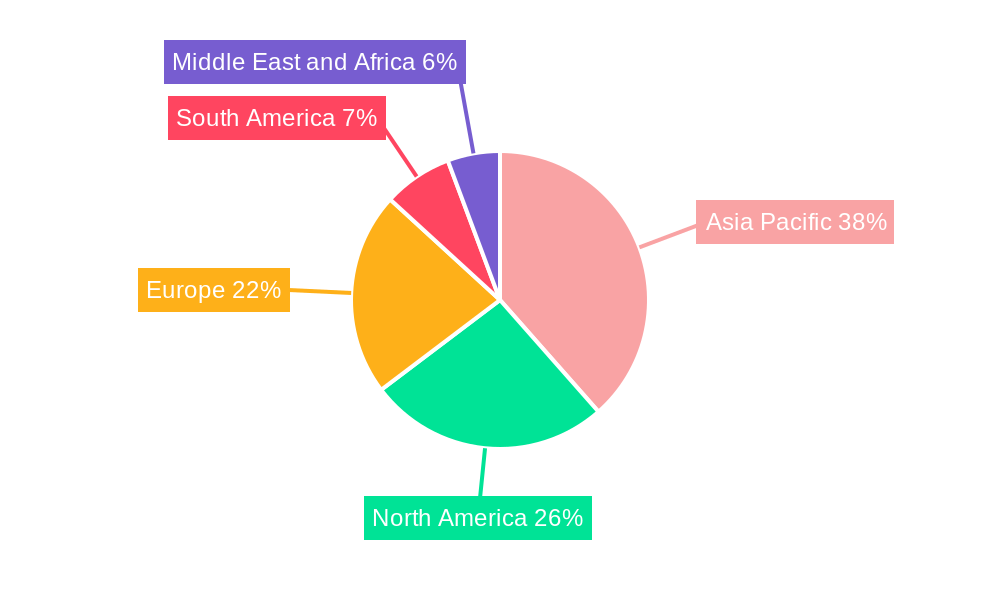
Propionic Acid Application Market Regional Market Share
Geographic Coverage of Propionic Acid Application Market
Propionic Acid Application Market REPORT HIGHLIGHTS
| Aspects | Details |
|---|---|
| Study Period | 2020-2034 |
| Base Year | 2025 |
| Estimated Year | 2026 |
| Forecast Period | 2026-2034 |
| Historical Period | 2020-2025 |
| Growth Rate | CAGR of 5.92% from 2020-2034 |
| Segmentation |
|
Table of Contents
- 1. Introduction
- 1.1. Research Scope
- 1.2. Market Segmentation
- 1.3. Research Objective
- 1.4. Definitions and Assumptions
- 2. Executive Summary
- 2.1. Market Snapshot
- 3. Market Dynamics
- 3.1. Market Drivers
- 3.2. Market Restrains
- 3.3. Market Trends
- 3.4. Market Opportunities
- 4. Market Factor Analysis
- 4.1. Porters Five Forces
- 4.1.1. Bargaining Power of Suppliers
- 4.1.2. Bargaining Power of Buyers
- 4.1.3. Threat of New Entrants
- 4.1.4. Threat of Substitutes
- 4.1.5. Competitive Rivalry
- 4.2. PESTEL analysis
- 4.3. BCG Analysis
- 4.3.1. Stars (High Growth, High Market Share)
- 4.3.2. Cash Cows (Low Growth, High Market Share)
- 4.3.3. Question Mark (High Growth, Low Market Share)
- 4.3.4. Dogs (Low Growth, Low Market Share)
- 4.4. Ansoff Matrix Analysis
- 4.5. Supply Chain Analysis
- 4.6. Regulatory Landscape
- 4.7. Current Market Potential and Opportunity Assessment (TAM–SAM–SOM Framework)
- 4.8. MDP Analyst Note
- 4.1. Porters Five Forces
- 5. Market Analysis, Insights and Forecast 2021-2033
- 5.1. Market Analysis, Insights and Forecast - by Application
- 5.1.1. Animal Feed and Food Preservatives
- 5.1.2. Calcium, Ammonium, and Sodium Salts
- 5.1.3. Cellulose Acetate Propionate
- 5.1.4. Herbicides
- 5.1.5. Plasticizers
- 5.1.6. Other Applications
- 5.2. Market Analysis, Insights and Forecast - by End-user Industry
- 5.2.1. Agriculture
- 5.2.2. Food and Beverage
- 5.2.3. Personal Care
- 5.2.4. Pharmaceutical
- 5.2.5. Other End-user Industries
- 5.3. Market Analysis, Insights and Forecast - by Region
- 5.3.1. Asia Pacific
- 5.3.2. North America
- 5.3.3. Europe
- 5.3.4. South America
- 5.3.5. Middle East and Africa
- 5.1. Market Analysis, Insights and Forecast - by Application
- 6. Global Propionic Acid Application Market Analysis, Insights and Forecast, 2021-2033
- 6.1. Market Analysis, Insights and Forecast - by Application
- 6.1.1. Animal Feed and Food Preservatives
- 6.1.2. Calcium, Ammonium, and Sodium Salts
- 6.1.3. Cellulose Acetate Propionate
- 6.1.4. Herbicides
- 6.1.5. Plasticizers
- 6.1.6. Other Applications
- 6.2. Market Analysis, Insights and Forecast - by End-user Industry
- 6.2.1. Agriculture
- 6.2.2. Food and Beverage
- 6.2.3. Personal Care
- 6.2.4. Pharmaceutical
- 6.2.5. Other End-user Industries
- 6.1. Market Analysis, Insights and Forecast - by Application
- 7. Asia Pacific Propionic Acid Application Market Analysis, Insights and Forecast, 2020-2032
- 7.1. Market Analysis, Insights and Forecast - by Application
- 7.1.1. Animal Feed and Food Preservatives
- 7.1.2. Calcium, Ammonium, and Sodium Salts
- 7.1.3. Cellulose Acetate Propionate
- 7.1.4. Herbicides
- 7.1.5. Plasticizers
- 7.1.6. Other Applications
- 7.2. Market Analysis, Insights and Forecast - by End-user Industry
- 7.2.1. Agriculture
- 7.2.2. Food and Beverage
- 7.2.3. Personal Care
- 7.2.4. Pharmaceutical
- 7.2.5. Other End-user Industries
- 7.1. Market Analysis, Insights and Forecast - by Application
- 8. North America Propionic Acid Application Market Analysis, Insights and Forecast, 2020-2032
- 8.1. Market Analysis, Insights and Forecast - by Application
- 8.1.1. Animal Feed and Food Preservatives
- 8.1.2. Calcium, Ammonium, and Sodium Salts
- 8.1.3. Cellulose Acetate Propionate
- 8.1.4. Herbicides
- 8.1.5. Plasticizers
- 8.1.6. Other Applications
- 8.2. Market Analysis, Insights and Forecast - by End-user Industry
- 8.2.1. Agriculture
- 8.2.2. Food and Beverage
- 8.2.3. Personal Care
- 8.2.4. Pharmaceutical
- 8.2.5. Other End-user Industries
- 8.1. Market Analysis, Insights and Forecast - by Application
- 9. Europe Propionic Acid Application Market Analysis, Insights and Forecast, 2020-2032
- 9.1. Market Analysis, Insights and Forecast - by Application
- 9.1.1. Animal Feed and Food Preservatives
- 9.1.2. Calcium, Ammonium, and Sodium Salts
- 9.1.3. Cellulose Acetate Propionate
- 9.1.4. Herbicides
- 9.1.5. Plasticizers
- 9.1.6. Other Applications
- 9.2. Market Analysis, Insights and Forecast - by End-user Industry
- 9.2.1. Agriculture
- 9.2.2. Food and Beverage
- 9.2.3. Personal Care
- 9.2.4. Pharmaceutical
- 9.2.5. Other End-user Industries
- 9.1. Market Analysis, Insights and Forecast - by Application
- 10. South America Propionic Acid Application Market Analysis, Insights and Forecast, 2020-2032
- 10.1. Market Analysis, Insights and Forecast - by Application
- 10.1.1. Animal Feed and Food Preservatives
- 10.1.2. Calcium, Ammonium, and Sodium Salts
- 10.1.3. Cellulose Acetate Propionate
- 10.1.4. Herbicides
- 10.1.5. Plasticizers
- 10.1.6. Other Applications
- 10.2. Market Analysis, Insights and Forecast - by End-user Industry
- 10.2.1. Agriculture
- 10.2.2. Food and Beverage
- 10.2.3. Personal Care
- 10.2.4. Pharmaceutical
- 10.2.5. Other End-user Industries
- 10.1. Market Analysis, Insights and Forecast - by Application
- 11. Middle East and Africa Propionic Acid Application Market Analysis, Insights and Forecast, 2020-2032
- 11.1. Market Analysis, Insights and Forecast - by Application
- 11.1.1. Animal Feed and Food Preservatives
- 11.1.2. Calcium, Ammonium, and Sodium Salts
- 11.1.3. Cellulose Acetate Propionate
- 11.1.4. Herbicides
- 11.1.5. Plasticizers
- 11.1.6. Other Applications
- 11.2. Market Analysis, Insights and Forecast - by End-user Industry
- 11.2.1. Agriculture
- 11.2.2. Food and Beverage
- 11.2.3. Personal Care
- 11.2.4. Pharmaceutical
- 11.2.5. Other End-user Industries
- 11.1. Market Analysis, Insights and Forecast - by Application
- 12. Competitive Analysis
- 12.1. Company Profiles
- 12.1.1 Yancheng Hongtai Bioengineering Co Ltd
- 12.1.1.1. Company Overview
- 12.1.1.2. Products
- 12.1.1.3. Company Financials
- 12.1.1.4. SWOT Analysis
- 12.1.2 OQ Chemicals GmbH
- 12.1.2.1. Company Overview
- 12.1.2.2. Products
- 12.1.2.3. Company Financials
- 12.1.2.4. SWOT Analysis
- 12.1.3 Yancheng Huade (Dancheng) Biological Engineering Co Ltd *List Not Exhaustive
- 12.1.3.1. Company Overview
- 12.1.3.2. Products
- 12.1.3.3. Company Financials
- 12.1.3.4. SWOT Analysis
- 12.1.4 Merck KGaA
- 12.1.4.1. Company Overview
- 12.1.4.2. Products
- 12.1.4.3. Company Financials
- 12.1.4.4. SWOT Analysis
- 12.1.5 Celanese Corporation
- 12.1.5.1. Company Overview
- 12.1.5.2. Products
- 12.1.5.3. Company Financials
- 12.1.5.4. SWOT Analysis
- 12.1.6 Shanghai Jianbei Organic Chemical Co Ltd
- 12.1.6.1. Company Overview
- 12.1.6.2. Products
- 12.1.6.3. Company Financials
- 12.1.6.4. SWOT Analysis
- 12.1.7 BASF SE
- 12.1.7.1. Company Overview
- 12.1.7.2. Products
- 12.1.7.3. Company Financials
- 12.1.7.4. SWOT Analysis
- 12.1.8 Dow
- 12.1.8.1. Company Overview
- 12.1.8.2. Products
- 12.1.8.3. Company Financials
- 12.1.8.4. SWOT Analysis
- 12.1.9 Eastman Chemical Company
- 12.1.9.1. Company Overview
- 12.1.9.2. Products
- 12.1.9.3. Company Financials
- 12.1.9.4. SWOT Analysis
- 12.1.10 Daicel Corporation
- 12.1.10.1. Company Overview
- 12.1.10.2. Products
- 12.1.10.3. Company Financials
- 12.1.10.4. SWOT Analysis
- 12.1.11 Hawkins
- 12.1.11.1. Company Overview
- 12.1.11.2. Products
- 12.1.11.3. Company Financials
- 12.1.11.4. SWOT Analysis
- 12.1.12 Perstorp
- 12.1.12.1. Company Overview
- 12.1.12.2. Products
- 12.1.12.3. Company Financials
- 12.1.12.4. SWOT Analysis
- 12.1.1 Yancheng Hongtai Bioengineering Co Ltd
- 12.2. Market Entropy
- 12.2.1 Company's Key Areas Served
- 12.2.2 Recent Developments
- 12.3. Company Market Share Analysis 2025
- 12.3.1 Top 5 Companies Market Share Analysis
- 12.3.2 Top 3 Companies Market Share Analysis
- 12.4. List of Potential Customers
- 13. Research Methodology
List of Figures
- Figure 1: Global Propionic Acid Application Market Revenue Breakdown (billion, %) by Region 2025 & 2033
- Figure 2: Global Propionic Acid Application Market Volume Breakdown (kilotons, %) by Region 2025 & 2033
- Figure 3: Asia Pacific Propionic Acid Application Market Revenue (billion), by Application 2025 & 2033
- Figure 4: Asia Pacific Propionic Acid Application Market Volume (kilotons), by Application 2025 & 2033
- Figure 5: Asia Pacific Propionic Acid Application Market Revenue Share (%), by Application 2025 & 2033
- Figure 6: Asia Pacific Propionic Acid Application Market Volume Share (%), by Application 2025 & 2033
- Figure 7: Asia Pacific Propionic Acid Application Market Revenue (billion), by End-user Industry 2025 & 2033
- Figure 8: Asia Pacific Propionic Acid Application Market Volume (kilotons), by End-user Industry 2025 & 2033
- Figure 9: Asia Pacific Propionic Acid Application Market Revenue Share (%), by End-user Industry 2025 & 2033
- Figure 10: Asia Pacific Propionic Acid Application Market Volume Share (%), by End-user Industry 2025 & 2033
- Figure 11: Asia Pacific Propionic Acid Application Market Revenue (billion), by Country 2025 & 2033
- Figure 12: Asia Pacific Propionic Acid Application Market Volume (kilotons), by Country 2025 & 2033
- Figure 13: Asia Pacific Propionic Acid Application Market Revenue Share (%), by Country 2025 & 2033
- Figure 14: Asia Pacific Propionic Acid Application Market Volume Share (%), by Country 2025 & 2033
- Figure 15: North America Propionic Acid Application Market Revenue (billion), by Application 2025 & 2033
- Figure 16: North America Propionic Acid Application Market Volume (kilotons), by Application 2025 & 2033
- Figure 17: North America Propionic Acid Application Market Revenue Share (%), by Application 2025 & 2033
- Figure 18: North America Propionic Acid Application Market Volume Share (%), by Application 2025 & 2033
- Figure 19: North America Propionic Acid Application Market Revenue (billion), by End-user Industry 2025 & 2033
- Figure 20: North America Propionic Acid Application Market Volume (kilotons), by End-user Industry 2025 & 2033
- Figure 21: North America Propionic Acid Application Market Revenue Share (%), by End-user Industry 2025 & 2033
- Figure 22: North America Propionic Acid Application Market Volume Share (%), by End-user Industry 2025 & 2033
- Figure 23: North America Propionic Acid Application Market Revenue (billion), by Country 2025 & 2033
- Figure 24: North America Propionic Acid Application Market Volume (kilotons), by Country 2025 & 2033
- Figure 25: North America Propionic Acid Application Market Revenue Share (%), by Country 2025 & 2033
- Figure 26: North America Propionic Acid Application Market Volume Share (%), by Country 2025 & 2033
- Figure 27: Europe Propionic Acid Application Market Revenue (billion), by Application 2025 & 2033
- Figure 28: Europe Propionic Acid Application Market Volume (kilotons), by Application 2025 & 2033
- Figure 29: Europe Propionic Acid Application Market Revenue Share (%), by Application 2025 & 2033
- Figure 30: Europe Propionic Acid Application Market Volume Share (%), by Application 2025 & 2033
- Figure 31: Europe Propionic Acid Application Market Revenue (billion), by End-user Industry 2025 & 2033
- Figure 32: Europe Propionic Acid Application Market Volume (kilotons), by End-user Industry 2025 & 2033
- Figure 33: Europe Propionic Acid Application Market Revenue Share (%), by End-user Industry 2025 & 2033
- Figure 34: Europe Propionic Acid Application Market Volume Share (%), by End-user Industry 2025 & 2033
- Figure 35: Europe Propionic Acid Application Market Revenue (billion), by Country 2025 & 2033
- Figure 36: Europe Propionic Acid Application Market Volume (kilotons), by Country 2025 & 2033
- Figure 37: Europe Propionic Acid Application Market Revenue Share (%), by Country 2025 & 2033
- Figure 38: Europe Propionic Acid Application Market Volume Share (%), by Country 2025 & 2033
- Figure 39: South America Propionic Acid Application Market Revenue (billion), by Application 2025 & 2033
- Figure 40: South America Propionic Acid Application Market Volume (kilotons), by Application 2025 & 2033
- Figure 41: South America Propionic Acid Application Market Revenue Share (%), by Application 2025 & 2033
- Figure 42: South America Propionic Acid Application Market Volume Share (%), by Application 2025 & 2033
- Figure 43: South America Propionic Acid Application Market Revenue (billion), by End-user Industry 2025 & 2033
- Figure 44: South America Propionic Acid Application Market Volume (kilotons), by End-user Industry 2025 & 2033
- Figure 45: South America Propionic Acid Application Market Revenue Share (%), by End-user Industry 2025 & 2033
- Figure 46: South America Propionic Acid Application Market Volume Share (%), by End-user Industry 2025 & 2033
- Figure 47: South America Propionic Acid Application Market Revenue (billion), by Country 2025 & 2033
- Figure 48: South America Propionic Acid Application Market Volume (kilotons), by Country 2025 & 2033
- Figure 49: South America Propionic Acid Application Market Revenue Share (%), by Country 2025 & 2033
- Figure 50: South America Propionic Acid Application Market Volume Share (%), by Country 2025 & 2033
- Figure 51: Middle East and Africa Propionic Acid Application Market Revenue (billion), by Application 2025 & 2033
- Figure 52: Middle East and Africa Propionic Acid Application Market Volume (kilotons), by Application 2025 & 2033
- Figure 53: Middle East and Africa Propionic Acid Application Market Revenue Share (%), by Application 2025 & 2033
- Figure 54: Middle East and Africa Propionic Acid Application Market Volume Share (%), by Application 2025 & 2033
- Figure 55: Middle East and Africa Propionic Acid Application Market Revenue (billion), by End-user Industry 2025 & 2033
- Figure 56: Middle East and Africa Propionic Acid Application Market Volume (kilotons), by End-user Industry 2025 & 2033
- Figure 57: Middle East and Africa Propionic Acid Application Market Revenue Share (%), by End-user Industry 2025 & 2033
- Figure 58: Middle East and Africa Propionic Acid Application Market Volume Share (%), by End-user Industry 2025 & 2033
- Figure 59: Middle East and Africa Propionic Acid Application Market Revenue (billion), by Country 2025 & 2033
- Figure 60: Middle East and Africa Propionic Acid Application Market Volume (kilotons), by Country 2025 & 2033
- Figure 61: Middle East and Africa Propionic Acid Application Market Revenue Share (%), by Country 2025 & 2033
- Figure 62: Middle East and Africa Propionic Acid Application Market Volume Share (%), by Country 2025 & 2033
List of Tables
- Table 1: Global Propionic Acid Application Market Revenue billion Forecast, by Application 2020 & 2033
- Table 2: Global Propionic Acid Application Market Volume kilotons Forecast, by Application 2020 & 2033
- Table 3: Global Propionic Acid Application Market Revenue billion Forecast, by End-user Industry 2020 & 2033
- Table 4: Global Propionic Acid Application Market Volume kilotons Forecast, by End-user Industry 2020 & 2033
- Table 5: Global Propionic Acid Application Market Revenue billion Forecast, by Region 2020 & 2033
- Table 6: Global Propionic Acid Application Market Volume kilotons Forecast, by Region 2020 & 2033
- Table 7: Global Propionic Acid Application Market Revenue billion Forecast, by Application 2020 & 2033
- Table 8: Global Propionic Acid Application Market Volume kilotons Forecast, by Application 2020 & 2033
- Table 9: Global Propionic Acid Application Market Revenue billion Forecast, by End-user Industry 2020 & 2033
- Table 10: Global Propionic Acid Application Market Volume kilotons Forecast, by End-user Industry 2020 & 2033
- Table 11: Global Propionic Acid Application Market Revenue billion Forecast, by Country 2020 & 2033
- Table 12: Global Propionic Acid Application Market Volume kilotons Forecast, by Country 2020 & 2033
- Table 13: China Propionic Acid Application Market Revenue (billion) Forecast, by Application 2020 & 2033
- Table 14: China Propionic Acid Application Market Volume (kilotons) Forecast, by Application 2020 & 2033
- Table 15: India Propionic Acid Application Market Revenue (billion) Forecast, by Application 2020 & 2033
- Table 16: India Propionic Acid Application Market Volume (kilotons) Forecast, by Application 2020 & 2033
- Table 17: Japan Propionic Acid Application Market Revenue (billion) Forecast, by Application 2020 & 2033
- Table 18: Japan Propionic Acid Application Market Volume (kilotons) Forecast, by Application 2020 & 2033
- Table 19: South Korea Propionic Acid Application Market Revenue (billion) Forecast, by Application 2020 & 2033
- Table 20: South Korea Propionic Acid Application Market Volume (kilotons) Forecast, by Application 2020 & 2033
- Table 21: Rest of Asia Pacific Propionic Acid Application Market Revenue (billion) Forecast, by Application 2020 & 2033
- Table 22: Rest of Asia Pacific Propionic Acid Application Market Volume (kilotons) Forecast, by Application 2020 & 2033
- Table 23: Global Propionic Acid Application Market Revenue billion Forecast, by Application 2020 & 2033
- Table 24: Global Propionic Acid Application Market Volume kilotons Forecast, by Application 2020 & 2033
- Table 25: Global Propionic Acid Application Market Revenue billion Forecast, by End-user Industry 2020 & 2033
- Table 26: Global Propionic Acid Application Market Volume kilotons Forecast, by End-user Industry 2020 & 2033
- Table 27: Global Propionic Acid Application Market Revenue billion Forecast, by Country 2020 & 2033
- Table 28: Global Propionic Acid Application Market Volume kilotons Forecast, by Country 2020 & 2033
- Table 29: United States Propionic Acid Application Market Revenue (billion) Forecast, by Application 2020 & 2033
- Table 30: United States Propionic Acid Application Market Volume (kilotons) Forecast, by Application 2020 & 2033
- Table 31: Canada Propionic Acid Application Market Revenue (billion) Forecast, by Application 2020 & 2033
- Table 32: Canada Propionic Acid Application Market Volume (kilotons) Forecast, by Application 2020 & 2033
- Table 33: Mexico Propionic Acid Application Market Revenue (billion) Forecast, by Application 2020 & 2033
- Table 34: Mexico Propionic Acid Application Market Volume (kilotons) Forecast, by Application 2020 & 2033
- Table 35: Global Propionic Acid Application Market Revenue billion Forecast, by Application 2020 & 2033
- Table 36: Global Propionic Acid Application Market Volume kilotons Forecast, by Application 2020 & 2033
- Table 37: Global Propionic Acid Application Market Revenue billion Forecast, by End-user Industry 2020 & 2033
- Table 38: Global Propionic Acid Application Market Volume kilotons Forecast, by End-user Industry 2020 & 2033
- Table 39: Global Propionic Acid Application Market Revenue billion Forecast, by Country 2020 & 2033
- Table 40: Global Propionic Acid Application Market Volume kilotons Forecast, by Country 2020 & 2033
- Table 41: Germany Propionic Acid Application Market Revenue (billion) Forecast, by Application 2020 & 2033
- Table 42: Germany Propionic Acid Application Market Volume (kilotons) Forecast, by Application 2020 & 2033
- Table 43: United Kingdom Propionic Acid Application Market Revenue (billion) Forecast, by Application 2020 & 2033
- Table 44: United Kingdom Propionic Acid Application Market Volume (kilotons) Forecast, by Application 2020 & 2033
- Table 45: Italy Propionic Acid Application Market Revenue (billion) Forecast, by Application 2020 & 2033
- Table 46: Italy Propionic Acid Application Market Volume (kilotons) Forecast, by Application 2020 & 2033
- Table 47: France Propionic Acid Application Market Revenue (billion) Forecast, by Application 2020 & 2033
- Table 48: France Propionic Acid Application Market Volume (kilotons) Forecast, by Application 2020 & 2033
- Table 49: Rest of Europe Propionic Acid Application Market Revenue (billion) Forecast, by Application 2020 & 2033
- Table 50: Rest of Europe Propionic Acid Application Market Volume (kilotons) Forecast, by Application 2020 & 2033
- Table 51: Global Propionic Acid Application Market Revenue billion Forecast, by Application 2020 & 2033
- Table 52: Global Propionic Acid Application Market Volume kilotons Forecast, by Application 2020 & 2033
- Table 53: Global Propionic Acid Application Market Revenue billion Forecast, by End-user Industry 2020 & 2033
- Table 54: Global Propionic Acid Application Market Volume kilotons Forecast, by End-user Industry 2020 & 2033
- Table 55: Global Propionic Acid Application Market Revenue billion Forecast, by Country 2020 & 2033
- Table 56: Global Propionic Acid Application Market Volume kilotons Forecast, by Country 2020 & 2033
- Table 57: Argentina Propionic Acid Application Market Revenue (billion) Forecast, by Application 2020 & 2033
- Table 58: Argentina Propionic Acid Application Market Volume (kilotons) Forecast, by Application 2020 & 2033
- Table 59: Brazil Propionic Acid Application Market Revenue (billion) Forecast, by Application 2020 & 2033
- Table 60: Brazil Propionic Acid Application Market Volume (kilotons) Forecast, by Application 2020 & 2033
- Table 61: Rest of South America Propionic Acid Application Market Revenue (billion) Forecast, by Application 2020 & 2033
- Table 62: Rest of South America Propionic Acid Application Market Volume (kilotons) Forecast, by Application 2020 & 2033
- Table 63: Global Propionic Acid Application Market Revenue billion Forecast, by Application 2020 & 2033
- Table 64: Global Propionic Acid Application Market Volume kilotons Forecast, by Application 2020 & 2033
- Table 65: Global Propionic Acid Application Market Revenue billion Forecast, by End-user Industry 2020 & 2033
- Table 66: Global Propionic Acid Application Market Volume kilotons Forecast, by End-user Industry 2020 & 2033
- Table 67: Global Propionic Acid Application Market Revenue billion Forecast, by Country 2020 & 2033
- Table 68: Global Propionic Acid Application Market Volume kilotons Forecast, by Country 2020 & 2033
- Table 69: Saudi Arabia Propionic Acid Application Market Revenue (billion) Forecast, by Application 2020 & 2033
- Table 70: Saudi Arabia Propionic Acid Application Market Volume (kilotons) Forecast, by Application 2020 & 2033
- Table 71: South Africa Propionic Acid Application Market Revenue (billion) Forecast, by Application 2020 & 2033
- Table 72: South Africa Propionic Acid Application Market Volume (kilotons) Forecast, by Application 2020 & 2033
- Table 73: Rest of Middle East and Africa Propionic Acid Application Market Revenue (billion) Forecast, by Application 2020 & 2033
- Table 74: Rest of Middle East and Africa Propionic Acid Application Market Volume (kilotons) Forecast, by Application 2020 & 2033
Frequently Asked Questions
1. What is the projected Compound Annual Growth Rate (CAGR) of the Propionic Acid Application Market?
The projected CAGR is approximately 5.92%.
2. Which companies are prominent players in the Propionic Acid Application Market?
Key companies in the market include Yancheng Hongtai Bioengineering Co Ltd, OQ Chemicals GmbH, Yancheng Huade (Dancheng) Biological Engineering Co Ltd *List Not Exhaustive, Merck KGaA, Celanese Corporation, Shanghai Jianbei Organic Chemical Co Ltd, BASF SE, Dow, Eastman Chemical Company, Daicel Corporation, Hawkins, Perstorp.
3. What are the main segments of the Propionic Acid Application Market?
The market segments include Application, End-user Industry.
4. Can you provide details about the market size?
The market size is estimated to be USD 1.21 billion as of 2022.
5. What are some drivers contributing to market growth?
Increasing Demand for Grain Preservatives and Safe Animal Feed; Significant Increase in Adoption in Emergeing Economies; Other Drivers.
6. What are the notable trends driving market growth?
Growing Demand from the Agriculture Industry.
7. Are there any restraints impacting market growth?
Detrimental Effects of Propionic Acid on Human Health; Environmental Concerns Regarding Use of Herbicides; Other Restraints.
8. Can you provide examples of recent developments in the market?
September 2022: BASF SE achieved a Carbon Neutral certification from the Carbon Trust, and now the company is offering propionic acid and neopentyl glycol with zero carbon footprint.
9. What pricing options are available for accessing the report?
Pricing options include single-user, multi-user, and enterprise licenses priced at USD 4750, USD 5250, and USD 8750 respectively.
10. Is the market size provided in terms of value or volume?
The market size is provided in terms of value, measured in billion and volume, measured in kilotons.
11. Are there any specific market keywords associated with the report?
Yes, the market keyword associated with the report is "Propionic Acid Application Market," which aids in identifying and referencing the specific market segment covered.
12. How do I determine which pricing option suits my needs best?
The pricing options vary based on user requirements and access needs. Individual users may opt for single-user licenses, while businesses requiring broader access may choose multi-user or enterprise licenses for cost-effective access to the report.
13. Are there any additional resources or data provided in the Propionic Acid Application Market report?
While the report offers comprehensive insights, it's advisable to review the specific contents or supplementary materials provided to ascertain if additional resources or data are available.
14. How can I stay updated on further developments or reports in the Propionic Acid Application Market?
To stay informed about further developments, trends, and reports in the Propionic Acid Application Market, consider subscribing to industry newsletters, following relevant companies and organizations, or regularly checking reputable industry news sources and publications.
Methodology
Step 1 - Identification of Relevant Samples Size from Population Database


Step 2 - Approaches for Defining Global Market Size (Value, Volume* & Price*)

Note*: In applicable scenarios
Step 3 - Data Sources
Primary Research
- Web Analytics
- Survey Reports
- Research Institute
- Latest Research Reports
- Opinion Leaders
Secondary Research
- Annual Reports
- White Paper
- Latest Press Release
- Industry Association
- Paid Database
- Investor Presentations

Step 4 - Data Triangulation
Involves using different sources of information in order to increase the validity of a study
These sources are likely to be stakeholders in a program - participants, other researchers, program staff, other community members, and so on.
Then we put all data in single framework & apply various statistical tools to find out the dynamic on the market.
During the analysis stage, feedback from the stakeholder groups would be compared to determine areas of agreement as well as areas of divergence