

Key Insights
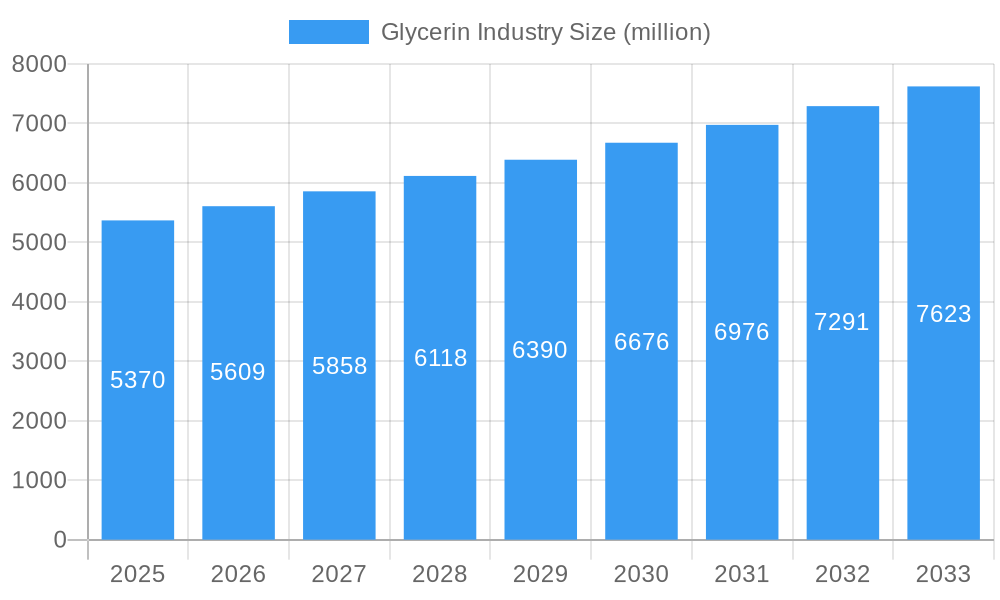
The global glycerin market is poised for significant expansion, projected to reach $5.37 million in 2025 and grow at a healthy Compound Annual Growth Rate (CAGR) of 4.5% through 2033. This robust growth is primarily fueled by the increasing demand for glycerin across a multitude of industries, with the pharmaceutical and food & beverage sectors leading the charge due to glycerin's versatile humectant, solvent, and sweetener properties. The expanding biodiesel industry, a major byproduct source of glycerin, further bolsters supply and contributes to market accessibility. Refined glycerin, in particular, is witnessing heightened demand owing to its purity and suitability for sensitive applications like pharmaceuticals and cosmetics. Emerging economies in Asia Pacific, driven by rapid industrialization and a growing middle class, are emerging as key growth engines for the glycerin market.
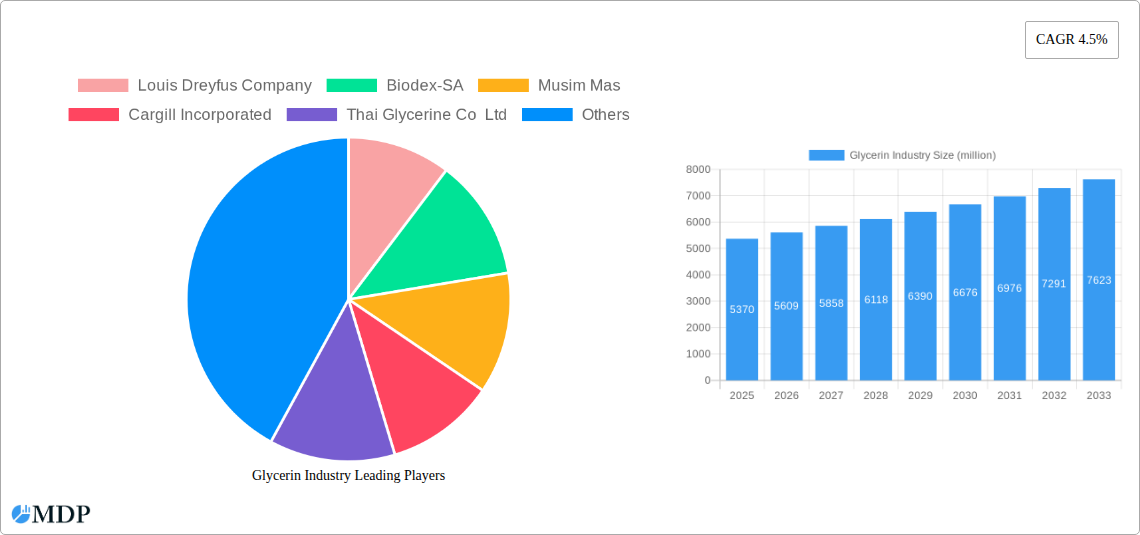
Glycerin Industry Market Size (In Billion)
The market's trajectory is further shaped by evolving consumer preferences and stringent quality standards. While the increasing adoption of sustainable and bio-based products favors glycerin derived from natural sources, concerns regarding price volatility of raw materials and stringent regulatory frameworks in certain regions present potential headwinds. However, ongoing innovation in glycerin purification technologies and the exploration of new applications, such as in the production of polyether polyols for polyurethanes, are expected to offset these challenges. The competitive landscape is characterized by the presence of major global players and a growing number of regional manufacturers, all vying for market share through product innovation, strategic partnerships, and geographical expansion. Key regions like North America and Europe will continue to be significant markets, while Asia Pacific is set to witness the most dynamic growth.
Glycerin Industry Company Market Share
This in-depth report provides a definitive analysis of the global Glycerin market, a critical component in a multitude of industries. Delving into market dynamics, trends, key players, and future opportunities from 2019 to 2033, this research offers actionable intelligence for stakeholders seeking to navigate and capitalize on this expansive sector. With the base year at 2025, the report meticulously dissects historical performance and presents robust forecasts for 2025-2033, offering unparalleled clarity on the market's trajectory. Whether you are an investor, manufacturer, or end-user, this report equips you with the essential data to make informed strategic decisions in the dynamic glycerin industry.
The report covers vital segments including Crude Glycerin and Refined Glycerin, examining their origins from Biodiesels, Fatty Acids, Fatty Alcohols, and Other Sources. It meticulously analyzes applications across Pharmaceuticals, Food and Beverage, Alkyd Resins, Personal Care and Cosmetics, Industrial Chemicals, Polyether Polyols, Tobacco Humectants, and Other Applications. Witness the evolution of this essential chemical and its impact across diverse global economies.
Glycerin Industry Market Dynamics & Concentration
The global glycerin market exhibits a moderately concentrated landscape, with a significant portion of the market share held by a few key multinational corporations. This concentration is driven by substantial capital investments required for large-scale production facilities and advanced refining technologies. Innovation within the glycerin industry is a critical driver, particularly in developing sustainable production methods and high-purity grades for specialized applications. Regulatory frameworks, including stringent quality standards for food-grade and pharmaceutical-grade glycerin, significantly influence market entry and operational compliance. Product substitutes, while present in certain niche applications, generally lack the versatility and cost-effectiveness of glycerin, reinforcing its demand. End-user trends are pivotal, with growing consumer preference for natural and bio-based ingredients in personal care and food products directly boosting demand for refined glycerin derived from renewable sources. Merger and acquisition (M&A) activities, though not consistently high, play a crucial role in market consolidation and strategic expansion, allowing leading players to enhance their product portfolios and geographic reach. Historical data from 2019-2024 indicates a steady increase in M&A deal counts aimed at acquiring innovative technologies and expanding production capacities.
Glycerin Industry Industry Trends & Analysis
The global Glycerin industry is projected for robust growth, driven by an ever-expanding array of applications and a fundamental shift towards bio-based and sustainable chemical production. The market is witnessing a consistent compound annual growth rate (CAGR) of approximately 5.2% during the forecast period of 2025-2033, reflecting its indispensable role across multiple sectors. Technological disruptions are continuously refining production processes, leading to higher purity grades and more efficient extraction methods, particularly from biodiesel by-products. Consumer preferences are increasingly leaning towards natural and ethically sourced ingredients, a trend that significantly benefits the glycerin market as it is a naturally derived humectant and emulsifier. The personal care and cosmetics segment, in particular, is experiencing substantial market penetration growth, fueled by demand for moisturizers, soaps, and other skincare products. The food and beverage industry also continues to be a significant consumer, utilizing glycerin as a sweetener, humectant, and solvent. The pharmaceutical industry relies on high-purity glycerin for drug formulations and as an excipient, ensuring consistent demand. Furthermore, the growing demand for polyether polyols, a key ingredient in polyurethane production, is directly contributing to the upward trajectory of the glycerin market. The competitive dynamics are characterized by a blend of large, integrated players and specialized manufacturers, all vying for market share through product innovation, strategic partnerships, and cost optimization. The overall market penetration of glycerin is expected to deepen as new applications are discovered and existing ones expand.
Leading Markets & Segments in Glycerin Industry
The Glycerin industry exhibits strong regional dominance in Asia-Pacific, driven by the robust growth of its manufacturing sector and a burgeoning middle class with increasing disposable income. Within this region, China and India are significant markets, propelled by substantial domestic demand across various applications and their roles as major producers of oleochemicals.
Grade Dominance:
- Refined Glycerin commands the largest market share due to its high purity and widespread use in sensitive applications such as pharmaceuticals, food and beverage, and personal care and cosmetics. The stringent quality standards and increasing consumer demand for premium products in these sectors are key drivers.
- Crude Glycerin, while still significant, is primarily used as a feedstock for further refining or in industrial applications where purity is less critical. Its demand is closely linked to the biodiesel production output.
Source Dominance:
- Biodiesels remain the primary source of crude glycerin, making its availability and pricing directly correlated with the growth and policies surrounding renewable energy mandates globally.
- Fatty Acids and Fatty Alcohols are increasingly important sources for refined glycerin, especially as the oleochemical industry expands, driven by demand for sustainable ingredients.
Application Dominance:
- Personal Care and Cosmetics is a leading application segment, driven by the global demand for skincare, haircare, and cosmetic products. Glycerin's moisturizing and emulsifying properties make it an indispensable ingredient.
- Food and Beverage is another major segment, with glycerin used as a humectant, sweetener, and solvent in a wide range of products. The growth in processed foods and beverages fuels this demand.
- Pharmaceuticals consistently represent a significant application due to glycerin's use in syrups, suppositories, and as a solvent in various medicinal formulations. The increasing global healthcare spending contributes to this segment's strength.
- Industrial Chemicals, including its role in the production of alkyd resins and polyether polyols, also represent substantial demand, particularly in construction and automotive industries.
Glycerin Industry Product Developments
Product developments in the Glycerin industry are focused on enhancing purity, sustainability, and creating novel applications. Manufacturers are investing in advanced refining technologies to achieve ultra-high purity grades, catering to specialized pharmaceutical and electronic applications. There's a significant push towards bio-based glycerin production, utilizing waste streams and by-products from agriculture and food processing, thereby improving the environmental footprint. Innovations are also seen in developing glycerin-based derivatives with unique properties for advanced materials and specialized chemical formulations. These developments aim to offer competitive advantages by meeting the evolving demands for efficacy, safety, and sustainability from end-use industries like personal care and cosmetics, food and beverage, and pharmaceuticals.
Key Drivers of Glycerin Industry Growth
The growth of the Glycerin industry is propelled by several key factors. Technologically, advancements in refining processes have enabled the production of higher purity glycerin, expanding its use in sensitive applications. Economically, the increasing global demand for biodiesel continues to be a major source of crude glycerin, indirectly driving its availability. Furthermore, the growing consumer preference for natural and sustainable ingredients in personal care and cosmetics and food and beverage sectors significantly boosts demand for refined glycerin. Regulatory support for bio-based chemicals and the expanding applications in pharmaceuticals and industrial chemicals are also crucial growth accelerators.
Challenges in the Glycerin Industry Market
Despite its robust growth, the Glycerin industry faces several challenges. Fluctuations in the price and availability of crude glycerin, largely tied to biodiesel production and feedstock costs, can impact profitability. Stringent regulatory requirements for high-purity grades in pharmaceutical and food applications necessitate significant investment in quality control and manufacturing processes. Intense competition from established players and emerging manufacturers can exert downward pressure on prices. Additionally, the development and adoption of viable alternative humectants or functional ingredients in certain applications, though limited, represent a potential threat. Overcoming these barriers requires strategic sourcing, technological innovation, and a keen understanding of evolving market demands.
Emerging Opportunities in Glycerin Industry
Emerging opportunities in the Glycerin industry lie in the increasing demand for bio-based and renewable chemicals. The growing focus on sustainability and circular economy principles presents significant potential for glycerin derived from waste streams and by-products. Technological breakthroughs in advanced glycols and glycerin derivatives are opening new avenues in specialty chemicals and material science. Strategic partnerships between glycerin producers and end-use industries, particularly in personal care and cosmetics and pharmaceuticals, can foster co-innovation and market expansion. Furthermore, the untapped potential in emerging economies and the development of novel applications in sectors like advanced polymers and bioplastics represent substantial long-term growth catalysts.
Leading Players in the Glycerin Industry Sector
- Louis Dreyfus Company
- Biodex-SA
- Musim Mas
- Cargill Incorporated
- Thai Glycerine Co Ltd
- RB FUELS
- Vantage Specialty Chemicals
- KLK OLEO
- Sebacic India Limited
- IOI Corporation Berhad
- Wilmar International Ltd
- P&G Chemicals
- Archer Daniels Midland Company
- Emery Oleochemicals
- BASF SE
- Dow
- Munzer Bioindustrie GmbH
- Godrej Industries Limited
- Oleon NV
- Vance Group Ltd
- Kao Corporation
- Aemetis
Key Milestones in Glycerin Industry Industry
- December 2022: Oleochemical producer Oleon announced the acquisition of a blending plant in Conroe, Texas, by investing USD 50 million, strengthening its oleochemicals division, including glycerin production.
- October 2021: IOI Corporation Berhad announced the construction of a new 110,000 metric ton (MT) per year oleochemical plant in Prai, Penang, with a capital expenditure of MYR 220 million. This plant, expected to be completed by Q2 2022, primarily caters to palm and palm kernel-based fatty acids and glycerine, crucial for personal care and cosmetic products.
Strategic Outlook for Glycerin Industry Market
The strategic outlook for the Glycerin Industry Market is overwhelmingly positive, driven by sustained demand from established sectors and the emergence of novel applications. Key growth accelerators include the escalating global emphasis on sustainable and bio-based products, which positions glycerin favorably. Companies are likely to focus on optimizing production efficiency, enhancing the purity of refined glycerin, and exploring value-added derivatives. Strategic investments in research and development for new applications in pharmaceuticals, advanced materials, and potentially in energy storage solutions will be crucial. Furthermore, expanding market reach into rapidly developing economies and forging robust supply chain partnerships will be essential for capitalizing on future market potential and solidifying competitive advantages in this dynamic and indispensable chemical sector.
Glycerin Industry Segmentation
-
1. Grade
- 1.1. Crude Glycerin
- 1.2. Refined Glycerin
-
2. Source
- 2.1. Biodiesels
- 2.2. Fatty Acids
- 2.3. Fatty Alcohols
- 2.4. Other Sources
-
3. Application
- 3.1. Pharmaceuticals
- 3.2. Food and Beverage
- 3.3. Alkyd Resins
- 3.4. Personal Care and Cosmetics
- 3.5. Industrial Chemicals
- 3.6. Polyether Polyols
- 3.7. Tobacco Humectants
- 3.8. Other Applications
Glycerin Industry Segmentation By Geography
-
1. Asia Pacific
- 1.1. China
- 1.2. India
- 1.3. Japan
- 1.4. South Korea
- 1.5. Rest of Asia Pacific
-
2. North America
- 2.1. United States
- 2.2. Canada
- 2.3. Mexico
- 2.4. Rest of North America
-
3. Europe
- 3.1. Germany
- 3.2. United Kingdom
- 3.3. Italy
- 3.4. France
- 3.5. Rest of Europe
-
4. South America
- 4.1. Brazil
- 4.2. Argentina
- 4.3. Rest of South America
-
5. Middle East and Africa
- 5.1. Saudi Arabia
- 5.2. South Africa
- 5.3. United Arab Emirates
- 5.4. Rest of Middle East and Africa
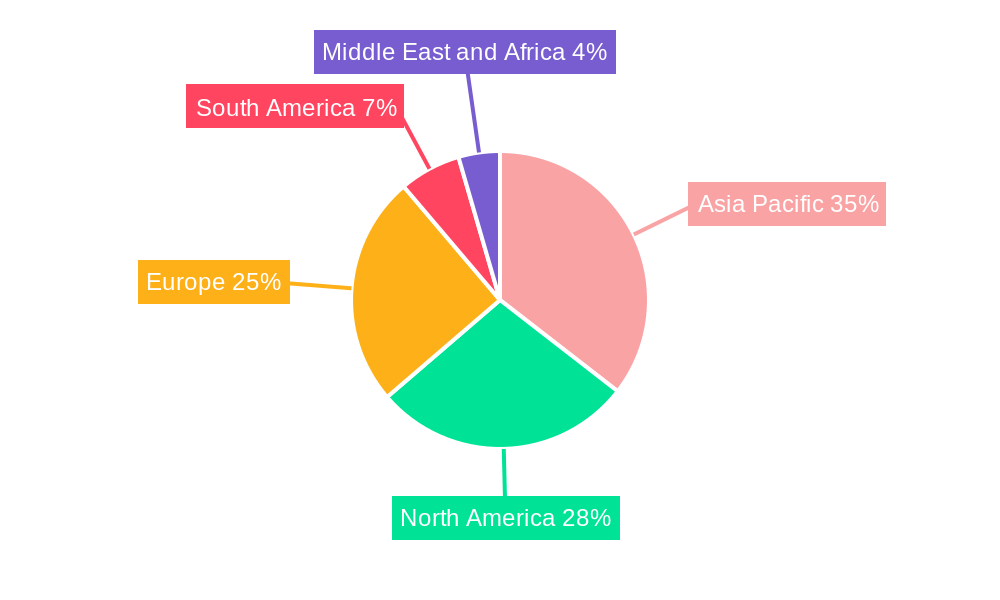
Glycerin Industry Regional Market Share
Geographic Coverage of Glycerin Industry
Glycerin Industry REPORT HIGHLIGHTS
| Aspects | Details |
|---|---|
| Study Period | 2020-2034 |
| Base Year | 2025 |
| Estimated Year | 2026 |
| Forecast Period | 2026-2034 |
| Historical Period | 2020-2025 |
| Growth Rate | CAGR of 4.5% from 2020-2034 |
| Segmentation |
|
Table of Contents
- 1. Introduction
- 1.1. Research Scope
- 1.2. Market Segmentation
- 1.3. Research Objective
- 1.4. Definitions and Assumptions
- 2. Executive Summary
- 2.1. Market Snapshot
- 3. Market Dynamics
- 3.1. Market Drivers
- 3.2. Market Restrains
- 3.3. Market Trends
- 3.4. Market Opportunities
- 4. Market Factor Analysis
- 4.1. Porters Five Forces
- 4.1.1. Bargaining Power of Suppliers
- 4.1.2. Bargaining Power of Buyers
- 4.1.3. Threat of New Entrants
- 4.1.4. Threat of Substitutes
- 4.1.5. Competitive Rivalry
- 4.2. PESTEL analysis
- 4.3. BCG Analysis
- 4.3.1. Stars (High Growth, High Market Share)
- 4.3.2. Cash Cows (Low Growth, High Market Share)
- 4.3.3. Question Mark (High Growth, Low Market Share)
- 4.3.4. Dogs (Low Growth, Low Market Share)
- 4.4. Ansoff Matrix Analysis
- 4.5. Supply Chain Analysis
- 4.6. Regulatory Landscape
- 4.7. Current Market Potential and Opportunity Assessment (TAM–SAM–SOM Framework)
- 4.8. MDP Analyst Note
- 4.1. Porters Five Forces
- 5. Market Analysis, Insights and Forecast 2021-2033
- 5.1. Market Analysis, Insights and Forecast - by Grade
- 5.1.1. Crude Glycerin
- 5.1.2. Refined Glycerin
- 5.2. Market Analysis, Insights and Forecast - by Source
- 5.2.1. Biodiesels
- 5.2.2. Fatty Acids
- 5.2.3. Fatty Alcohols
- 5.2.4. Other Sources
- 5.3. Market Analysis, Insights and Forecast - by Application
- 5.3.1. Pharmaceuticals
- 5.3.2. Food and Beverage
- 5.3.3. Alkyd Resins
- 5.3.4. Personal Care and Cosmetics
- 5.3.5. Industrial Chemicals
- 5.3.6. Polyether Polyols
- 5.3.7. Tobacco Humectants
- 5.3.8. Other Applications
- 5.4. Market Analysis, Insights and Forecast - by Region
- 5.4.1. Asia Pacific
- 5.4.2. North America
- 5.4.3. Europe
- 5.4.4. South America
- 5.4.5. Middle East and Africa
- 5.1. Market Analysis, Insights and Forecast - by Grade
- 6. Global Glycerin Industry Analysis, Insights and Forecast, 2021-2033
- 6.1. Market Analysis, Insights and Forecast - by Grade
- 6.1.1. Crude Glycerin
- 6.1.2. Refined Glycerin
- 6.2. Market Analysis, Insights and Forecast - by Source
- 6.2.1. Biodiesels
- 6.2.2. Fatty Acids
- 6.2.3. Fatty Alcohols
- 6.2.4. Other Sources
- 6.3. Market Analysis, Insights and Forecast - by Application
- 6.3.1. Pharmaceuticals
- 6.3.2. Food and Beverage
- 6.3.3. Alkyd Resins
- 6.3.4. Personal Care and Cosmetics
- 6.3.5. Industrial Chemicals
- 6.3.6. Polyether Polyols
- 6.3.7. Tobacco Humectants
- 6.3.8. Other Applications
- 6.1. Market Analysis, Insights and Forecast - by Grade
- 7. Asia Pacific Glycerin Industry Analysis, Insights and Forecast, 2020-2032
- 7.1. Market Analysis, Insights and Forecast - by Grade
- 7.1.1. Crude Glycerin
- 7.1.2. Refined Glycerin
- 7.2. Market Analysis, Insights and Forecast - by Source
- 7.2.1. Biodiesels
- 7.2.2. Fatty Acids
- 7.2.3. Fatty Alcohols
- 7.2.4. Other Sources
- 7.3. Market Analysis, Insights and Forecast - by Application
- 7.3.1. Pharmaceuticals
- 7.3.2. Food and Beverage
- 7.3.3. Alkyd Resins
- 7.3.4. Personal Care and Cosmetics
- 7.3.5. Industrial Chemicals
- 7.3.6. Polyether Polyols
- 7.3.7. Tobacco Humectants
- 7.3.8. Other Applications
- 7.1. Market Analysis, Insights and Forecast - by Grade
- 8. North America Glycerin Industry Analysis, Insights and Forecast, 2020-2032
- 8.1. Market Analysis, Insights and Forecast - by Grade
- 8.1.1. Crude Glycerin
- 8.1.2. Refined Glycerin
- 8.2. Market Analysis, Insights and Forecast - by Source
- 8.2.1. Biodiesels
- 8.2.2. Fatty Acids
- 8.2.3. Fatty Alcohols
- 8.2.4. Other Sources
- 8.3. Market Analysis, Insights and Forecast - by Application
- 8.3.1. Pharmaceuticals
- 8.3.2. Food and Beverage
- 8.3.3. Alkyd Resins
- 8.3.4. Personal Care and Cosmetics
- 8.3.5. Industrial Chemicals
- 8.3.6. Polyether Polyols
- 8.3.7. Tobacco Humectants
- 8.3.8. Other Applications
- 8.1. Market Analysis, Insights and Forecast - by Grade
- 9. Europe Glycerin Industry Analysis, Insights and Forecast, 2020-2032
- 9.1. Market Analysis, Insights and Forecast - by Grade
- 9.1.1. Crude Glycerin
- 9.1.2. Refined Glycerin
- 9.2. Market Analysis, Insights and Forecast - by Source
- 9.2.1. Biodiesels
- 9.2.2. Fatty Acids
- 9.2.3. Fatty Alcohols
- 9.2.4. Other Sources
- 9.3. Market Analysis, Insights and Forecast - by Application
- 9.3.1. Pharmaceuticals
- 9.3.2. Food and Beverage
- 9.3.3. Alkyd Resins
- 9.3.4. Personal Care and Cosmetics
- 9.3.5. Industrial Chemicals
- 9.3.6. Polyether Polyols
- 9.3.7. Tobacco Humectants
- 9.3.8. Other Applications
- 9.1. Market Analysis, Insights and Forecast - by Grade
- 10. South America Glycerin Industry Analysis, Insights and Forecast, 2020-2032
- 10.1. Market Analysis, Insights and Forecast - by Grade
- 10.1.1. Crude Glycerin
- 10.1.2. Refined Glycerin
- 10.2. Market Analysis, Insights and Forecast - by Source
- 10.2.1. Biodiesels
- 10.2.2. Fatty Acids
- 10.2.3. Fatty Alcohols
- 10.2.4. Other Sources
- 10.3. Market Analysis, Insights and Forecast - by Application
- 10.3.1. Pharmaceuticals
- 10.3.2. Food and Beverage
- 10.3.3. Alkyd Resins
- 10.3.4. Personal Care and Cosmetics
- 10.3.5. Industrial Chemicals
- 10.3.6. Polyether Polyols
- 10.3.7. Tobacco Humectants
- 10.3.8. Other Applications
- 10.1. Market Analysis, Insights and Forecast - by Grade
- 11. Middle East and Africa Glycerin Industry Analysis, Insights and Forecast, 2020-2032
- 11.1. Market Analysis, Insights and Forecast - by Grade
- 11.1.1. Crude Glycerin
- 11.1.2. Refined Glycerin
- 11.2. Market Analysis, Insights and Forecast - by Source
- 11.2.1. Biodiesels
- 11.2.2. Fatty Acids
- 11.2.3. Fatty Alcohols
- 11.2.4. Other Sources
- 11.3. Market Analysis, Insights and Forecast - by Application
- 11.3.1. Pharmaceuticals
- 11.3.2. Food and Beverage
- 11.3.3. Alkyd Resins
- 11.3.4. Personal Care and Cosmetics
- 11.3.5. Industrial Chemicals
- 11.3.6. Polyether Polyols
- 11.3.7. Tobacco Humectants
- 11.3.8. Other Applications
- 11.1. Market Analysis, Insights and Forecast - by Grade
- 12. Competitive Analysis
- 12.1. Company Profiles
- 12.1.1 Louis Dreyfus Company
- 12.1.1.1. Company Overview
- 12.1.1.2. Products
- 12.1.1.3. Company Financials
- 12.1.1.4. SWOT Analysis
- 12.1.2 Biodex-SA
- 12.1.2.1. Company Overview
- 12.1.2.2. Products
- 12.1.2.3. Company Financials
- 12.1.2.4. SWOT Analysis
- 12.1.3 Musim Mas
- 12.1.3.1. Company Overview
- 12.1.3.2. Products
- 12.1.3.3. Company Financials
- 12.1.3.4. SWOT Analysis
- 12.1.4 Cargill Incorporated
- 12.1.4.1. Company Overview
- 12.1.4.2. Products
- 12.1.4.3. Company Financials
- 12.1.4.4. SWOT Analysis
- 12.1.5 Thai Glycerine Co Ltd
- 12.1.5.1. Company Overview
- 12.1.5.2. Products
- 12.1.5.3. Company Financials
- 12.1.5.4. SWOT Analysis
- 12.1.6 RB FUELS
- 12.1.6.1. Company Overview
- 12.1.6.2. Products
- 12.1.6.3. Company Financials
- 12.1.6.4. SWOT Analysis
- 12.1.7 Vantage Specialty Chemicals
- 12.1.7.1. Company Overview
- 12.1.7.2. Products
- 12.1.7.3. Company Financials
- 12.1.7.4. SWOT Analysis
- 12.1.8 KLK OLEO
- 12.1.8.1. Company Overview
- 12.1.8.2. Products
- 12.1.8.3. Company Financials
- 12.1.8.4. SWOT Analysis
- 12.1.9 Sebacic India Limited
- 12.1.9.1. Company Overview
- 12.1.9.2. Products
- 12.1.9.3. Company Financials
- 12.1.9.4. SWOT Analysis
- 12.1.10 IOI Corporation Berhad
- 12.1.10.1. Company Overview
- 12.1.10.2. Products
- 12.1.10.3. Company Financials
- 12.1.10.4. SWOT Analysis
- 12.1.11 Wilmar International Ltd
- 12.1.11.1. Company Overview
- 12.1.11.2. Products
- 12.1.11.3. Company Financials
- 12.1.11.4. SWOT Analysis
- 12.1.12 P&G Chemicals
- 12.1.12.1. Company Overview
- 12.1.12.2. Products
- 12.1.12.3. Company Financials
- 12.1.12.4. SWOT Analysis
- 12.1.13 Archer Daniels Midland Company
- 12.1.13.1. Company Overview
- 12.1.13.2. Products
- 12.1.13.3. Company Financials
- 12.1.13.4. SWOT Analysis
- 12.1.14 Emery Oleochemicals
- 12.1.14.1. Company Overview
- 12.1.14.2. Products
- 12.1.14.3. Company Financials
- 12.1.14.4. SWOT Analysis
- 12.1.15 BASF SE
- 12.1.15.1. Company Overview
- 12.1.15.2. Products
- 12.1.15.3. Company Financials
- 12.1.15.4. SWOT Analysis
- 12.1.16 Dow
- 12.1.16.1. Company Overview
- 12.1.16.2. Products
- 12.1.16.3. Company Financials
- 12.1.16.4. SWOT Analysis
- 12.1.17 Munzer Bioindustrie GmbH
- 12.1.17.1. Company Overview
- 12.1.17.2. Products
- 12.1.17.3. Company Financials
- 12.1.17.4. SWOT Analysis
- 12.1.18 Godrej Industries Limited
- 12.1.18.1. Company Overview
- 12.1.18.2. Products
- 12.1.18.3. Company Financials
- 12.1.18.4. SWOT Analysis
- 12.1.19 Oleon NV
- 12.1.19.1. Company Overview
- 12.1.19.2. Products
- 12.1.19.3. Company Financials
- 12.1.19.4. SWOT Analysis
- 12.1.20 Vance Group Ltd
- 12.1.20.1. Company Overview
- 12.1.20.2. Products
- 12.1.20.3. Company Financials
- 12.1.20.4. SWOT Analysis
- 12.1.21 Kao Corporation
- 12.1.21.1. Company Overview
- 12.1.21.2. Products
- 12.1.21.3. Company Financials
- 12.1.21.4. SWOT Analysis
- 12.1.22 Aemetis
- 12.1.22.1. Company Overview
- 12.1.22.2. Products
- 12.1.22.3. Company Financials
- 12.1.22.4. SWOT Analysis
- 12.1.1 Louis Dreyfus Company
- 12.2. Market Entropy
- 12.2.1 Company's Key Areas Served
- 12.2.2 Recent Developments
- 12.3. Company Market Share Analysis 2025
- 12.3.1 Top 5 Companies Market Share Analysis
- 12.3.2 Top 3 Companies Market Share Analysis
- 12.4. List of Potential Customers
- 13. Research Methodology
List of Figures
- Figure 1: Global Glycerin Industry Revenue Breakdown (million, %) by Region 2025 & 2033
- Figure 2: Global Glycerin Industry Volume Breakdown (K Tons, %) by Region 2025 & 2033
- Figure 3: Asia Pacific Glycerin Industry Revenue (million), by Grade 2025 & 2033
- Figure 4: Asia Pacific Glycerin Industry Volume (K Tons), by Grade 2025 & 2033
- Figure 5: Asia Pacific Glycerin Industry Revenue Share (%), by Grade 2025 & 2033
- Figure 6: Asia Pacific Glycerin Industry Volume Share (%), by Grade 2025 & 2033
- Figure 7: Asia Pacific Glycerin Industry Revenue (million), by Source 2025 & 2033
- Figure 8: Asia Pacific Glycerin Industry Volume (K Tons), by Source 2025 & 2033
- Figure 9: Asia Pacific Glycerin Industry Revenue Share (%), by Source 2025 & 2033
- Figure 10: Asia Pacific Glycerin Industry Volume Share (%), by Source 2025 & 2033
- Figure 11: Asia Pacific Glycerin Industry Revenue (million), by Application 2025 & 2033
- Figure 12: Asia Pacific Glycerin Industry Volume (K Tons), by Application 2025 & 2033
- Figure 13: Asia Pacific Glycerin Industry Revenue Share (%), by Application 2025 & 2033
- Figure 14: Asia Pacific Glycerin Industry Volume Share (%), by Application 2025 & 2033
- Figure 15: Asia Pacific Glycerin Industry Revenue (million), by Country 2025 & 2033
- Figure 16: Asia Pacific Glycerin Industry Volume (K Tons), by Country 2025 & 2033
- Figure 17: Asia Pacific Glycerin Industry Revenue Share (%), by Country 2025 & 2033
- Figure 18: Asia Pacific Glycerin Industry Volume Share (%), by Country 2025 & 2033
- Figure 19: North America Glycerin Industry Revenue (million), by Grade 2025 & 2033
- Figure 20: North America Glycerin Industry Volume (K Tons), by Grade 2025 & 2033
- Figure 21: North America Glycerin Industry Revenue Share (%), by Grade 2025 & 2033
- Figure 22: North America Glycerin Industry Volume Share (%), by Grade 2025 & 2033
- Figure 23: North America Glycerin Industry Revenue (million), by Source 2025 & 2033
- Figure 24: North America Glycerin Industry Volume (K Tons), by Source 2025 & 2033
- Figure 25: North America Glycerin Industry Revenue Share (%), by Source 2025 & 2033
- Figure 26: North America Glycerin Industry Volume Share (%), by Source 2025 & 2033
- Figure 27: North America Glycerin Industry Revenue (million), by Application 2025 & 2033
- Figure 28: North America Glycerin Industry Volume (K Tons), by Application 2025 & 2033
- Figure 29: North America Glycerin Industry Revenue Share (%), by Application 2025 & 2033
- Figure 30: North America Glycerin Industry Volume Share (%), by Application 2025 & 2033
- Figure 31: North America Glycerin Industry Revenue (million), by Country 2025 & 2033
- Figure 32: North America Glycerin Industry Volume (K Tons), by Country 2025 & 2033
- Figure 33: North America Glycerin Industry Revenue Share (%), by Country 2025 & 2033
- Figure 34: North America Glycerin Industry Volume Share (%), by Country 2025 & 2033
- Figure 35: Europe Glycerin Industry Revenue (million), by Grade 2025 & 2033
- Figure 36: Europe Glycerin Industry Volume (K Tons), by Grade 2025 & 2033
- Figure 37: Europe Glycerin Industry Revenue Share (%), by Grade 2025 & 2033
- Figure 38: Europe Glycerin Industry Volume Share (%), by Grade 2025 & 2033
- Figure 39: Europe Glycerin Industry Revenue (million), by Source 2025 & 2033
- Figure 40: Europe Glycerin Industry Volume (K Tons), by Source 2025 & 2033
- Figure 41: Europe Glycerin Industry Revenue Share (%), by Source 2025 & 2033
- Figure 42: Europe Glycerin Industry Volume Share (%), by Source 2025 & 2033
- Figure 43: Europe Glycerin Industry Revenue (million), by Application 2025 & 2033
- Figure 44: Europe Glycerin Industry Volume (K Tons), by Application 2025 & 2033
- Figure 45: Europe Glycerin Industry Revenue Share (%), by Application 2025 & 2033
- Figure 46: Europe Glycerin Industry Volume Share (%), by Application 2025 & 2033
- Figure 47: Europe Glycerin Industry Revenue (million), by Country 2025 & 2033
- Figure 48: Europe Glycerin Industry Volume (K Tons), by Country 2025 & 2033
- Figure 49: Europe Glycerin Industry Revenue Share (%), by Country 2025 & 2033
- Figure 50: Europe Glycerin Industry Volume Share (%), by Country 2025 & 2033
- Figure 51: South America Glycerin Industry Revenue (million), by Grade 2025 & 2033
- Figure 52: South America Glycerin Industry Volume (K Tons), by Grade 2025 & 2033
- Figure 53: South America Glycerin Industry Revenue Share (%), by Grade 2025 & 2033
- Figure 54: South America Glycerin Industry Volume Share (%), by Grade 2025 & 2033
- Figure 55: South America Glycerin Industry Revenue (million), by Source 2025 & 2033
- Figure 56: South America Glycerin Industry Volume (K Tons), by Source 2025 & 2033
- Figure 57: South America Glycerin Industry Revenue Share (%), by Source 2025 & 2033
- Figure 58: South America Glycerin Industry Volume Share (%), by Source 2025 & 2033
- Figure 59: South America Glycerin Industry Revenue (million), by Application 2025 & 2033
- Figure 60: South America Glycerin Industry Volume (K Tons), by Application 2025 & 2033
- Figure 61: South America Glycerin Industry Revenue Share (%), by Application 2025 & 2033
- Figure 62: South America Glycerin Industry Volume Share (%), by Application 2025 & 2033
- Figure 63: South America Glycerin Industry Revenue (million), by Country 2025 & 2033
- Figure 64: South America Glycerin Industry Volume (K Tons), by Country 2025 & 2033
- Figure 65: South America Glycerin Industry Revenue Share (%), by Country 2025 & 2033
- Figure 66: South America Glycerin Industry Volume Share (%), by Country 2025 & 2033
- Figure 67: Middle East and Africa Glycerin Industry Revenue (million), by Grade 2025 & 2033
- Figure 68: Middle East and Africa Glycerin Industry Volume (K Tons), by Grade 2025 & 2033
- Figure 69: Middle East and Africa Glycerin Industry Revenue Share (%), by Grade 2025 & 2033
- Figure 70: Middle East and Africa Glycerin Industry Volume Share (%), by Grade 2025 & 2033
- Figure 71: Middle East and Africa Glycerin Industry Revenue (million), by Source 2025 & 2033
- Figure 72: Middle East and Africa Glycerin Industry Volume (K Tons), by Source 2025 & 2033
- Figure 73: Middle East and Africa Glycerin Industry Revenue Share (%), by Source 2025 & 2033
- Figure 74: Middle East and Africa Glycerin Industry Volume Share (%), by Source 2025 & 2033
- Figure 75: Middle East and Africa Glycerin Industry Revenue (million), by Application 2025 & 2033
- Figure 76: Middle East and Africa Glycerin Industry Volume (K Tons), by Application 2025 & 2033
- Figure 77: Middle East and Africa Glycerin Industry Revenue Share (%), by Application 2025 & 2033
- Figure 78: Middle East and Africa Glycerin Industry Volume Share (%), by Application 2025 & 2033
- Figure 79: Middle East and Africa Glycerin Industry Revenue (million), by Country 2025 & 2033
- Figure 80: Middle East and Africa Glycerin Industry Volume (K Tons), by Country 2025 & 2033
- Figure 81: Middle East and Africa Glycerin Industry Revenue Share (%), by Country 2025 & 2033
- Figure 82: Middle East and Africa Glycerin Industry Volume Share (%), by Country 2025 & 2033
List of Tables
- Table 1: Global Glycerin Industry Revenue million Forecast, by Grade 2020 & 2033
- Table 2: Global Glycerin Industry Volume K Tons Forecast, by Grade 2020 & 2033
- Table 3: Global Glycerin Industry Revenue million Forecast, by Source 2020 & 2033
- Table 4: Global Glycerin Industry Volume K Tons Forecast, by Source 2020 & 2033
- Table 5: Global Glycerin Industry Revenue million Forecast, by Application 2020 & 2033
- Table 6: Global Glycerin Industry Volume K Tons Forecast, by Application 2020 & 2033
- Table 7: Global Glycerin Industry Revenue million Forecast, by Region 2020 & 2033
- Table 8: Global Glycerin Industry Volume K Tons Forecast, by Region 2020 & 2033
- Table 9: Global Glycerin Industry Revenue million Forecast, by Grade 2020 & 2033
- Table 10: Global Glycerin Industry Volume K Tons Forecast, by Grade 2020 & 2033
- Table 11: Global Glycerin Industry Revenue million Forecast, by Source 2020 & 2033
- Table 12: Global Glycerin Industry Volume K Tons Forecast, by Source 2020 & 2033
- Table 13: Global Glycerin Industry Revenue million Forecast, by Application 2020 & 2033
- Table 14: Global Glycerin Industry Volume K Tons Forecast, by Application 2020 & 2033
- Table 15: Global Glycerin Industry Revenue million Forecast, by Country 2020 & 2033
- Table 16: Global Glycerin Industry Volume K Tons Forecast, by Country 2020 & 2033
- Table 17: China Glycerin Industry Revenue (million) Forecast, by Application 2020 & 2033
- Table 18: China Glycerin Industry Volume (K Tons) Forecast, by Application 2020 & 2033
- Table 19: India Glycerin Industry Revenue (million) Forecast, by Application 2020 & 2033
- Table 20: India Glycerin Industry Volume (K Tons) Forecast, by Application 2020 & 2033
- Table 21: Japan Glycerin Industry Revenue (million) Forecast, by Application 2020 & 2033
- Table 22: Japan Glycerin Industry Volume (K Tons) Forecast, by Application 2020 & 2033
- Table 23: South Korea Glycerin Industry Revenue (million) Forecast, by Application 2020 & 2033
- Table 24: South Korea Glycerin Industry Volume (K Tons) Forecast, by Application 2020 & 2033
- Table 25: Rest of Asia Pacific Glycerin Industry Revenue (million) Forecast, by Application 2020 & 2033
- Table 26: Rest of Asia Pacific Glycerin Industry Volume (K Tons) Forecast, by Application 2020 & 2033
- Table 27: Global Glycerin Industry Revenue million Forecast, by Grade 2020 & 2033
- Table 28: Global Glycerin Industry Volume K Tons Forecast, by Grade 2020 & 2033
- Table 29: Global Glycerin Industry Revenue million Forecast, by Source 2020 & 2033
- Table 30: Global Glycerin Industry Volume K Tons Forecast, by Source 2020 & 2033
- Table 31: Global Glycerin Industry Revenue million Forecast, by Application 2020 & 2033
- Table 32: Global Glycerin Industry Volume K Tons Forecast, by Application 2020 & 2033
- Table 33: Global Glycerin Industry Revenue million Forecast, by Country 2020 & 2033
- Table 34: Global Glycerin Industry Volume K Tons Forecast, by Country 2020 & 2033
- Table 35: United States Glycerin Industry Revenue (million) Forecast, by Application 2020 & 2033
- Table 36: United States Glycerin Industry Volume (K Tons) Forecast, by Application 2020 & 2033
- Table 37: Canada Glycerin Industry Revenue (million) Forecast, by Application 2020 & 2033
- Table 38: Canada Glycerin Industry Volume (K Tons) Forecast, by Application 2020 & 2033
- Table 39: Mexico Glycerin Industry Revenue (million) Forecast, by Application 2020 & 2033
- Table 40: Mexico Glycerin Industry Volume (K Tons) Forecast, by Application 2020 & 2033
- Table 41: Rest of North America Glycerin Industry Revenue (million) Forecast, by Application 2020 & 2033
- Table 42: Rest of North America Glycerin Industry Volume (K Tons) Forecast, by Application 2020 & 2033
- Table 43: Global Glycerin Industry Revenue million Forecast, by Grade 2020 & 2033
- Table 44: Global Glycerin Industry Volume K Tons Forecast, by Grade 2020 & 2033
- Table 45: Global Glycerin Industry Revenue million Forecast, by Source 2020 & 2033
- Table 46: Global Glycerin Industry Volume K Tons Forecast, by Source 2020 & 2033
- Table 47: Global Glycerin Industry Revenue million Forecast, by Application 2020 & 2033
- Table 48: Global Glycerin Industry Volume K Tons Forecast, by Application 2020 & 2033
- Table 49: Global Glycerin Industry Revenue million Forecast, by Country 2020 & 2033
- Table 50: Global Glycerin Industry Volume K Tons Forecast, by Country 2020 & 2033
- Table 51: Germany Glycerin Industry Revenue (million) Forecast, by Application 2020 & 2033
- Table 52: Germany Glycerin Industry Volume (K Tons) Forecast, by Application 2020 & 2033
- Table 53: United Kingdom Glycerin Industry Revenue (million) Forecast, by Application 2020 & 2033
- Table 54: United Kingdom Glycerin Industry Volume (K Tons) Forecast, by Application 2020 & 2033
- Table 55: Italy Glycerin Industry Revenue (million) Forecast, by Application 2020 & 2033
- Table 56: Italy Glycerin Industry Volume (K Tons) Forecast, by Application 2020 & 2033
- Table 57: France Glycerin Industry Revenue (million) Forecast, by Application 2020 & 2033
- Table 58: France Glycerin Industry Volume (K Tons) Forecast, by Application 2020 & 2033
- Table 59: Rest of Europe Glycerin Industry Revenue (million) Forecast, by Application 2020 & 2033
- Table 60: Rest of Europe Glycerin Industry Volume (K Tons) Forecast, by Application 2020 & 2033
- Table 61: Global Glycerin Industry Revenue million Forecast, by Grade 2020 & 2033
- Table 62: Global Glycerin Industry Volume K Tons Forecast, by Grade 2020 & 2033
- Table 63: Global Glycerin Industry Revenue million Forecast, by Source 2020 & 2033
- Table 64: Global Glycerin Industry Volume K Tons Forecast, by Source 2020 & 2033
- Table 65: Global Glycerin Industry Revenue million Forecast, by Application 2020 & 2033
- Table 66: Global Glycerin Industry Volume K Tons Forecast, by Application 2020 & 2033
- Table 67: Global Glycerin Industry Revenue million Forecast, by Country 2020 & 2033
- Table 68: Global Glycerin Industry Volume K Tons Forecast, by Country 2020 & 2033
- Table 69: Brazil Glycerin Industry Revenue (million) Forecast, by Application 2020 & 2033
- Table 70: Brazil Glycerin Industry Volume (K Tons) Forecast, by Application 2020 & 2033
- Table 71: Argentina Glycerin Industry Revenue (million) Forecast, by Application 2020 & 2033
- Table 72: Argentina Glycerin Industry Volume (K Tons) Forecast, by Application 2020 & 2033
- Table 73: Rest of South America Glycerin Industry Revenue (million) Forecast, by Application 2020 & 2033
- Table 74: Rest of South America Glycerin Industry Volume (K Tons) Forecast, by Application 2020 & 2033
- Table 75: Global Glycerin Industry Revenue million Forecast, by Grade 2020 & 2033
- Table 76: Global Glycerin Industry Volume K Tons Forecast, by Grade 2020 & 2033
- Table 77: Global Glycerin Industry Revenue million Forecast, by Source 2020 & 2033
- Table 78: Global Glycerin Industry Volume K Tons Forecast, by Source 2020 & 2033
- Table 79: Global Glycerin Industry Revenue million Forecast, by Application 2020 & 2033
- Table 80: Global Glycerin Industry Volume K Tons Forecast, by Application 2020 & 2033
- Table 81: Global Glycerin Industry Revenue million Forecast, by Country 2020 & 2033
- Table 82: Global Glycerin Industry Volume K Tons Forecast, by Country 2020 & 2033
- Table 83: Saudi Arabia Glycerin Industry Revenue (million) Forecast, by Application 2020 & 2033
- Table 84: Saudi Arabia Glycerin Industry Volume (K Tons) Forecast, by Application 2020 & 2033
- Table 85: South Africa Glycerin Industry Revenue (million) Forecast, by Application 2020 & 2033
- Table 86: South Africa Glycerin Industry Volume (K Tons) Forecast, by Application 2020 & 2033
- Table 87: United Arab Emirates Glycerin Industry Revenue (million) Forecast, by Application 2020 & 2033
- Table 88: United Arab Emirates Glycerin Industry Volume (K Tons) Forecast, by Application 2020 & 2033
- Table 89: Rest of Middle East and Africa Glycerin Industry Revenue (million) Forecast, by Application 2020 & 2033
- Table 90: Rest of Middle East and Africa Glycerin Industry Volume (K Tons) Forecast, by Application 2020 & 2033
Frequently Asked Questions
1. What is the projected Compound Annual Growth Rate (CAGR) of the Glycerin Industry?
The projected CAGR is approximately 4.5%.
2. Which companies are prominent players in the Glycerin Industry?
Key companies in the market include Louis Dreyfus Company, Biodex-SA, Musim Mas, Cargill Incorporated, Thai Glycerine Co Ltd, RB FUELS, Vantage Specialty Chemicals, KLK OLEO, Sebacic India Limited, IOI Corporation Berhad, Wilmar International Ltd, P&G Chemicals, Archer Daniels Midland Company, Emery Oleochemicals, BASF SE, Dow, Munzer Bioindustrie GmbH, Godrej Industries Limited, Oleon NV, Vance Group Ltd, Kao Corporation, Aemetis.
3. What are the main segments of the Glycerin Industry?
The market segments include Grade, Source, Application.
4. Can you provide details about the market size?
The market size is estimated to be USD 4.78 million as of 2022.
5. What are some drivers contributing to market growth?
Strong Demand from the Pharmaceutical Industry; Increasing Use in the Personal Care and Cosmetics Industries.
6. What are the notable trends driving market growth?
Personal Care and Cosmetics Application to Dominate the Market Growth.
7. Are there any restraints impacting market growth?
Availability of Substitutes; Other Restraints.
8. Can you provide examples of recent developments in the market?
In December 2022, Oleochemical producer Oleon announced the acquisition of a blending plant in Conroe, Texas, by investing USD 50 million. The company strengthened its oleochemicals division which includes the production of glycerin.
9. What pricing options are available for accessing the report?
Pricing options include single-user, multi-user, and enterprise licenses priced at USD 4750, USD 5250, and USD 8750 respectively.
10. Is the market size provided in terms of value or volume?
The market size is provided in terms of value, measured in million and volume, measured in K Tons.
11. Are there any specific market keywords associated with the report?
Yes, the market keyword associated with the report is "Glycerin Industry," which aids in identifying and referencing the specific market segment covered.
12. How do I determine which pricing option suits my needs best?
The pricing options vary based on user requirements and access needs. Individual users may opt for single-user licenses, while businesses requiring broader access may choose multi-user or enterprise licenses for cost-effective access to the report.
13. Are there any additional resources or data provided in the Glycerin Industry report?
While the report offers comprehensive insights, it's advisable to review the specific contents or supplementary materials provided to ascertain if additional resources or data are available.
14. How can I stay updated on further developments or reports in the Glycerin Industry?
To stay informed about further developments, trends, and reports in the Glycerin Industry, consider subscribing to industry newsletters, following relevant companies and organizations, or regularly checking reputable industry news sources and publications.
Methodology
Step 1 - Identification of Relevant Samples Size from Population Database


Step 2 - Approaches for Defining Global Market Size (Value, Volume* & Price*)

Note*: In applicable scenarios
Step 3 - Data Sources
Primary Research
- Web Analytics
- Survey Reports
- Research Institute
- Latest Research Reports
- Opinion Leaders
Secondary Research
- Annual Reports
- White Paper
- Latest Press Release
- Industry Association
- Paid Database
- Investor Presentations

Step 4 - Data Triangulation
Involves using different sources of information in order to increase the validity of a study
These sources are likely to be stakeholders in a program - participants, other researchers, program staff, other community members, and so on.
Then we put all data in single framework & apply various statistical tools to find out the dynamic on the market.
During the analysis stage, feedback from the stakeholder groups would be compared to determine areas of agreement as well as areas of divergence