

Key Insights
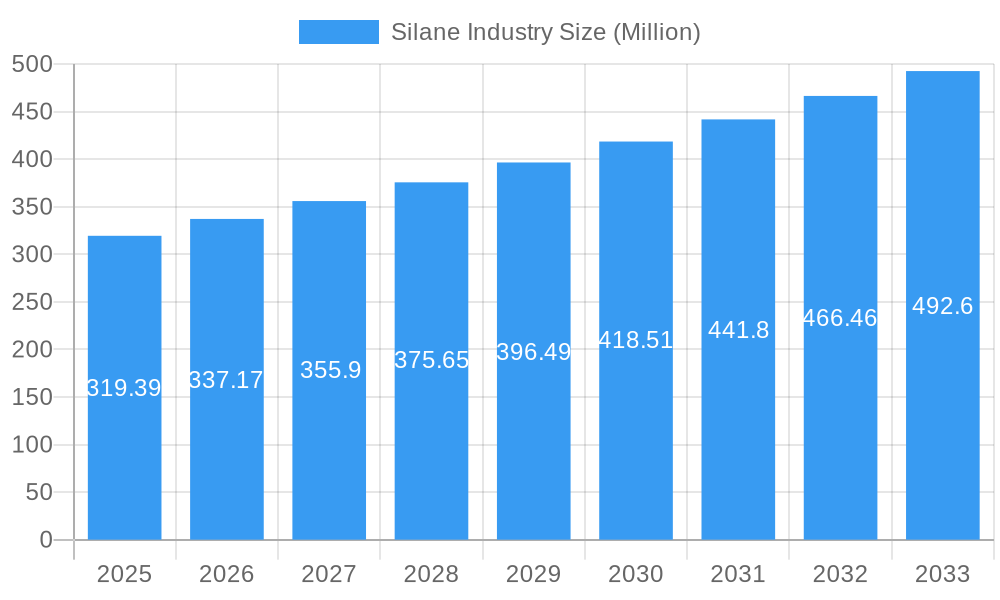
The global silane market is experiencing robust growth, projected to reach $319.39 million in 2025, with a compelling Compound Annual Growth Rate (CAGR) of 5.7% through 2033. This expansion is fueled by a confluence of significant market drivers and evolving industry trends. The increasing demand for high-performance materials across diverse sectors, including plastics, rubber, composites, building & construction, and paints & coatings, is a primary catalyst. Silanes, acting as crucial coupling agents and surface modifiers, enhance the properties of these materials, leading to improved durability, strength, and adhesion. The burgeoning construction industry, particularly in emerging economies, coupled with the automotive sector's continuous push for lighter and more fuel-efficient vehicles, further propels the adoption of silane-treated materials. Advancements in specialty silanes, such as epoxy and methacryloxy silanes, catering to niche applications in electronics and pharmaceuticals, are also contributing to market dynamism.
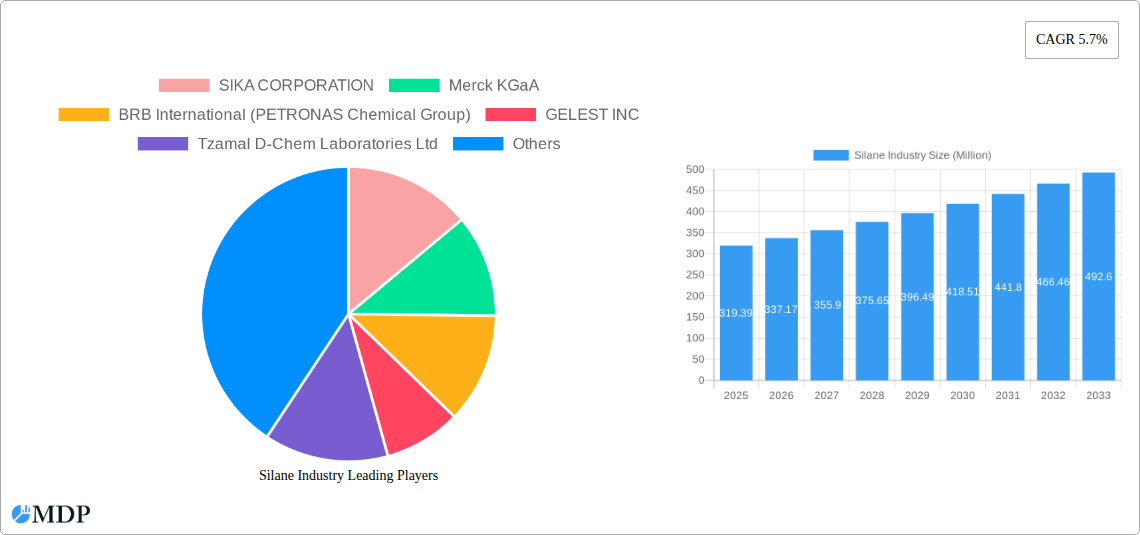
Silane Industry Market Size (In Million)
The market's upward trajectory is further supported by ongoing technological innovations and a growing emphasis on sustainable material solutions. The development of advanced silane chemistries that offer enhanced functionality and environmental benefits is creating new opportunities. Furthermore, the widespread application of silanes as adhesion promoters and crosslinking agents in advanced polymers and composites is a key trend. However, certain factors can temper this growth. Fluctuations in raw material prices, particularly those associated with silicon and organic precursors, can impact production costs. Stringent environmental regulations regarding the production and disposal of certain chemicals may also pose challenges. Despite these restraints, the inherent versatility and performance-enhancing capabilities of silanes position the market for sustained and significant growth, driven by both established applications and the emergence of novel uses in cutting-edge industries.
Silane Industry Company Market Share
Silane Industry Market Report: Unlocking Growth & Innovation
Unlock critical insights into the global Silane Industry with this comprehensive market research report. Delve into the market dynamics, emerging trends, and strategic opportunities shaping this vital sector from 2019 to 2033, with a base year of 2025. This in-depth analysis provides actionable intelligence for manufacturers, suppliers, investors, and stakeholders seeking to navigate the complexities of the silane market. Discover how advancements in silicone chemistry are driving innovation across diverse applications, from advanced plastics and high-performance coatings to critical semiconductor manufacturing.
Silane Industry Market Dynamics & Concentration
The global silane market, projected to reach $XX Million by 2025, exhibits moderate to high concentration, with key players like Shin-Etsu Chemical Co Ltd, Wacker Chemie AG, and Dow holding significant market share. Innovation drivers are largely centered on developing silanes with enhanced performance characteristics, improved environmental profiles, and cost-effectiveness. Regulatory frameworks, particularly concerning VOC emissions and chemical safety, are increasingly influencing product development and market access. While direct product substitutes are limited, alternative chemistries in specific niche applications can pose indirect competition. End-user trends showcase a growing demand for high-performance materials in sectors like automotive, construction, and electronics, directly fueling silane consumption. Mergers and acquisitions (M&A) activity, with XX deals recorded in the historical period (2019-2024), are driven by the pursuit of technological synergies, market expansion, and enhanced production capacities.
Silane Industry Industry Trends & Analysis
The Silane Industry is experiencing robust growth, driven by its indispensable role as coupling agents, crosslinkers, and surface modifiers across a multitude of industrial applications. The projected Compound Annual Growth Rate (CAGR) for the forecast period (2025–2033) is XX%, reflecting a dynamic market landscape. Technological disruptions are primarily focused on developing novel silane chemistries that offer enhanced durability, thermal resistance, and adhesion properties. Consumer preferences are increasingly leaning towards sustainable and eco-friendly solutions, prompting manufacturers to invest in greener production processes and bio-based silane alternatives. The competitive dynamics are characterized by continuous product innovation, strategic partnerships, and a keen focus on cost optimization. Market penetration is expanding significantly in emerging economies, driven by industrialization and the growing adoption of advanced materials. The demand for silanes in the automotive sector, particularly for lightweighting and electric vehicle battery components, is a significant growth catalyst. Furthermore, the expanding construction industry, with its increasing reliance on high-performance sealants and coatings, is another key driver of market expansion. The pharmaceutical and semiconductor industries are also witnessing a surge in demand for highly pure and specialized silane derivatives, contributing to overall market growth. The historical period (2019-2024) saw a steady increase in global silane production, with significant investments in R&D leading to the introduction of next-generation silane products.
Leading Markets & Segments in Silane Industry
The Asia-Pacific region currently dominates the Silane Industry, with China leading the charge due to its extensive manufacturing base and robust demand from key end-use sectors. Economic policies promoting industrial growth and significant investments in infrastructure development are key drivers behind this regional dominance.
Dominant Type Segments:
- Alkyl Silanes: Crucial for hydrophobic treatments and as intermediates in silicone production, alkyl silanes command a significant market share due to their versatility.
- Vinyl Silanes: Essential for crosslinking in rubber and plastics, their demand is directly linked to the growth of the automotive and tire industries.
- Amino Silanes: Widely used as coupling agents to improve the adhesion between organic polymers and inorganic substrates, particularly in composites and coatings.
Dominant Application Segments:
- Plastics, Rubber, and Composites: This segment is the largest consumer of silanes, leveraging their ability to enhance mechanical properties, thermal stability, and processing efficiency. The increasing use of composite materials in aerospace, automotive, and wind energy applications is a key driver.
- Paints & Coatings: Silanes are vital for improving adhesion, durability, scratch resistance, and weatherability of coatings, catering to both industrial and decorative applications.
- Adhesives & Sealants: Their role as coupling agents enhances the bonding strength and longevity of adhesives and sealants, particularly in demanding construction and automotive environments.
The dominance of these segments is further reinforced by the growing demand for high-performance materials in infrastructure projects, advancements in manufacturing technologies, and the continuous pursuit of enhanced product functionalities across various industries. The ongoing expansion of the electronics sector, particularly in Asia, also fuels the demand for specialized silanes used in semiconductor manufacturing and advanced packaging.
Silane Industry Product Developments
Product innovation in the Silane Industry is intensely focused on developing high-purity, custom-synthesized silanes for specialized applications. Key advancements include novel silanes with improved thermal stability for high-temperature electronics, advanced coupling agents that enhance the performance of bio-based composites, and eco-friendly silane formulations with reduced VOC content for paints and coatings. These developments offer competitive advantages by enabling manufacturers to meet stringent industry regulations, improve end-product performance, and cater to the growing demand for sustainable solutions. For instance, the development of new methacryloxy silanes is revolutionizing the dental and medical device industries, offering enhanced biocompatibility and mechanical strength.
Key Drivers of Silane Industry Growth
The Silane Industry's growth is propelled by a confluence of factors. Technological advancements in silicone chemistry are enabling the development of specialized silanes with enhanced functionalities, such as improved adhesion, thermal resistance, and UV stability. The burgeoning demand for advanced materials in key end-use industries like automotive (lightweighting, EV batteries), construction (high-performance sealants, coatings), and electronics (semiconductors, advanced packaging) acts as a significant economic driver. Furthermore, increasingly stringent environmental regulations are pushing for the adoption of high-performance, durable materials, indirectly boosting silane consumption. Government initiatives supporting innovation and manufacturing in sectors like renewable energy (e.g., solar panel coatings) and electric vehicles are also crucial growth catalysts.
Challenges in the Silane Industry Market
Despite its robust growth, the Silane Industry faces several challenges. Stringent environmental regulations and evolving safety standards can lead to increased compliance costs and necessitate significant R&D investments for product reformulation. Supply chain disruptions, particularly for key raw materials, can impact production volumes and price stability. Intense competition among established players and the emergence of new entrants can exert downward pressure on profit margins. Additionally, the relatively complex synthesis processes for certain specialized silanes can pose manufacturing hurdles and affect scalability, leading to potential price volatility for niche products.
Emerging Opportunities in Silane Industry
Emerging opportunities in the Silane Industry are primarily driven by technological breakthroughs and expanding market applications. The growing demand for sustainable and bio-based materials presents significant potential for the development of eco-friendly silane coupling agents and surface modifiers. Strategic partnerships between silane manufacturers and end-users in sectors like renewable energy, electric vehicles, and advanced healthcare are expected to foster innovation and accelerate market adoption. Furthermore, the increasing adoption of advanced manufacturing techniques, such as 3D printing, is opening new avenues for silane-based materials with tailored properties. Expansion into untapped geographical markets with a growing industrial base also represents a key long-term growth strategy.
Leading Players in the Silane Industry Sector
- SIKA CORPORATION
- Merck KGaA
- BRB International (PETRONAS Chemical Group)
- GELEST INC
- Tzamal D-Chem Laboratories Ltd
- Momentive
- Genesee Polymers Corporation
- Dow
- Alfa Aesar (Thermo Fisher Scientific)
- Shin-Etsu Chemical Co Ltd
- Prochimia Surfaces
- United Chemical Technologies
- Wacker Chemie AG
- Evonik
Key Milestones in Silane Industry Industry
- 2019: Introduction of novel organosilane coupling agents with enhanced UV resistance for automotive coatings.
- 2020: Major investment by Shin-Etsu Chemical in expanding its silane production capacity to meet growing demand from the electronics sector.
- 2021: Wacker Chemie AG launches a new range of bio-based silanes, catering to the growing demand for sustainable chemical solutions.
- 2022: Dow announces a strategic partnership with a leading composite manufacturer to develop advanced silane-modified resins for lightweight aerospace components.
- 2023: Evonik introduces a new generation of silanes for 3D printing applications, enabling higher precision and material performance.
- 2024: Significant regulatory shifts in Europe regarding VOC emissions drive increased demand for low-VOC silane-based coatings.
Strategic Outlook for Silane Industry Market
The strategic outlook for the Silane Industry remains highly positive, characterized by sustained growth and evolving market demands. Key growth accelerators will include the continued innovation in high-performance silanes tailored for emerging technologies such as electric vehicles, renewable energy infrastructure, and advanced semiconductor manufacturing. Strategic alliances and collaborations between material science companies and end-product manufacturers will be crucial for co-developing customized solutions and accelerating market penetration. The increasing emphasis on sustainability will also drive the development and adoption of eco-friendly silane products and manufacturing processes. Geographic expansion into rapidly industrializing regions and a focus on niche, high-value applications will further solidify the industry's growth trajectory.
Silane Industry Segmentation
-
1. Type
- 1.1. Alkyl
- 1.2. Amino
- 1.3. Epoxy
- 1.4. Methacryloxy
- 1.5. Phenyl
- 1.6. Vinyl
- 1.7. Others
-
2. Application
- 2.1. Plastics, Rubber and Composites
- 2.2. Building & Construction
- 2.3. Paints & Coatings
- 2.4. Adhesives & Sealants
- 2.5. Mineral & Filler Treatment
- 2.6. Others (Semi-Conductors, Pharmaceutical, etc.,)
Silane Industry Segmentation By Geography
-
1. Asia Pacific
- 1.1. China
- 1.2. India
- 1.3. Japan
- 1.4. South Korea
- 1.5. Rest of Asia Pacific
-
2. North America
- 2.1. United States
- 2.2. Canada
- 2.3. Mexico
-
3. Europe
- 3.1. Germany
- 3.2. United Kingdom
- 3.3. Italy
- 3.4. France
- 3.5. Rest of Europe
-
4. South America
- 4.1. Brazil
- 4.2. Argentina
- 4.3. Rest of South America
-
5. Middle East and Africa
- 5.1. Saudi Arabia
- 5.2. South Africa
- 5.3. Rest of Middle East and Africa
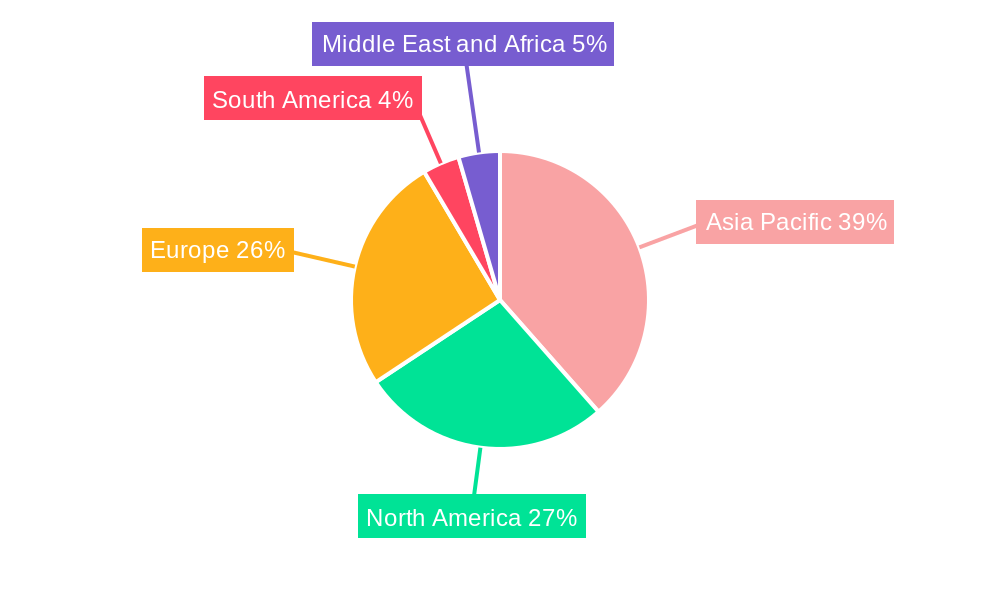
Silane Industry Regional Market Share
Geographic Coverage of Silane Industry
Silane Industry REPORT HIGHLIGHTS
| Aspects | Details |
|---|---|
| Study Period | 2020-2034 |
| Base Year | 2025 |
| Estimated Year | 2026 |
| Forecast Period | 2026-2034 |
| Historical Period | 2020-2025 |
| Growth Rate | CAGR of 5.7% from 2020-2034 |
| Segmentation |
|
Table of Contents
- 1. Introduction
- 1.1. Research Scope
- 1.2. Market Segmentation
- 1.3. Research Objective
- 1.4. Definitions and Assumptions
- 2. Executive Summary
- 2.1. Market Snapshot
- 3. Market Dynamics
- 3.1. Market Drivers
- 3.2. Market Restrains
- 3.3. Market Trends
- 3.4. Market Opportunities
- 4. Market Factor Analysis
- 4.1. Porters Five Forces
- 4.1.1. Bargaining Power of Suppliers
- 4.1.2. Bargaining Power of Buyers
- 4.1.3. Threat of New Entrants
- 4.1.4. Threat of Substitutes
- 4.1.5. Competitive Rivalry
- 4.2. PESTEL analysis
- 4.3. BCG Analysis
- 4.3.1. Stars (High Growth, High Market Share)
- 4.3.2. Cash Cows (Low Growth, High Market Share)
- 4.3.3. Question Mark (High Growth, Low Market Share)
- 4.3.4. Dogs (Low Growth, Low Market Share)
- 4.4. Ansoff Matrix Analysis
- 4.5. Supply Chain Analysis
- 4.6. Regulatory Landscape
- 4.7. Current Market Potential and Opportunity Assessment (TAM–SAM–SOM Framework)
- 4.8. MDP Analyst Note
- 4.1. Porters Five Forces
- 5. Market Analysis, Insights and Forecast 2021-2033
- 5.1. Market Analysis, Insights and Forecast - by Type
- 5.1.1. Alkyl
- 5.1.2. Amino
- 5.1.3. Epoxy
- 5.1.4. Methacryloxy
- 5.1.5. Phenyl
- 5.1.6. Vinyl
- 5.1.7. Others
- 5.2. Market Analysis, Insights and Forecast - by Application
- 5.2.1. Plastics, Rubber and Composites
- 5.2.2. Building & Construction
- 5.2.3. Paints & Coatings
- 5.2.4. Adhesives & Sealants
- 5.2.5. Mineral & Filler Treatment
- 5.2.6. Others (Semi-Conductors, Pharmaceutical, etc.,)
- 5.3. Market Analysis, Insights and Forecast - by Region
- 5.3.1. Asia Pacific
- 5.3.2. North America
- 5.3.3. Europe
- 5.3.4. South America
- 5.3.5. Middle East and Africa
- 5.1. Market Analysis, Insights and Forecast - by Type
- 6. Global Silane Industry Analysis, Insights and Forecast, 2021-2033
- 6.1. Market Analysis, Insights and Forecast - by Type
- 6.1.1. Alkyl
- 6.1.2. Amino
- 6.1.3. Epoxy
- 6.1.4. Methacryloxy
- 6.1.5. Phenyl
- 6.1.6. Vinyl
- 6.1.7. Others
- 6.2. Market Analysis, Insights and Forecast - by Application
- 6.2.1. Plastics, Rubber and Composites
- 6.2.2. Building & Construction
- 6.2.3. Paints & Coatings
- 6.2.4. Adhesives & Sealants
- 6.2.5. Mineral & Filler Treatment
- 6.2.6. Others (Semi-Conductors, Pharmaceutical, etc.,)
- 6.1. Market Analysis, Insights and Forecast - by Type
- 7. Asia Pacific Silane Industry Analysis, Insights and Forecast, 2020-2032
- 7.1. Market Analysis, Insights and Forecast - by Type
- 7.1.1. Alkyl
- 7.1.2. Amino
- 7.1.3. Epoxy
- 7.1.4. Methacryloxy
- 7.1.5. Phenyl
- 7.1.6. Vinyl
- 7.1.7. Others
- 7.2. Market Analysis, Insights and Forecast - by Application
- 7.2.1. Plastics, Rubber and Composites
- 7.2.2. Building & Construction
- 7.2.3. Paints & Coatings
- 7.2.4. Adhesives & Sealants
- 7.2.5. Mineral & Filler Treatment
- 7.2.6. Others (Semi-Conductors, Pharmaceutical, etc.,)
- 7.1. Market Analysis, Insights and Forecast - by Type
- 8. North America Silane Industry Analysis, Insights and Forecast, 2020-2032
- 8.1. Market Analysis, Insights and Forecast - by Type
- 8.1.1. Alkyl
- 8.1.2. Amino
- 8.1.3. Epoxy
- 8.1.4. Methacryloxy
- 8.1.5. Phenyl
- 8.1.6. Vinyl
- 8.1.7. Others
- 8.2. Market Analysis, Insights and Forecast - by Application
- 8.2.1. Plastics, Rubber and Composites
- 8.2.2. Building & Construction
- 8.2.3. Paints & Coatings
- 8.2.4. Adhesives & Sealants
- 8.2.5. Mineral & Filler Treatment
- 8.2.6. Others (Semi-Conductors, Pharmaceutical, etc.,)
- 8.1. Market Analysis, Insights and Forecast - by Type
- 9. Europe Silane Industry Analysis, Insights and Forecast, 2020-2032
- 9.1. Market Analysis, Insights and Forecast - by Type
- 9.1.1. Alkyl
- 9.1.2. Amino
- 9.1.3. Epoxy
- 9.1.4. Methacryloxy
- 9.1.5. Phenyl
- 9.1.6. Vinyl
- 9.1.7. Others
- 9.2. Market Analysis, Insights and Forecast - by Application
- 9.2.1. Plastics, Rubber and Composites
- 9.2.2. Building & Construction
- 9.2.3. Paints & Coatings
- 9.2.4. Adhesives & Sealants
- 9.2.5. Mineral & Filler Treatment
- 9.2.6. Others (Semi-Conductors, Pharmaceutical, etc.,)
- 9.1. Market Analysis, Insights and Forecast - by Type
- 10. South America Silane Industry Analysis, Insights and Forecast, 2020-2032
- 10.1. Market Analysis, Insights and Forecast - by Type
- 10.1.1. Alkyl
- 10.1.2. Amino
- 10.1.3. Epoxy
- 10.1.4. Methacryloxy
- 10.1.5. Phenyl
- 10.1.6. Vinyl
- 10.1.7. Others
- 10.2. Market Analysis, Insights and Forecast - by Application
- 10.2.1. Plastics, Rubber and Composites
- 10.2.2. Building & Construction
- 10.2.3. Paints & Coatings
- 10.2.4. Adhesives & Sealants
- 10.2.5. Mineral & Filler Treatment
- 10.2.6. Others (Semi-Conductors, Pharmaceutical, etc.,)
- 10.1. Market Analysis, Insights and Forecast - by Type
- 11. Middle East and Africa Silane Industry Analysis, Insights and Forecast, 2020-2032
- 11.1. Market Analysis, Insights and Forecast - by Type
- 11.1.1. Alkyl
- 11.1.2. Amino
- 11.1.3. Epoxy
- 11.1.4. Methacryloxy
- 11.1.5. Phenyl
- 11.1.6. Vinyl
- 11.1.7. Others
- 11.2. Market Analysis, Insights and Forecast - by Application
- 11.2.1. Plastics, Rubber and Composites
- 11.2.2. Building & Construction
- 11.2.3. Paints & Coatings
- 11.2.4. Adhesives & Sealants
- 11.2.5. Mineral & Filler Treatment
- 11.2.6. Others (Semi-Conductors, Pharmaceutical, etc.,)
- 11.1. Market Analysis, Insights and Forecast - by Type
- 12. Competitive Analysis
- 12.1. Company Profiles
- 12.1.1 SIKA CORPORATION
- 12.1.1.1. Company Overview
- 12.1.1.2. Products
- 12.1.1.3. Company Financials
- 12.1.1.4. SWOT Analysis
- 12.1.2 Merck KGaA
- 12.1.2.1. Company Overview
- 12.1.2.2. Products
- 12.1.2.3. Company Financials
- 12.1.2.4. SWOT Analysis
- 12.1.3 BRB International (PETRONAS Chemical Group)
- 12.1.3.1. Company Overview
- 12.1.3.2. Products
- 12.1.3.3. Company Financials
- 12.1.3.4. SWOT Analysis
- 12.1.4 GELEST INC
- 12.1.4.1. Company Overview
- 12.1.4.2. Products
- 12.1.4.3. Company Financials
- 12.1.4.4. SWOT Analysis
- 12.1.5 Tzamal D-Chem Laboratories Ltd
- 12.1.5.1. Company Overview
- 12.1.5.2. Products
- 12.1.5.3. Company Financials
- 12.1.5.4. SWOT Analysis
- 12.1.6 Momentive
- 12.1.6.1. Company Overview
- 12.1.6.2. Products
- 12.1.6.3. Company Financials
- 12.1.6.4. SWOT Analysis
- 12.1.7 Genesee Polymers Corporation
- 12.1.7.1. Company Overview
- 12.1.7.2. Products
- 12.1.7.3. Company Financials
- 12.1.7.4. SWOT Analysis
- 12.1.8 Dow
- 12.1.8.1. Company Overview
- 12.1.8.2. Products
- 12.1.8.3. Company Financials
- 12.1.8.4. SWOT Analysis
- 12.1.9 Alfa Aesar (Thermo Fisher Scientific)
- 12.1.9.1. Company Overview
- 12.1.9.2. Products
- 12.1.9.3. Company Financials
- 12.1.9.4. SWOT Analysis
- 12.1.10 Shin-Etsu Chemical Co Ltd
- 12.1.10.1. Company Overview
- 12.1.10.2. Products
- 12.1.10.3. Company Financials
- 12.1.10.4. SWOT Analysis
- 12.1.11 Prochimia Surfaces
- 12.1.11.1. Company Overview
- 12.1.11.2. Products
- 12.1.11.3. Company Financials
- 12.1.11.4. SWOT Analysis
- 12.1.12 United Chemical Technologies
- 12.1.12.1. Company Overview
- 12.1.12.2. Products
- 12.1.12.3. Company Financials
- 12.1.12.4. SWOT Analysis
- 12.1.13 Wacker Chemie AG
- 12.1.13.1. Company Overview
- 12.1.13.2. Products
- 12.1.13.3. Company Financials
- 12.1.13.4. SWOT Analysis
- 12.1.14 Evonik
- 12.1.14.1. Company Overview
- 12.1.14.2. Products
- 12.1.14.3. Company Financials
- 12.1.14.4. SWOT Analysis
- 12.1.1 SIKA CORPORATION
- 12.2. Market Entropy
- 12.2.1 Company's Key Areas Served
- 12.2.2 Recent Developments
- 12.3. Company Market Share Analysis 2025
- 12.3.1 Top 5 Companies Market Share Analysis
- 12.3.2 Top 3 Companies Market Share Analysis
- 12.4. List of Potential Customers
- 13. Research Methodology
List of Figures
- Figure 1: Global Silane Industry Revenue Breakdown (Million, %) by Region 2025 & 2033
- Figure 2: Global Silane Industry Volume Breakdown (K Tons, %) by Region 2025 & 2033
- Figure 3: Asia Pacific Silane Industry Revenue (Million), by Type 2025 & 2033
- Figure 4: Asia Pacific Silane Industry Volume (K Tons), by Type 2025 & 2033
- Figure 5: Asia Pacific Silane Industry Revenue Share (%), by Type 2025 & 2033
- Figure 6: Asia Pacific Silane Industry Volume Share (%), by Type 2025 & 2033
- Figure 7: Asia Pacific Silane Industry Revenue (Million), by Application 2025 & 2033
- Figure 8: Asia Pacific Silane Industry Volume (K Tons), by Application 2025 & 2033
- Figure 9: Asia Pacific Silane Industry Revenue Share (%), by Application 2025 & 2033
- Figure 10: Asia Pacific Silane Industry Volume Share (%), by Application 2025 & 2033
- Figure 11: Asia Pacific Silane Industry Revenue (Million), by Country 2025 & 2033
- Figure 12: Asia Pacific Silane Industry Volume (K Tons), by Country 2025 & 2033
- Figure 13: Asia Pacific Silane Industry Revenue Share (%), by Country 2025 & 2033
- Figure 14: Asia Pacific Silane Industry Volume Share (%), by Country 2025 & 2033
- Figure 15: North America Silane Industry Revenue (Million), by Type 2025 & 2033
- Figure 16: North America Silane Industry Volume (K Tons), by Type 2025 & 2033
- Figure 17: North America Silane Industry Revenue Share (%), by Type 2025 & 2033
- Figure 18: North America Silane Industry Volume Share (%), by Type 2025 & 2033
- Figure 19: North America Silane Industry Revenue (Million), by Application 2025 & 2033
- Figure 20: North America Silane Industry Volume (K Tons), by Application 2025 & 2033
- Figure 21: North America Silane Industry Revenue Share (%), by Application 2025 & 2033
- Figure 22: North America Silane Industry Volume Share (%), by Application 2025 & 2033
- Figure 23: North America Silane Industry Revenue (Million), by Country 2025 & 2033
- Figure 24: North America Silane Industry Volume (K Tons), by Country 2025 & 2033
- Figure 25: North America Silane Industry Revenue Share (%), by Country 2025 & 2033
- Figure 26: North America Silane Industry Volume Share (%), by Country 2025 & 2033
- Figure 27: Europe Silane Industry Revenue (Million), by Type 2025 & 2033
- Figure 28: Europe Silane Industry Volume (K Tons), by Type 2025 & 2033
- Figure 29: Europe Silane Industry Revenue Share (%), by Type 2025 & 2033
- Figure 30: Europe Silane Industry Volume Share (%), by Type 2025 & 2033
- Figure 31: Europe Silane Industry Revenue (Million), by Application 2025 & 2033
- Figure 32: Europe Silane Industry Volume (K Tons), by Application 2025 & 2033
- Figure 33: Europe Silane Industry Revenue Share (%), by Application 2025 & 2033
- Figure 34: Europe Silane Industry Volume Share (%), by Application 2025 & 2033
- Figure 35: Europe Silane Industry Revenue (Million), by Country 2025 & 2033
- Figure 36: Europe Silane Industry Volume (K Tons), by Country 2025 & 2033
- Figure 37: Europe Silane Industry Revenue Share (%), by Country 2025 & 2033
- Figure 38: Europe Silane Industry Volume Share (%), by Country 2025 & 2033
- Figure 39: South America Silane Industry Revenue (Million), by Type 2025 & 2033
- Figure 40: South America Silane Industry Volume (K Tons), by Type 2025 & 2033
- Figure 41: South America Silane Industry Revenue Share (%), by Type 2025 & 2033
- Figure 42: South America Silane Industry Volume Share (%), by Type 2025 & 2033
- Figure 43: South America Silane Industry Revenue (Million), by Application 2025 & 2033
- Figure 44: South America Silane Industry Volume (K Tons), by Application 2025 & 2033
- Figure 45: South America Silane Industry Revenue Share (%), by Application 2025 & 2033
- Figure 46: South America Silane Industry Volume Share (%), by Application 2025 & 2033
- Figure 47: South America Silane Industry Revenue (Million), by Country 2025 & 2033
- Figure 48: South America Silane Industry Volume (K Tons), by Country 2025 & 2033
- Figure 49: South America Silane Industry Revenue Share (%), by Country 2025 & 2033
- Figure 50: South America Silane Industry Volume Share (%), by Country 2025 & 2033
- Figure 51: Middle East and Africa Silane Industry Revenue (Million), by Type 2025 & 2033
- Figure 52: Middle East and Africa Silane Industry Volume (K Tons), by Type 2025 & 2033
- Figure 53: Middle East and Africa Silane Industry Revenue Share (%), by Type 2025 & 2033
- Figure 54: Middle East and Africa Silane Industry Volume Share (%), by Type 2025 & 2033
- Figure 55: Middle East and Africa Silane Industry Revenue (Million), by Application 2025 & 2033
- Figure 56: Middle East and Africa Silane Industry Volume (K Tons), by Application 2025 & 2033
- Figure 57: Middle East and Africa Silane Industry Revenue Share (%), by Application 2025 & 2033
- Figure 58: Middle East and Africa Silane Industry Volume Share (%), by Application 2025 & 2033
- Figure 59: Middle East and Africa Silane Industry Revenue (Million), by Country 2025 & 2033
- Figure 60: Middle East and Africa Silane Industry Volume (K Tons), by Country 2025 & 2033
- Figure 61: Middle East and Africa Silane Industry Revenue Share (%), by Country 2025 & 2033
- Figure 62: Middle East and Africa Silane Industry Volume Share (%), by Country 2025 & 2033
List of Tables
- Table 1: Global Silane Industry Revenue Million Forecast, by Type 2020 & 2033
- Table 2: Global Silane Industry Volume K Tons Forecast, by Type 2020 & 2033
- Table 3: Global Silane Industry Revenue Million Forecast, by Application 2020 & 2033
- Table 4: Global Silane Industry Volume K Tons Forecast, by Application 2020 & 2033
- Table 5: Global Silane Industry Revenue Million Forecast, by Region 2020 & 2033
- Table 6: Global Silane Industry Volume K Tons Forecast, by Region 2020 & 2033
- Table 7: Global Silane Industry Revenue Million Forecast, by Type 2020 & 2033
- Table 8: Global Silane Industry Volume K Tons Forecast, by Type 2020 & 2033
- Table 9: Global Silane Industry Revenue Million Forecast, by Application 2020 & 2033
- Table 10: Global Silane Industry Volume K Tons Forecast, by Application 2020 & 2033
- Table 11: Global Silane Industry Revenue Million Forecast, by Country 2020 & 2033
- Table 12: Global Silane Industry Volume K Tons Forecast, by Country 2020 & 2033
- Table 13: China Silane Industry Revenue (Million) Forecast, by Application 2020 & 2033
- Table 14: China Silane Industry Volume (K Tons) Forecast, by Application 2020 & 2033
- Table 15: India Silane Industry Revenue (Million) Forecast, by Application 2020 & 2033
- Table 16: India Silane Industry Volume (K Tons) Forecast, by Application 2020 & 2033
- Table 17: Japan Silane Industry Revenue (Million) Forecast, by Application 2020 & 2033
- Table 18: Japan Silane Industry Volume (K Tons) Forecast, by Application 2020 & 2033
- Table 19: South Korea Silane Industry Revenue (Million) Forecast, by Application 2020 & 2033
- Table 20: South Korea Silane Industry Volume (K Tons) Forecast, by Application 2020 & 2033
- Table 21: Rest of Asia Pacific Silane Industry Revenue (Million) Forecast, by Application 2020 & 2033
- Table 22: Rest of Asia Pacific Silane Industry Volume (K Tons) Forecast, by Application 2020 & 2033
- Table 23: Global Silane Industry Revenue Million Forecast, by Type 2020 & 2033
- Table 24: Global Silane Industry Volume K Tons Forecast, by Type 2020 & 2033
- Table 25: Global Silane Industry Revenue Million Forecast, by Application 2020 & 2033
- Table 26: Global Silane Industry Volume K Tons Forecast, by Application 2020 & 2033
- Table 27: Global Silane Industry Revenue Million Forecast, by Country 2020 & 2033
- Table 28: Global Silane Industry Volume K Tons Forecast, by Country 2020 & 2033
- Table 29: United States Silane Industry Revenue (Million) Forecast, by Application 2020 & 2033
- Table 30: United States Silane Industry Volume (K Tons) Forecast, by Application 2020 & 2033
- Table 31: Canada Silane Industry Revenue (Million) Forecast, by Application 2020 & 2033
- Table 32: Canada Silane Industry Volume (K Tons) Forecast, by Application 2020 & 2033
- Table 33: Mexico Silane Industry Revenue (Million) Forecast, by Application 2020 & 2033
- Table 34: Mexico Silane Industry Volume (K Tons) Forecast, by Application 2020 & 2033
- Table 35: Global Silane Industry Revenue Million Forecast, by Type 2020 & 2033
- Table 36: Global Silane Industry Volume K Tons Forecast, by Type 2020 & 2033
- Table 37: Global Silane Industry Revenue Million Forecast, by Application 2020 & 2033
- Table 38: Global Silane Industry Volume K Tons Forecast, by Application 2020 & 2033
- Table 39: Global Silane Industry Revenue Million Forecast, by Country 2020 & 2033
- Table 40: Global Silane Industry Volume K Tons Forecast, by Country 2020 & 2033
- Table 41: Germany Silane Industry Revenue (Million) Forecast, by Application 2020 & 2033
- Table 42: Germany Silane Industry Volume (K Tons) Forecast, by Application 2020 & 2033
- Table 43: United Kingdom Silane Industry Revenue (Million) Forecast, by Application 2020 & 2033
- Table 44: United Kingdom Silane Industry Volume (K Tons) Forecast, by Application 2020 & 2033
- Table 45: Italy Silane Industry Revenue (Million) Forecast, by Application 2020 & 2033
- Table 46: Italy Silane Industry Volume (K Tons) Forecast, by Application 2020 & 2033
- Table 47: France Silane Industry Revenue (Million) Forecast, by Application 2020 & 2033
- Table 48: France Silane Industry Volume (K Tons) Forecast, by Application 2020 & 2033
- Table 49: Rest of Europe Silane Industry Revenue (Million) Forecast, by Application 2020 & 2033
- Table 50: Rest of Europe Silane Industry Volume (K Tons) Forecast, by Application 2020 & 2033
- Table 51: Global Silane Industry Revenue Million Forecast, by Type 2020 & 2033
- Table 52: Global Silane Industry Volume K Tons Forecast, by Type 2020 & 2033
- Table 53: Global Silane Industry Revenue Million Forecast, by Application 2020 & 2033
- Table 54: Global Silane Industry Volume K Tons Forecast, by Application 2020 & 2033
- Table 55: Global Silane Industry Revenue Million Forecast, by Country 2020 & 2033
- Table 56: Global Silane Industry Volume K Tons Forecast, by Country 2020 & 2033
- Table 57: Brazil Silane Industry Revenue (Million) Forecast, by Application 2020 & 2033
- Table 58: Brazil Silane Industry Volume (K Tons) Forecast, by Application 2020 & 2033
- Table 59: Argentina Silane Industry Revenue (Million) Forecast, by Application 2020 & 2033
- Table 60: Argentina Silane Industry Volume (K Tons) Forecast, by Application 2020 & 2033
- Table 61: Rest of South America Silane Industry Revenue (Million) Forecast, by Application 2020 & 2033
- Table 62: Rest of South America Silane Industry Volume (K Tons) Forecast, by Application 2020 & 2033
- Table 63: Global Silane Industry Revenue Million Forecast, by Type 2020 & 2033
- Table 64: Global Silane Industry Volume K Tons Forecast, by Type 2020 & 2033
- Table 65: Global Silane Industry Revenue Million Forecast, by Application 2020 & 2033
- Table 66: Global Silane Industry Volume K Tons Forecast, by Application 2020 & 2033
- Table 67: Global Silane Industry Revenue Million Forecast, by Country 2020 & 2033
- Table 68: Global Silane Industry Volume K Tons Forecast, by Country 2020 & 2033
- Table 69: Saudi Arabia Silane Industry Revenue (Million) Forecast, by Application 2020 & 2033
- Table 70: Saudi Arabia Silane Industry Volume (K Tons) Forecast, by Application 2020 & 2033
- Table 71: South Africa Silane Industry Revenue (Million) Forecast, by Application 2020 & 2033
- Table 72: South Africa Silane Industry Volume (K Tons) Forecast, by Application 2020 & 2033
- Table 73: Rest of Middle East and Africa Silane Industry Revenue (Million) Forecast, by Application 2020 & 2033
- Table 74: Rest of Middle East and Africa Silane Industry Volume (K Tons) Forecast, by Application 2020 & 2033
Frequently Asked Questions
1. What is the projected Compound Annual Growth Rate (CAGR) of the Silane Industry?
The projected CAGR is approximately 5.7%.
2. Which companies are prominent players in the Silane Industry?
Key companies in the market include SIKA CORPORATION, Merck KGaA, BRB International (PETRONAS Chemical Group), GELEST INC, Tzamal D-Chem Laboratories Ltd, Momentive, Genesee Polymers Corporation, Dow, Alfa Aesar (Thermo Fisher Scientific), Shin-Etsu Chemical Co Ltd, Prochimia Surfaces, United Chemical Technologies, Wacker Chemie AG, Evonik.
3. What are the main segments of the Silane Industry?
The market segments include Type, Application.
4. Can you provide details about the market size?
The market size is estimated to be USD 319.39 Million as of 2022.
5. What are some drivers contributing to market growth?
; Growing Demand form the Construction Industry; Growing Demand for Light-Weight Composites; Increasing Demand from Automotive Industry.
6. What are the notable trends driving market growth?
Growing Demand from the Construction Industry.
7. Are there any restraints impacting market growth?
; Higher Production Costs; Unfavorable Conditions Arising Due to the COVID-19 Outbreak.
8. Can you provide examples of recent developments in the market?
N/A
9. What pricing options are available for accessing the report?
Pricing options include single-user, multi-user, and enterprise licenses priced at USD 4750, USD 5250, and USD 8750 respectively.
10. Is the market size provided in terms of value or volume?
The market size is provided in terms of value, measured in Million and volume, measured in K Tons.
11. Are there any specific market keywords associated with the report?
Yes, the market keyword associated with the report is "Silane Industry," which aids in identifying and referencing the specific market segment covered.
12. How do I determine which pricing option suits my needs best?
The pricing options vary based on user requirements and access needs. Individual users may opt for single-user licenses, while businesses requiring broader access may choose multi-user or enterprise licenses for cost-effective access to the report.
13. Are there any additional resources or data provided in the Silane Industry report?
While the report offers comprehensive insights, it's advisable to review the specific contents or supplementary materials provided to ascertain if additional resources or data are available.
14. How can I stay updated on further developments or reports in the Silane Industry?
To stay informed about further developments, trends, and reports in the Silane Industry, consider subscribing to industry newsletters, following relevant companies and organizations, or regularly checking reputable industry news sources and publications.
Methodology
Step 1 - Identification of Relevant Samples Size from Population Database


Step 2 - Approaches for Defining Global Market Size (Value, Volume* & Price*)

Note*: In applicable scenarios
Step 3 - Data Sources
Primary Research
- Web Analytics
- Survey Reports
- Research Institute
- Latest Research Reports
- Opinion Leaders
Secondary Research
- Annual Reports
- White Paper
- Latest Press Release
- Industry Association
- Paid Database
- Investor Presentations

Step 4 - Data Triangulation
Involves using different sources of information in order to increase the validity of a study
These sources are likely to be stakeholders in a program - participants, other researchers, program staff, other community members, and so on.
Then we put all data in single framework & apply various statistical tools to find out the dynamic on the market.
During the analysis stage, feedback from the stakeholder groups would be compared to determine areas of agreement as well as areas of divergence