

Key Insights
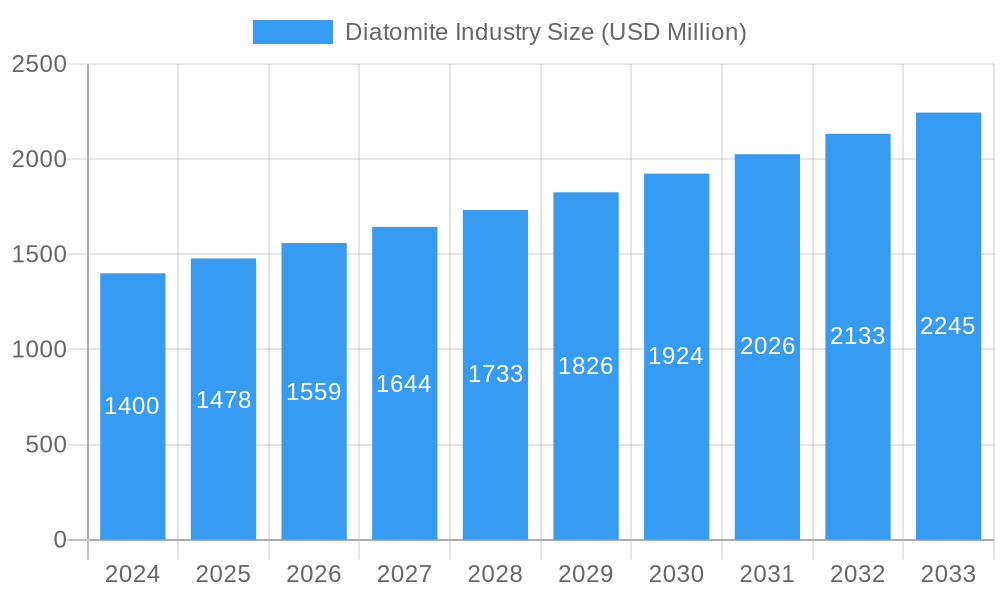
The global diatomite market is projected to experience robust growth, driven by its versatile applications across numerous industries. With a market size of approximately $1.4 billion in 2024, the industry is poised for a significant expansion, forecasting a Compound Annual Growth Rate (CAGR) of 5.6% through 2033. This growth is primarily fueled by the increasing demand for natural and sustainable filtration media in the food and beverage, pharmaceutical, and water treatment sectors. Diatomite's unique porous structure and chemical inertness make it an ideal choice for these applications. Furthermore, its utility as a functional filler in paints, coatings, plastics, and rubber, as well as its role as an absorbent in industrial spills and pet litter, are substantial growth drivers. The growing emphasis on eco-friendly solutions and improved product performance in these end-use industries directly translates into a higher demand for diatomite. The market also benefits from advancements in processing technologies, leading to the development of specialized grades that cater to niche applications, further broadening its market reach.
Diatomite Industry Market Size (In Billion)
Despite the positive outlook, the diatomite market faces certain restraints, including fluctuating raw material availability and the energy-intensive nature of calcination processes, which can impact production costs. Geopolitical factors and supply chain disruptions could also pose challenges. However, emerging applications in areas like high-performance insulation and advanced agricultural products are expected to offset these limitations. Geographically, the Asia Pacific region, particularly China and India, is expected to lead the market due to rapid industrialization, increasing infrastructure development, and a growing middle class driving demand for consumer goods that utilize diatomite. North America and Europe, with their established industrial bases and stringent environmental regulations favoring sustainable materials, will also remain significant markets. The ongoing research and development into novel applications and enhanced processing techniques will be crucial for sustaining the market's upward trajectory and unlocking its full potential.
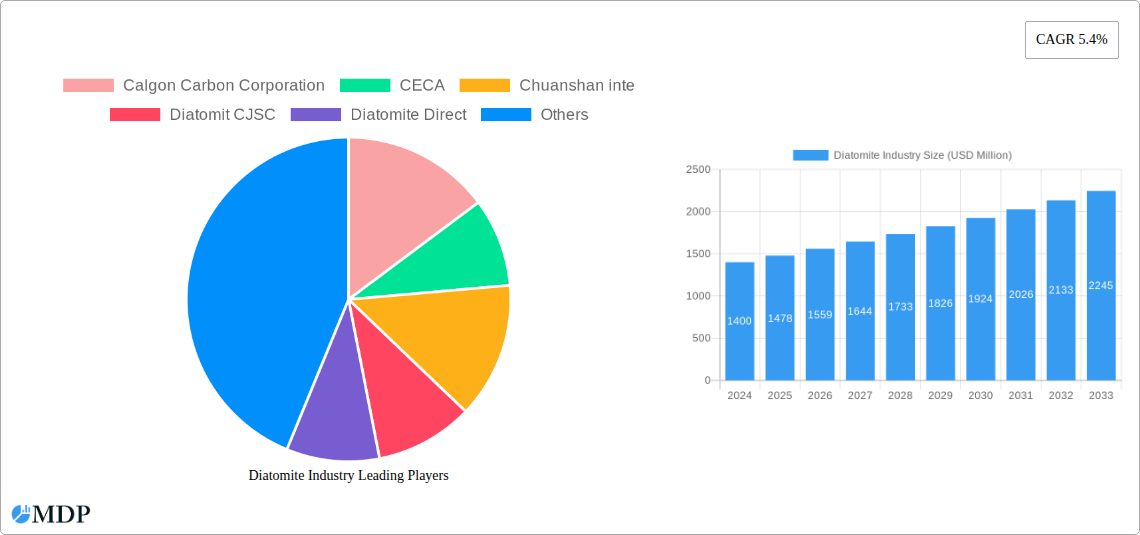
Diatomite Industry Company Market Share
Diatomite Industry Market: Comprehensive Analysis and Forecast 2019-2033
This in-depth report provides a meticulous analysis of the global Diatomite Industry, offering critical insights into market dynamics, growth trajectories, and competitive landscapes from 2019 to 2033. With a base year of 2025 and a forecast period extending to 2033, this study is an indispensable resource for industry stakeholders seeking to navigate the evolving market. We delve into key segments, explore innovative applications, and highlight major players shaping the future of diatomite. Covering market sizes projected to reach billions, this report leverages extensive data and expert analysis to deliver actionable intelligence.
Diatomite Industry Market Dynamics & Concentration
The global Diatomite Industry exhibits a moderate level of market concentration, with several key players holding significant market shares in the billions. Innovation drivers are primarily fueled by advancements in processing technologies and the discovery of novel applications, particularly in high-value sectors like filtration and advanced materials. Regulatory frameworks, while generally supportive of mineral extraction, can vary by region, influencing operational costs and market access. Product substitutes, such as perlite and synthetic zeolites, pose a competitive challenge, though diatomite's unique properties often provide a distinct advantage. End-user trends indicate a growing demand for high-purity and specialized diatomite grades across various industries. Mergers and acquisitions (M&A) activities, though infrequent, play a crucial role in consolidating market power and expanding product portfolios. For instance, the August 2023 price increase announced by Dicalite Management Group signifies strategic pricing adjustments by major players to reflect operational costs and market demand. The market is characterized by strategic partnerships and vertical integration to secure supply chains and enhance value propositions. The total market value is projected to grow exponentially, reaching several billion by the end of the forecast period.
- Market Concentration: Moderate, with leading players holding substantial market shares in the billions.
- Innovation Drivers: Advancements in processing, novel applications, and sustainable extraction methods.
- Regulatory Frameworks: Varied by region, impacting operational costs and environmental compliance.
- Product Substitutes: Perlite, synthetic zeolites, and other filtration and absorbent materials.
- End-User Trends: Increasing demand for specialized grades in water purification, food and beverage filtration, and industrial fillers.
- M&A Activities: Strategic consolidation and portfolio expansion through acquisitions.
Diatomite Industry Industry Trends & Analysis
The Diatomite Industry is poised for robust growth, driven by an expanding array of applications and increasing global demand for its unique properties. The market is projected to witness a Compound Annual Growth Rate (CAGR) of approximately 5-7% over the forecast period, with market penetration deepening across various sectors. Key growth drivers include the escalating need for efficient filtration media in water treatment, food and beverage processing, and pharmaceutical manufacturing, where diatomite’s inert nature and high porosity are invaluable. The construction industry's demand for diatomite as a pozzolanic additive in cement enhances concrete strength and durability, contributing significantly to market expansion. Furthermore, its application as a functional filler in plastics, paints, and coatings, providing enhanced mechanical properties and aesthetic qualities, is on the rise. Technological disruptions are focused on improving extraction efficiency, developing more sustainable processing methods, and creating specialized diatomite products with tailored pore structures and surface chemistries for niche applications. Consumer preferences are leaning towards natural and sustainable materials, a trend that favors diatomite due to its origin as a naturally occurring mineral. Competitive dynamics are characterized by a focus on product differentiation, cost optimization, and strategic supply chain management. The development of calcined and flux-calcined grades further broadens the application spectrum, catering to higher temperature and demanding industrial environments. The overall market size is anticipated to surge into the billions, propelled by these multifaceted trends.
Leading Markets & Segments in Diatomite Industry
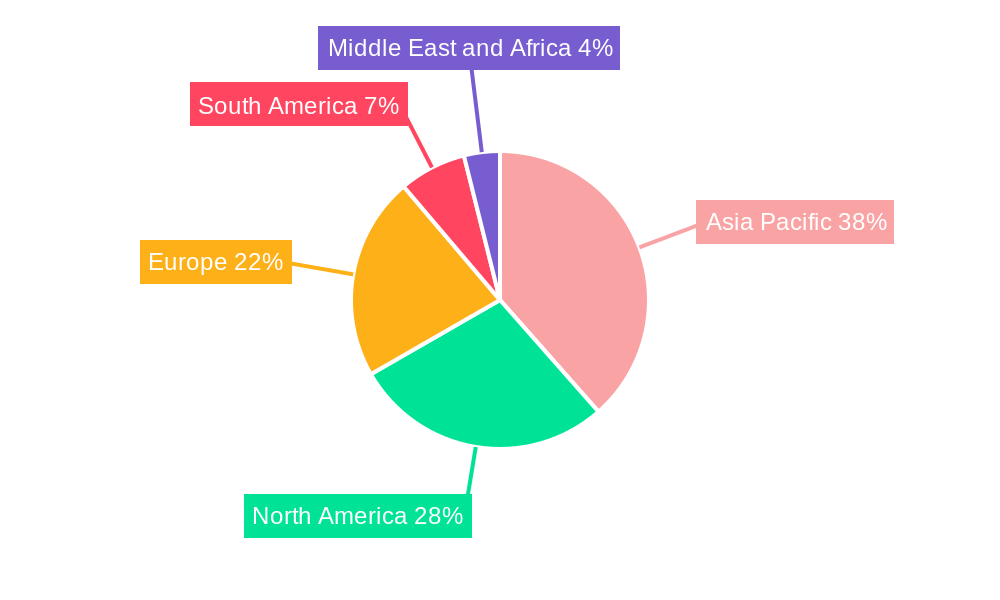
North America and Europe currently dominate the Diatomite Industry, with the United States and China emerging as key consumption hubs. The dominance is driven by well-established industrial infrastructure, stringent environmental regulations promoting efficient water treatment, and a strong presence of key end-use industries such as food and beverage, and construction. The Filter Media application segment is the largest revenue generator, accounting for a significant portion of the market value, projected to reach several billion. This is primarily due to the indispensable role of diatomite in clarifying liquids, removing fine particles, and ensuring product purity across various manufacturing processes.
- Dominant Region/Country: North America (particularly the United States) and Europe, with significant growth in Asia Pacific (China).
- Key Drivers: Mature industrial sectors, stringent environmental regulations, high demand for purified products.
- Dominant Segment: Filter Media.
- Key Drivers: Growing demand for potable water, stringent quality standards in food & beverage and pharmaceutical industries, efficiency in industrial filtration.
- Detailed Dominance Analysis: The superior filtration capabilities of diatomite, owing to its porous structure and inert nature, make it the preferred choice for applications requiring the removal of microscopic impurities. Its effectiveness in diverse fluid types, from beverages to industrial wastewater, solidifies its market leadership.
The Source: Fresh Water Diatomite segment is also a significant contributor, often preferred for its lower impurity profiles, leading to higher-value applications. However, Salt Water Diatomite is gaining traction due to its wider geographical availability and ongoing advancements in processing to meet stringent purity requirements.
- Source Dominance: Fresh Water Diatomite is leading in high-purity applications, while Salt Water Diatomite is expanding its market share due to availability and improved processing.
- Key Drivers for Fresh Water: Purity requirements in pharmaceuticals and food grade applications.
- Key Drivers for Salt Water: Wider availability and cost-effectiveness in industrial applications.
In terms of Process, Flux-Calcined Grades are experiencing accelerated growth, offering enhanced permeability and thermal stability for demanding applications in metallurgy and refractories, contributing to a market value in the billions. Calcined Grades also hold a substantial market share, serving as versatile fillers and functional additives.
- Process Dominance: Flux-Calcined Grades are showing the fastest growth, followed by Calcined Grades. Natural Grades cater to specific niche applications.
- Key Drivers for Flux-Calcined: High-temperature applications, improved filtration efficiency.
- Key Drivers for Calcined: Versatile use as fillers and in industrial applications.
The Application: Cement Additive segment is another substantial market, driven by global infrastructure development and the need for durable and sustainable construction materials. The Filler application, encompassing its use in paints, plastics, and rubber, also represents a significant market share in the billions.
- Application Dominance: Filter Media, Cement Additive, and Filler are the leading application segments.
- Key Drivers for Cement Additive: Infrastructure development, demand for high-performance concrete.
- Key Drivers for Filler: Increasing use in coatings, plastics, and rubber for enhanced properties.
Diatomite Industry Product Developments
The Diatomite Industry is witnessing a continuous stream of product innovations aimed at enhancing performance and expanding application reach. Developments are focused on optimizing particle size distribution, surface modification for improved compatibility with different matrices, and the creation of specialized grades for advanced filtration and catalytic support. These innovations provide significant competitive advantages, enabling manufacturers to cater to niche markets and command premium pricing, contributing to market growth into the billions. The trend towards eco-friendly and sustainable product development is also driving the creation of diatomite-based materials with reduced environmental impact.
Key Drivers of Diatomite Industry Growth
Several interconnected factors are propelling the growth of the Diatomite Industry, collectively contributing to a market value in the billions. Technological advancements in processing and purification are unlocking new applications and improving the cost-effectiveness of existing ones. The increasing global emphasis on water conservation and purification is a major driver, boosting demand for diatomite as a superior filter media. Furthermore, the construction sector's reliance on diatomite as a performance-enhancing additive in cement and concrete is substantial. Regulatory mandates for cleaner industrial processes and consumer demand for natural, safe products in food and beverage applications are also significant growth catalysts.
- Technological Advancements: Improved extraction, processing, and product customization.
- Water Treatment Demand: Escalating need for efficient and cost-effective filtration solutions.
- Construction Sector Growth: Increasing use as a cement additive for enhanced concrete properties.
- Regulatory & Consumer Demand: Push for sustainable, natural, and safe materials.
Challenges in the Diatomite Industry Market
Despite its strong growth prospects, the Diatomite Industry faces several challenges that could temper its expansion into the billions. Stringent environmental regulations related to mining and land reclamation can increase operational costs and create hurdles for new entrants. Supply chain disruptions, exacerbated by geopolitical factors and transportation logistics, can impact availability and pricing. The availability of viable product substitutes, such as perlite and synthetic zeolites, poses a competitive threat, particularly in price-sensitive markets. Furthermore, the energy-intensive nature of calcining processes contributes to operational expenses.
- Regulatory Hurdles: Environmental compliance and permitting complexities.
- Supply Chain Vulnerabilities: Logistics, geopolitical risks, and raw material availability.
- Competitive Pressures: Threat from substitute materials and price sensitivity.
- Operational Costs: Energy consumption for processing and transportation.
Emerging Opportunities in Diatomite Industry
The Diatomite Industry is ripe with emerging opportunities that promise substantial growth, pushing market values into the billions. The increasing global focus on renewable energy and sustainable manufacturing presents opportunities for diatomite in areas like solar panel coatings and advanced insulation materials. Breakthroughs in nanotechnology are paving the way for novel applications of diatomite in drug delivery systems, advanced catalysts, and high-performance composites. Strategic partnerships between diatomite producers and end-users can lead to the co-development of bespoke solutions for emerging industries. Furthermore, market expansion into developing economies with growing industrial bases and improving infrastructure offers significant untapped potential.
Leading Players in the Diatomite Industry Sector
- Calgon Carbon Corporation
- CECA
- Chuanshan inte
- Diatomit CJSC
- Diatomite Direct
- Dicalite Management Group LLC
- EP Minerals
- Imerys
- Jilin Yuan Tong Mineral Co Ltd
- Qingdao Best diatomite co ltd
- Shenzhou Xinglong Products of Diatomite Co Ltd
- Showa Chemical Industry Co Ltd
- U S SILICA
Key Milestones in Diatomite Industry Industry
- August 2023: Dicalite Management Group announced price increases across its Diatomaceous Earth line. This is for all products produced in its Burney, CA, and Basalt, NV facilities. This strategic move signals market adjustments reflecting increased operational costs and robust demand for their products.
Strategic Outlook for Diatomite Industry Market
The strategic outlook for the Diatomite Industry is exceptionally positive, projecting continued growth into the billions. The sector's ability to cater to critical needs in water purification, sustainable construction, and advanced manufacturing positions it for sustained expansion. Future growth will likely be accelerated by continued investment in R&D to develop higher-value, specialized diatomite products. Embracing sustainable extraction and processing methods will be crucial for long-term market leadership and meeting evolving environmental standards. Strategic collaborations and potential M&A activities will further shape the competitive landscape, leading to greater market consolidation and innovation. The industry's adaptability to evolving end-user requirements and its inherent properties make it a resilient and promising market.
Diatomite Industry Segmentation
-
1. Source
- 1.1. Fresh Water Diatomite
- 1.2. Salt Water Diatomite
-
2. Process
- 2.1. Natural Grades
- 2.2. Calcined Grades
- 2.3. Flux-Calcined Grades
-
3. Application
- 3.1. Filter Media
- 3.2. Cement Additive
- 3.3. Filler
- 3.4. Absorbent
- 3.5. Insecticides
- 3.6. Other Applications (Abrasives, Insulation, etc)
Diatomite Industry Segmentation By Geography
-
1. Asia Pacific
- 1.1. China
- 1.2. India
- 1.3. Japan
- 1.4. South Korea
- 1.5. Rest of Asia Pacific
-
2. North America
- 2.1. United States
- 2.2. Canada
- 2.3. Mexico
-
3. Europe
- 3.1. Germany
- 3.2. United Kingdom
- 3.3. Italy
- 3.4. France
- 3.5. Rest of Europe
-
4. South America
- 4.1. Brazil
- 4.2. Argentina
- 4.3. Rest of South America
-
5. Middle East and Africa
- 5.1. Saudi Arabia
- 5.2. South Africa
- 5.3. Rest of Middle East and Africa
Diatomite Industry Regional Market Share
Geographic Coverage of Diatomite Industry
Diatomite Industry REPORT HIGHLIGHTS
| Aspects | Details |
|---|---|
| Study Period | 2020-2034 |
| Base Year | 2025 |
| Estimated Year | 2026 |
| Forecast Period | 2026-2034 |
| Historical Period | 2020-2025 |
| Growth Rate | CAGR of 5.9% from 2020-2034 |
| Segmentation |
|
Table of Contents
- 1. Introduction
- 1.1. Research Scope
- 1.2. Market Segmentation
- 1.3. Research Objective
- 1.4. Definitions and Assumptions
- 2. Executive Summary
- 2.1. Market Snapshot
- 3. Market Dynamics
- 3.1. Market Drivers
- 3.2. Market Restrains
- 3.3. Market Trends
- 3.4. Market Opportunities
- 4. Market Factor Analysis
- 4.1. Porters Five Forces
- 4.1.1. Bargaining Power of Suppliers
- 4.1.2. Bargaining Power of Buyers
- 4.1.3. Threat of New Entrants
- 4.1.4. Threat of Substitutes
- 4.1.5. Competitive Rivalry
- 4.2. PESTEL analysis
- 4.3. BCG Analysis
- 4.3.1. Stars (High Growth, High Market Share)
- 4.3.2. Cash Cows (Low Growth, High Market Share)
- 4.3.3. Question Mark (High Growth, Low Market Share)
- 4.3.4. Dogs (Low Growth, Low Market Share)
- 4.4. Ansoff Matrix Analysis
- 4.5. Supply Chain Analysis
- 4.6. Regulatory Landscape
- 4.7. Current Market Potential and Opportunity Assessment (TAM–SAM–SOM Framework)
- 4.8. MDP Analyst Note
- 4.1. Porters Five Forces
- 5. Market Analysis, Insights and Forecast 2021-2033
- 5.1. Market Analysis, Insights and Forecast - by Source
- 5.1.1. Fresh Water Diatomite
- 5.1.2. Salt Water Diatomite
- 5.2. Market Analysis, Insights and Forecast - by Process
- 5.2.1. Natural Grades
- 5.2.2. Calcined Grades
- 5.2.3. Flux-Calcined Grades
- 5.3. Market Analysis, Insights and Forecast - by Application
- 5.3.1. Filter Media
- 5.3.2. Cement Additive
- 5.3.3. Filler
- 5.3.4. Absorbent
- 5.3.5. Insecticides
- 5.3.6. Other Applications (Abrasives, Insulation, etc)
- 5.4. Market Analysis, Insights and Forecast - by Region
- 5.4.1. Asia Pacific
- 5.4.2. North America
- 5.4.3. Europe
- 5.4.4. South America
- 5.4.5. Middle East and Africa
- 5.1. Market Analysis, Insights and Forecast - by Source
- 6. Global Diatomite Industry Analysis, Insights and Forecast, 2021-2033
- 6.1. Market Analysis, Insights and Forecast - by Source
- 6.1.1. Fresh Water Diatomite
- 6.1.2. Salt Water Diatomite
- 6.2. Market Analysis, Insights and Forecast - by Process
- 6.2.1. Natural Grades
- 6.2.2. Calcined Grades
- 6.2.3. Flux-Calcined Grades
- 6.3. Market Analysis, Insights and Forecast - by Application
- 6.3.1. Filter Media
- 6.3.2. Cement Additive
- 6.3.3. Filler
- 6.3.4. Absorbent
- 6.3.5. Insecticides
- 6.3.6. Other Applications (Abrasives, Insulation, etc)
- 6.1. Market Analysis, Insights and Forecast - by Source
- 7. Asia Pacific Diatomite Industry Analysis, Insights and Forecast, 2020-2032
- 7.1. Market Analysis, Insights and Forecast - by Source
- 7.1.1. Fresh Water Diatomite
- 7.1.2. Salt Water Diatomite
- 7.2. Market Analysis, Insights and Forecast - by Process
- 7.2.1. Natural Grades
- 7.2.2. Calcined Grades
- 7.2.3. Flux-Calcined Grades
- 7.3. Market Analysis, Insights and Forecast - by Application
- 7.3.1. Filter Media
- 7.3.2. Cement Additive
- 7.3.3. Filler
- 7.3.4. Absorbent
- 7.3.5. Insecticides
- 7.3.6. Other Applications (Abrasives, Insulation, etc)
- 7.1. Market Analysis, Insights and Forecast - by Source
- 8. North America Diatomite Industry Analysis, Insights and Forecast, 2020-2032
- 8.1. Market Analysis, Insights and Forecast - by Source
- 8.1.1. Fresh Water Diatomite
- 8.1.2. Salt Water Diatomite
- 8.2. Market Analysis, Insights and Forecast - by Process
- 8.2.1. Natural Grades
- 8.2.2. Calcined Grades
- 8.2.3. Flux-Calcined Grades
- 8.3. Market Analysis, Insights and Forecast - by Application
- 8.3.1. Filter Media
- 8.3.2. Cement Additive
- 8.3.3. Filler
- 8.3.4. Absorbent
- 8.3.5. Insecticides
- 8.3.6. Other Applications (Abrasives, Insulation, etc)
- 8.1. Market Analysis, Insights and Forecast - by Source
- 9. Europe Diatomite Industry Analysis, Insights and Forecast, 2020-2032
- 9.1. Market Analysis, Insights and Forecast - by Source
- 9.1.1. Fresh Water Diatomite
- 9.1.2. Salt Water Diatomite
- 9.2. Market Analysis, Insights and Forecast - by Process
- 9.2.1. Natural Grades
- 9.2.2. Calcined Grades
- 9.2.3. Flux-Calcined Grades
- 9.3. Market Analysis, Insights and Forecast - by Application
- 9.3.1. Filter Media
- 9.3.2. Cement Additive
- 9.3.3. Filler
- 9.3.4. Absorbent
- 9.3.5. Insecticides
- 9.3.6. Other Applications (Abrasives, Insulation, etc)
- 9.1. Market Analysis, Insights and Forecast - by Source
- 10. South America Diatomite Industry Analysis, Insights and Forecast, 2020-2032
- 10.1. Market Analysis, Insights and Forecast - by Source
- 10.1.1. Fresh Water Diatomite
- 10.1.2. Salt Water Diatomite
- 10.2. Market Analysis, Insights and Forecast - by Process
- 10.2.1. Natural Grades
- 10.2.2. Calcined Grades
- 10.2.3. Flux-Calcined Grades
- 10.3. Market Analysis, Insights and Forecast - by Application
- 10.3.1. Filter Media
- 10.3.2. Cement Additive
- 10.3.3. Filler
- 10.3.4. Absorbent
- 10.3.5. Insecticides
- 10.3.6. Other Applications (Abrasives, Insulation, etc)
- 10.1. Market Analysis, Insights and Forecast - by Source
- 11. Middle East and Africa Diatomite Industry Analysis, Insights and Forecast, 2020-2032
- 11.1. Market Analysis, Insights and Forecast - by Source
- 11.1.1. Fresh Water Diatomite
- 11.1.2. Salt Water Diatomite
- 11.2. Market Analysis, Insights and Forecast - by Process
- 11.2.1. Natural Grades
- 11.2.2. Calcined Grades
- 11.2.3. Flux-Calcined Grades
- 11.3. Market Analysis, Insights and Forecast - by Application
- 11.3.1. Filter Media
- 11.3.2. Cement Additive
- 11.3.3. Filler
- 11.3.4. Absorbent
- 11.3.5. Insecticides
- 11.3.6. Other Applications (Abrasives, Insulation, etc)
- 11.1. Market Analysis, Insights and Forecast - by Source
- 12. Competitive Analysis
- 12.1. Company Profiles
- 12.1.1 Calgon Carbon Corporation
- 12.1.1.1. Company Overview
- 12.1.1.2. Products
- 12.1.1.3. Company Financials
- 12.1.1.4. SWOT Analysis
- 12.1.2 CECA
- 12.1.2.1. Company Overview
- 12.1.2.2. Products
- 12.1.2.3. Company Financials
- 12.1.2.4. SWOT Analysis
- 12.1.3 Chuanshan inte
- 12.1.3.1. Company Overview
- 12.1.3.2. Products
- 12.1.3.3. Company Financials
- 12.1.3.4. SWOT Analysis
- 12.1.4 Diatomit CJSC
- 12.1.4.1. Company Overview
- 12.1.4.2. Products
- 12.1.4.3. Company Financials
- 12.1.4.4. SWOT Analysis
- 12.1.5 Diatomite Direct
- 12.1.5.1. Company Overview
- 12.1.5.2. Products
- 12.1.5.3. Company Financials
- 12.1.5.4. SWOT Analysis
- 12.1.6 Dicalite Management Group LLC
- 12.1.6.1. Company Overview
- 12.1.6.2. Products
- 12.1.6.3. Company Financials
- 12.1.6.4. SWOT Analysis
- 12.1.7 EP Minerals
- 12.1.7.1. Company Overview
- 12.1.7.2. Products
- 12.1.7.3. Company Financials
- 12.1.7.4. SWOT Analysis
- 12.1.8 Imerys
- 12.1.8.1. Company Overview
- 12.1.8.2. Products
- 12.1.8.3. Company Financials
- 12.1.8.4. SWOT Analysis
- 12.1.9 Jilin Yuan Tong Mineral Co Ltd
- 12.1.9.1. Company Overview
- 12.1.9.2. Products
- 12.1.9.3. Company Financials
- 12.1.9.4. SWOT Analysis
- 12.1.10 Qingdao Best diatomite co ltd
- 12.1.10.1. Company Overview
- 12.1.10.2. Products
- 12.1.10.3. Company Financials
- 12.1.10.4. SWOT Analysis
- 12.1.11 Shenzhou Xinglong Products of Diatomite Co Ltd
- 12.1.11.1. Company Overview
- 12.1.11.2. Products
- 12.1.11.3. Company Financials
- 12.1.11.4. SWOT Analysis
- 12.1.12 Showa Chemical Industry Co Ltd
- 12.1.12.1. Company Overview
- 12.1.12.2. Products
- 12.1.12.3. Company Financials
- 12.1.12.4. SWOT Analysis
- 12.1.13 U S SILICA*List Not Exhaustive
- 12.1.13.1. Company Overview
- 12.1.13.2. Products
- 12.1.13.3. Company Financials
- 12.1.13.4. SWOT Analysis
- 12.1.1 Calgon Carbon Corporation
- 12.2. Market Entropy
- 12.2.1 Company's Key Areas Served
- 12.2.2 Recent Developments
- 12.3. Company Market Share Analysis 2025
- 12.3.1 Top 5 Companies Market Share Analysis
- 12.3.2 Top 3 Companies Market Share Analysis
- 12.4. List of Potential Customers
- 13. Research Methodology
List of Figures
- Figure 1: Global Diatomite Industry Revenue Breakdown (billion, %) by Region 2025 & 2033
- Figure 2: Asia Pacific Diatomite Industry Revenue (billion), by Source 2025 & 2033
- Figure 3: Asia Pacific Diatomite Industry Revenue Share (%), by Source 2025 & 2033
- Figure 4: Asia Pacific Diatomite Industry Revenue (billion), by Process 2025 & 2033
- Figure 5: Asia Pacific Diatomite Industry Revenue Share (%), by Process 2025 & 2033
- Figure 6: Asia Pacific Diatomite Industry Revenue (billion), by Application 2025 & 2033
- Figure 7: Asia Pacific Diatomite Industry Revenue Share (%), by Application 2025 & 2033
- Figure 8: Asia Pacific Diatomite Industry Revenue (billion), by Country 2025 & 2033
- Figure 9: Asia Pacific Diatomite Industry Revenue Share (%), by Country 2025 & 2033
- Figure 10: North America Diatomite Industry Revenue (billion), by Source 2025 & 2033
- Figure 11: North America Diatomite Industry Revenue Share (%), by Source 2025 & 2033
- Figure 12: North America Diatomite Industry Revenue (billion), by Process 2025 & 2033
- Figure 13: North America Diatomite Industry Revenue Share (%), by Process 2025 & 2033
- Figure 14: North America Diatomite Industry Revenue (billion), by Application 2025 & 2033
- Figure 15: North America Diatomite Industry Revenue Share (%), by Application 2025 & 2033
- Figure 16: North America Diatomite Industry Revenue (billion), by Country 2025 & 2033
- Figure 17: North America Diatomite Industry Revenue Share (%), by Country 2025 & 2033
- Figure 18: Europe Diatomite Industry Revenue (billion), by Source 2025 & 2033
- Figure 19: Europe Diatomite Industry Revenue Share (%), by Source 2025 & 2033
- Figure 20: Europe Diatomite Industry Revenue (billion), by Process 2025 & 2033
- Figure 21: Europe Diatomite Industry Revenue Share (%), by Process 2025 & 2033
- Figure 22: Europe Diatomite Industry Revenue (billion), by Application 2025 & 2033
- Figure 23: Europe Diatomite Industry Revenue Share (%), by Application 2025 & 2033
- Figure 24: Europe Diatomite Industry Revenue (billion), by Country 2025 & 2033
- Figure 25: Europe Diatomite Industry Revenue Share (%), by Country 2025 & 2033
- Figure 26: South America Diatomite Industry Revenue (billion), by Source 2025 & 2033
- Figure 27: South America Diatomite Industry Revenue Share (%), by Source 2025 & 2033
- Figure 28: South America Diatomite Industry Revenue (billion), by Process 2025 & 2033
- Figure 29: South America Diatomite Industry Revenue Share (%), by Process 2025 & 2033
- Figure 30: South America Diatomite Industry Revenue (billion), by Application 2025 & 2033
- Figure 31: South America Diatomite Industry Revenue Share (%), by Application 2025 & 2033
- Figure 32: South America Diatomite Industry Revenue (billion), by Country 2025 & 2033
- Figure 33: South America Diatomite Industry Revenue Share (%), by Country 2025 & 2033
- Figure 34: Middle East and Africa Diatomite Industry Revenue (billion), by Source 2025 & 2033
- Figure 35: Middle East and Africa Diatomite Industry Revenue Share (%), by Source 2025 & 2033
- Figure 36: Middle East and Africa Diatomite Industry Revenue (billion), by Process 2025 & 2033
- Figure 37: Middle East and Africa Diatomite Industry Revenue Share (%), by Process 2025 & 2033
- Figure 38: Middle East and Africa Diatomite Industry Revenue (billion), by Application 2025 & 2033
- Figure 39: Middle East and Africa Diatomite Industry Revenue Share (%), by Application 2025 & 2033
- Figure 40: Middle East and Africa Diatomite Industry Revenue (billion), by Country 2025 & 2033
- Figure 41: Middle East and Africa Diatomite Industry Revenue Share (%), by Country 2025 & 2033
List of Tables
- Table 1: Global Diatomite Industry Revenue billion Forecast, by Source 2020 & 2033
- Table 2: Global Diatomite Industry Revenue billion Forecast, by Process 2020 & 2033
- Table 3: Global Diatomite Industry Revenue billion Forecast, by Application 2020 & 2033
- Table 4: Global Diatomite Industry Revenue billion Forecast, by Region 2020 & 2033
- Table 5: Global Diatomite Industry Revenue billion Forecast, by Source 2020 & 2033
- Table 6: Global Diatomite Industry Revenue billion Forecast, by Process 2020 & 2033
- Table 7: Global Diatomite Industry Revenue billion Forecast, by Application 2020 & 2033
- Table 8: Global Diatomite Industry Revenue billion Forecast, by Country 2020 & 2033
- Table 9: China Diatomite Industry Revenue (billion) Forecast, by Application 2020 & 2033
- Table 10: India Diatomite Industry Revenue (billion) Forecast, by Application 2020 & 2033
- Table 11: Japan Diatomite Industry Revenue (billion) Forecast, by Application 2020 & 2033
- Table 12: South Korea Diatomite Industry Revenue (billion) Forecast, by Application 2020 & 2033
- Table 13: Rest of Asia Pacific Diatomite Industry Revenue (billion) Forecast, by Application 2020 & 2033
- Table 14: Global Diatomite Industry Revenue billion Forecast, by Source 2020 & 2033
- Table 15: Global Diatomite Industry Revenue billion Forecast, by Process 2020 & 2033
- Table 16: Global Diatomite Industry Revenue billion Forecast, by Application 2020 & 2033
- Table 17: Global Diatomite Industry Revenue billion Forecast, by Country 2020 & 2033
- Table 18: United States Diatomite Industry Revenue (billion) Forecast, by Application 2020 & 2033
- Table 19: Canada Diatomite Industry Revenue (billion) Forecast, by Application 2020 & 2033
- Table 20: Mexico Diatomite Industry Revenue (billion) Forecast, by Application 2020 & 2033
- Table 21: Global Diatomite Industry Revenue billion Forecast, by Source 2020 & 2033
- Table 22: Global Diatomite Industry Revenue billion Forecast, by Process 2020 & 2033
- Table 23: Global Diatomite Industry Revenue billion Forecast, by Application 2020 & 2033
- Table 24: Global Diatomite Industry Revenue billion Forecast, by Country 2020 & 2033
- Table 25: Germany Diatomite Industry Revenue (billion) Forecast, by Application 2020 & 2033
- Table 26: United Kingdom Diatomite Industry Revenue (billion) Forecast, by Application 2020 & 2033
- Table 27: Italy Diatomite Industry Revenue (billion) Forecast, by Application 2020 & 2033
- Table 28: France Diatomite Industry Revenue (billion) Forecast, by Application 2020 & 2033
- Table 29: Rest of Europe Diatomite Industry Revenue (billion) Forecast, by Application 2020 & 2033
- Table 30: Global Diatomite Industry Revenue billion Forecast, by Source 2020 & 2033
- Table 31: Global Diatomite Industry Revenue billion Forecast, by Process 2020 & 2033
- Table 32: Global Diatomite Industry Revenue billion Forecast, by Application 2020 & 2033
- Table 33: Global Diatomite Industry Revenue billion Forecast, by Country 2020 & 2033
- Table 34: Brazil Diatomite Industry Revenue (billion) Forecast, by Application 2020 & 2033
- Table 35: Argentina Diatomite Industry Revenue (billion) Forecast, by Application 2020 & 2033
- Table 36: Rest of South America Diatomite Industry Revenue (billion) Forecast, by Application 2020 & 2033
- Table 37: Global Diatomite Industry Revenue billion Forecast, by Source 2020 & 2033
- Table 38: Global Diatomite Industry Revenue billion Forecast, by Process 2020 & 2033
- Table 39: Global Diatomite Industry Revenue billion Forecast, by Application 2020 & 2033
- Table 40: Global Diatomite Industry Revenue billion Forecast, by Country 2020 & 2033
- Table 41: Saudi Arabia Diatomite Industry Revenue (billion) Forecast, by Application 2020 & 2033
- Table 42: South Africa Diatomite Industry Revenue (billion) Forecast, by Application 2020 & 2033
- Table 43: Rest of Middle East and Africa Diatomite Industry Revenue (billion) Forecast, by Application 2020 & 2033
Frequently Asked Questions
1. What is the projected Compound Annual Growth Rate (CAGR) of the Diatomite Industry?
The projected CAGR is approximately 5.9%.
2. Which companies are prominent players in the Diatomite Industry?
Key companies in the market include Calgon Carbon Corporation, CECA, Chuanshan inte, Diatomit CJSC, Diatomite Direct, Dicalite Management Group LLC, EP Minerals, Imerys, Jilin Yuan Tong Mineral Co Ltd, Qingdao Best diatomite co ltd, Shenzhou Xinglong Products of Diatomite Co Ltd, Showa Chemical Industry Co Ltd, U S SILICA*List Not Exhaustive.
3. What are the main segments of the Diatomite Industry?
The market segments include Source, Process, Application.
4. Can you provide details about the market size?
The market size is estimated to be USD 14.6 billion as of 2022.
5. What are some drivers contributing to market growth?
Growing Demand of Diatomite as Filter Media; Growing Demand From Water Treatment Application; Other Drivers.
6. What are the notable trends driving market growth?
Growing Demand of Diatomite as Filter Media.
7. Are there any restraints impacting market growth?
Growing Demand of Diatomite as Filter Media; Growing Demand From Water Treatment Application; Other Drivers.
8. Can you provide examples of recent developments in the market?
August 2023: Dicalite Management Group announced price increases across its Diatomaceous Earth line. This is for all products produced in its Burney, CA, and Basalt, NV facilities.
9. What pricing options are available for accessing the report?
Pricing options include single-user, multi-user, and enterprise licenses priced at USD 4750, USD 5250, and USD 8750 respectively.
10. Is the market size provided in terms of value or volume?
The market size is provided in terms of value, measured in billion.
11. Are there any specific market keywords associated with the report?
Yes, the market keyword associated with the report is "Diatomite Industry," which aids in identifying and referencing the specific market segment covered.
12. How do I determine which pricing option suits my needs best?
The pricing options vary based on user requirements and access needs. Individual users may opt for single-user licenses, while businesses requiring broader access may choose multi-user or enterprise licenses for cost-effective access to the report.
13. Are there any additional resources or data provided in the Diatomite Industry report?
While the report offers comprehensive insights, it's advisable to review the specific contents or supplementary materials provided to ascertain if additional resources or data are available.
14. How can I stay updated on further developments or reports in the Diatomite Industry?
To stay informed about further developments, trends, and reports in the Diatomite Industry, consider subscribing to industry newsletters, following relevant companies and organizations, or regularly checking reputable industry news sources and publications.
Methodology
Step 1 - Identification of Relevant Samples Size from Population Database


Step 2 - Approaches for Defining Global Market Size (Value, Volume* & Price*)

Note*: In applicable scenarios
Step 3 - Data Sources
Primary Research
- Web Analytics
- Survey Reports
- Research Institute
- Latest Research Reports
- Opinion Leaders
Secondary Research
- Annual Reports
- White Paper
- Latest Press Release
- Industry Association
- Paid Database
- Investor Presentations

Step 4 - Data Triangulation
Involves using different sources of information in order to increase the validity of a study
These sources are likely to be stakeholders in a program - participants, other researchers, program staff, other community members, and so on.
Then we put all data in single framework & apply various statistical tools to find out the dynamic on the market.
During the analysis stage, feedback from the stakeholder groups would be compared to determine areas of agreement as well as areas of divergence