

Key Insights
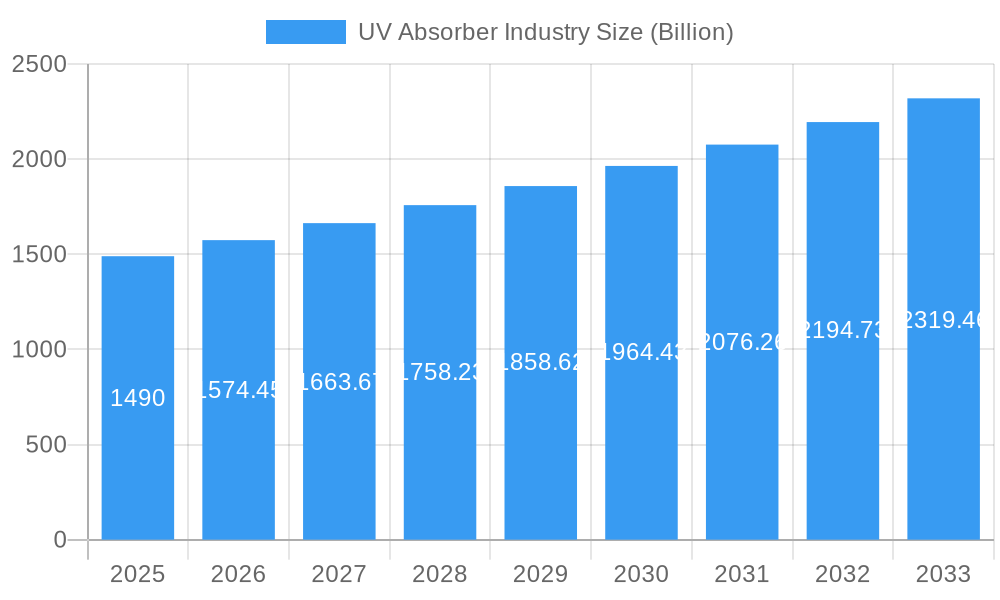
The UV absorber market, valued at $1.49 billion in 2025, is projected to experience robust growth, driven by increasing demand across diverse sectors. A Compound Annual Growth Rate (CAGR) of 5.5% from 2025 to 2033 indicates a significant expansion of this market. Key drivers include the escalating need for UV protection in personal care products (sunscreens, cosmetics), the growing plastics industry requiring UV stabilization for durability and longevity, and the increasing adoption of UV absorbers in advanced coatings and adhesives for various applications. The strong performance is further fueled by technological advancements leading to more effective and environmentally friendly UV absorber formulations. Market segmentation reveals benzotriazole, triazine, and benzophenone as dominant types, with applications spanning personal care, plastics, coatings, and adhesives. While specific regional breakdowns are not detailed, considering global manufacturing hubs and consumer markets, it's anticipated that North America, Europe, and Asia-Pacific will collectively represent a significant portion of the market share. Competitive intensity is high, with established players like Clariant, Solvay, and BASF SE competing alongside numerous regional and specialty chemical manufacturers. The market's continued growth trajectory hinges on the development of sustainable alternatives, stricter environmental regulations, and ongoing innovation in UV absorber technology to meet the evolving needs of various industries.
UV Absorber Industry Market Size (In Billion)
The forecast period of 2025-2033 presents considerable opportunities for market expansion. Further growth will depend on continued innovation in UV absorber technology, the introduction of more sustainable and environmentally friendly options, and the successful penetration into emerging markets. The demand for UV protection in new applications, such as advanced materials and electronics, will also contribute significantly to market growth. Companies focused on research and development, especially those offering customized solutions and environmentally responsible products, are well-positioned to capitalize on the expanding market opportunities. Regulatory changes impacting the use of certain UV absorbers might influence market dynamics and require strategic adjustments from manufacturers. Therefore, a robust understanding of evolving regulations and consumer preferences will be critical for long-term success within this dynamic market.
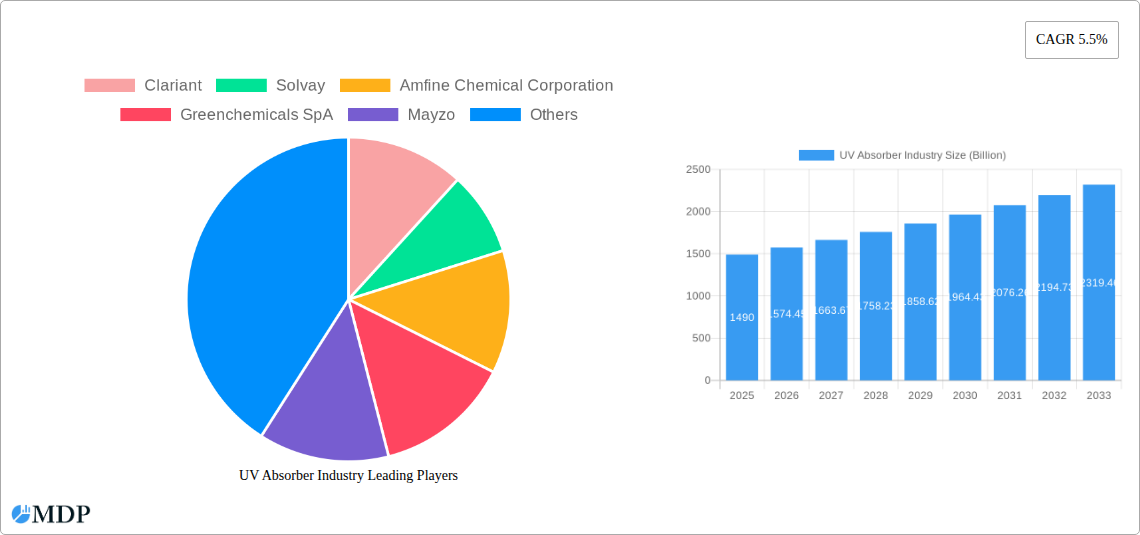
UV Absorber Industry Company Market Share
UV Absorber Industry Market Report: 2019-2033
This comprehensive report provides a detailed analysis of the global UV Absorber industry, projecting a market value exceeding $XX Billion by 2033. The study covers the period 2019-2033, with a base year of 2025 and a forecast period of 2025-2033. Gain actionable insights into market dynamics, leading players, and future growth opportunities. This report is essential for industry stakeholders, investors, and anyone seeking a deep understanding of this dynamic market.
UV Absorber Industry Market Dynamics & Concentration
The global UV absorber market, valued at $XX Billion in 2025, is characterized by moderate concentration. Key players like Clariant, Solvay, and BASF SE hold significant market share, but a fragmented landscape also exists with numerous smaller regional players. Market concentration is influenced by several factors:
- Innovation: Continuous innovation in UV absorber chemistries (e.g., development of more efficient and environmentally friendly absorbers) is a key driver, leading to both market expansion and shifts in competitive dynamics.
- Regulatory Landscape: Stringent regulations concerning the use of specific UV absorbers in personal care and other applications impact market growth and company strategies. Compliance costs and limitations on certain chemical formulations influence market share distribution.
- Product Substitutes: The availability of alternative technologies for UV protection (e.g., advanced coatings, specialized polymers) puts pressure on the UV absorber market, requiring continuous product improvement.
- End-User Trends: Shifting consumer preferences, such as demand for eco-friendly and sustainable products, are altering the market landscape and driving innovation.
- M&A Activity: The industry has witnessed a moderate number (XX) of mergers and acquisitions over the past five years, primarily driven by efforts to expand product portfolios, access new technologies, and gain market share. Major players are engaging in strategic partnerships and acquisitions to improve their competitive edge. The average deal size has been approximately $XX Billion.
UV Absorber Industry Industry Trends & Analysis
The UV absorber market is experiencing robust growth, driven by increasing demand across various applications. The Compound Annual Growth Rate (CAGR) is projected to be XX% during the forecast period (2025-2033). Key factors contributing to this growth include:
- Growing Demand for UV Protection: Rising awareness of the harmful effects of UV radiation is fueling demand for UV absorbers in diverse sectors, from personal care and cosmetics to plastics and coatings.
- Technological Advancements: Developments in nanotechnology and other advanced materials are leading to more effective and durable UV absorber formulations. This enhances the performance and longevity of products, making them more desirable to consumers.
- Expanding Application Areas: The market is witnessing penetration into new applications, including electronics and packaging, further driving market expansion. Market penetration in these new areas is expected to grow at XX% annually.
- Competitive Landscape: Intense competition among key players is pushing innovation and driving down prices, thus benefiting end-users and expanding market accessibility.
Leading Markets & Segments in UV Absorber Industry
The Asia-Pacific region is currently the dominant market for UV absorbers, driven by significant growth in manufacturing industries, rapid urbanization, and increasing consumer demand. Within the types segment, Benzotriazole holds the largest market share due to its cost-effectiveness and broad applicability. The Plastics segment leads in application due to its large volume consumption.
- Key Drivers in Asia-Pacific:
- Rapid industrialization and manufacturing growth
- Expanding infrastructure projects
- Increasing disposable income and consumer spending
- Favorable government policies supporting manufacturing and infrastructure development.
In the applications sector, the plastics sector is dominant due to its large-scale utilization of UV absorbers to protect polymers from degradation. Coatings represents the second largest consumer, influenced by the demand for durable and UV-resistant coatings in various industries.
UV Absorber Industry Product Developments
Recent advancements focus on developing environmentally friendly, high-performance UV absorbers with improved stability and broader application versatility. This includes the use of bio-based materials and sustainable manufacturing processes. These innovations cater to growing concerns about environmental impact and the demand for sustainable products. The development of nano-sized UV absorbers is also gaining traction due to their enhanced efficacy and reduced dosage requirements.
Key Drivers of UV Absorber Industry Growth
The UV absorber industry's growth is primarily driven by technological advancements in material science, leading to more effective and sustainable UV protection solutions. Economic growth in developing countries is boosting demand across multiple applications. Stringent environmental regulations are pushing the adoption of eco-friendly UV absorbers, fostering innovation in this space.
Challenges in the UV Absorber Industry Market
The industry faces challenges such as fluctuations in raw material prices, stringent regulatory compliance requirements, and increasing competition from alternative UV protection technologies. These factors impact profitability and limit the growth potential for certain segments. Supply chain disruptions and global economic uncertainties also pose potential risks.
Emerging Opportunities in UV Absorber Industry
Significant opportunities exist in developing sustainable and biodegradable UV absorbers. Strategic partnerships and collaborations between manufacturers and end-users are creating new markets and applications. Expanding into emerging economies and leveraging technological breakthroughs like nanotechnology are further growth catalysts.
Leading Players in the UV Absorber Industry Sector
- Clariant
- Solvay
- Amfine Chemical Corporation
- Greenchemicals SpA
- Mayzo
- Everlight Chemical Industrial Corp
- Anhui Best Progress Imp & Exp Co Ltd
- BASF SE
- Huntsman International LLC
- Partners in Chemicals
- Hangzhou Disheng Import&Export Co Ltd
- Suqian Liansheng Technology Co Ltd
- Rianlon Corporation
- NYACOL® Nano Technologies Inc
- Suqian Liansheng Technology Co Ltd
- SABO S p A
- Hunan Chemical BV
- Tiangang Auxiliary Co Ltd
- Milliken Chemical
- The Cary Company
Key Milestones in UV Absorber Industry Industry
- 2020: Introduction of a new bio-based UV absorber by Clariant.
- 2021: Acquisition of a smaller UV absorber manufacturer by Solvay.
- 2022: Launch of a novel nano-UV absorber technology by BASF.
- 2023: Implementation of stricter environmental regulations impacting UV absorber manufacturing in Europe. (Further specific milestones would need to be researched and added here based on actual data).
Strategic Outlook for UV Absorber Industry Market
The UV absorber market is poised for sustained growth, driven by technological innovation, increasing awareness of UV radiation risks, and expansion into new applications. Strategic partnerships, investments in research and development, and a focus on sustainable solutions will be crucial for companies to succeed in this competitive landscape. Companies that successfully adapt to evolving consumer preferences and regulatory changes will capture a significant share of the expanding market.
UV Absorber Industry Segmentation
-
1. Types
- 1.1. Benzotriazole
- 1.2. Triazine
- 1.3. Benzophenone
- 1.4. Others
-
2. Application
- 2.1. Adhesives
- 2.2. Coatings
- 2.3. Personal Care
- 2.4. Plastics
- 2.5. Others
UV Absorber Industry Segmentation By Geography
-
1. Asia Pacific
- 1.1. China
- 1.2. India
- 1.3. Japan
- 1.4. South Korea
- 1.5. Rest of Asia Pacific
-
2. North America
- 2.1. United States
- 2.2. Canada
- 2.3. Mexico
-
3. Europe
- 3.1. Germany
- 3.2. United Kingdom
- 3.3. France
- 3.4. Italy
- 3.5. Rest of Europe
-
4. South America
- 4.1. Brazil
- 4.2. Argentina
- 4.3. Rest of South America
-
5. Middle East and Africa
- 5.1. Saudi Arabia
- 5.2. South Africa
- 5.3. Rest of Middle East and Africa
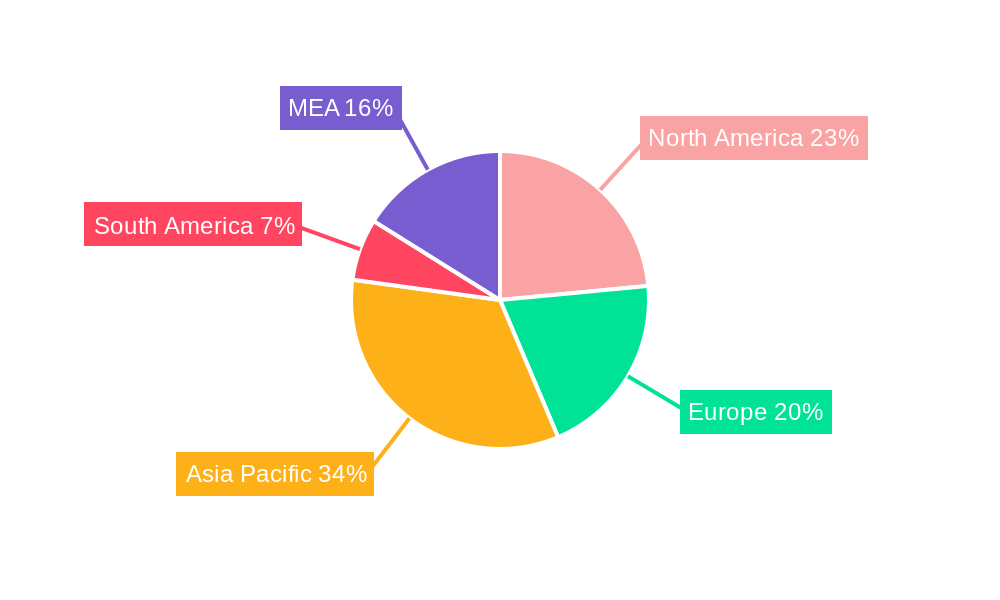
UV Absorber Industry Regional Market Share
Geographic Coverage of UV Absorber Industry
UV Absorber Industry REPORT HIGHLIGHTS
| Aspects | Details |
|---|---|
| Study Period | 2020-2034 |
| Base Year | 2025 |
| Estimated Year | 2026 |
| Forecast Period | 2026-2034 |
| Historical Period | 2020-2025 |
| Growth Rate | CAGR of 5.5% from 2020-2034 |
| Segmentation |
|
Table of Contents
- 1. Introduction
- 1.1. Research Scope
- 1.2. Market Segmentation
- 1.3. Research Objective
- 1.4. Definitions and Assumptions
- 2. Executive Summary
- 2.1. Market Snapshot
- 3. Market Dynamics
- 3.1. Market Drivers
- 3.2. Market Restrains
- 3.3. Market Trends
- 3.4. Market Opportunities
- 4. Market Factor Analysis
- 4.1. Porters Five Forces
- 4.1.1. Bargaining Power of Suppliers
- 4.1.2. Bargaining Power of Buyers
- 4.1.3. Threat of New Entrants
- 4.1.4. Threat of Substitutes
- 4.1.5. Competitive Rivalry
- 4.2. PESTEL analysis
- 4.3. BCG Analysis
- 4.3.1. Stars (High Growth, High Market Share)
- 4.3.2. Cash Cows (Low Growth, High Market Share)
- 4.3.3. Question Mark (High Growth, Low Market Share)
- 4.3.4. Dogs (Low Growth, Low Market Share)
- 4.4. Ansoff Matrix Analysis
- 4.5. Supply Chain Analysis
- 4.6. Regulatory Landscape
- 4.7. Current Market Potential and Opportunity Assessment (TAM–SAM–SOM Framework)
- 4.8. MDP Analyst Note
- 4.1. Porters Five Forces
- 5. Market Analysis, Insights and Forecast 2021-2033
- 5.1. Market Analysis, Insights and Forecast - by Types
- 5.1.1. Benzotriazole
- 5.1.2. Triazine
- 5.1.3. Benzophenone
- 5.1.4. Others
- 5.2. Market Analysis, Insights and Forecast - by Application
- 5.2.1. Adhesives
- 5.2.2. Coatings
- 5.2.3. Personal Care
- 5.2.4. Plastics
- 5.2.5. Others
- 5.3. Market Analysis, Insights and Forecast - by Region
- 5.3.1. Asia Pacific
- 5.3.2. North America
- 5.3.3. Europe
- 5.3.4. South America
- 5.3.5. Middle East and Africa
- 5.1. Market Analysis, Insights and Forecast - by Types
- 6. Global UV Absorber Industry Analysis, Insights and Forecast, 2021-2033
- 6.1. Market Analysis, Insights and Forecast - by Types
- 6.1.1. Benzotriazole
- 6.1.2. Triazine
- 6.1.3. Benzophenone
- 6.1.4. Others
- 6.2. Market Analysis, Insights and Forecast - by Application
- 6.2.1. Adhesives
- 6.2.2. Coatings
- 6.2.3. Personal Care
- 6.2.4. Plastics
- 6.2.5. Others
- 6.1. Market Analysis, Insights and Forecast - by Types
- 7. Asia Pacific UV Absorber Industry Analysis, Insights and Forecast, 2020-2032
- 7.1. Market Analysis, Insights and Forecast - by Types
- 7.1.1. Benzotriazole
- 7.1.2. Triazine
- 7.1.3. Benzophenone
- 7.1.4. Others
- 7.2. Market Analysis, Insights and Forecast - by Application
- 7.2.1. Adhesives
- 7.2.2. Coatings
- 7.2.3. Personal Care
- 7.2.4. Plastics
- 7.2.5. Others
- 7.1. Market Analysis, Insights and Forecast - by Types
- 8. North America UV Absorber Industry Analysis, Insights and Forecast, 2020-2032
- 8.1. Market Analysis, Insights and Forecast - by Types
- 8.1.1. Benzotriazole
- 8.1.2. Triazine
- 8.1.3. Benzophenone
- 8.1.4. Others
- 8.2. Market Analysis, Insights and Forecast - by Application
- 8.2.1. Adhesives
- 8.2.2. Coatings
- 8.2.3. Personal Care
- 8.2.4. Plastics
- 8.2.5. Others
- 8.1. Market Analysis, Insights and Forecast - by Types
- 9. Europe UV Absorber Industry Analysis, Insights and Forecast, 2020-2032
- 9.1. Market Analysis, Insights and Forecast - by Types
- 9.1.1. Benzotriazole
- 9.1.2. Triazine
- 9.1.3. Benzophenone
- 9.1.4. Others
- 9.2. Market Analysis, Insights and Forecast - by Application
- 9.2.1. Adhesives
- 9.2.2. Coatings
- 9.2.3. Personal Care
- 9.2.4. Plastics
- 9.2.5. Others
- 9.1. Market Analysis, Insights and Forecast - by Types
- 10. South America UV Absorber Industry Analysis, Insights and Forecast, 2020-2032
- 10.1. Market Analysis, Insights and Forecast - by Types
- 10.1.1. Benzotriazole
- 10.1.2. Triazine
- 10.1.3. Benzophenone
- 10.1.4. Others
- 10.2. Market Analysis, Insights and Forecast - by Application
- 10.2.1. Adhesives
- 10.2.2. Coatings
- 10.2.3. Personal Care
- 10.2.4. Plastics
- 10.2.5. Others
- 10.1. Market Analysis, Insights and Forecast - by Types
- 11. Middle East and Africa UV Absorber Industry Analysis, Insights and Forecast, 2020-2032
- 11.1. Market Analysis, Insights and Forecast - by Types
- 11.1.1. Benzotriazole
- 11.1.2. Triazine
- 11.1.3. Benzophenone
- 11.1.4. Others
- 11.2. Market Analysis, Insights and Forecast - by Application
- 11.2.1. Adhesives
- 11.2.2. Coatings
- 11.2.3. Personal Care
- 11.2.4. Plastics
- 11.2.5. Others
- 11.1. Market Analysis, Insights and Forecast - by Types
- 12. Competitive Analysis
- 12.1. Company Profiles
- 12.1.1 Clariant
- 12.1.1.1. Company Overview
- 12.1.1.2. Products
- 12.1.1.3. Company Financials
- 12.1.1.4. SWOT Analysis
- 12.1.2 Solvay
- 12.1.2.1. Company Overview
- 12.1.2.2. Products
- 12.1.2.3. Company Financials
- 12.1.2.4. SWOT Analysis
- 12.1.3 Amfine Chemical Corporation
- 12.1.3.1. Company Overview
- 12.1.3.2. Products
- 12.1.3.3. Company Financials
- 12.1.3.4. SWOT Analysis
- 12.1.4 Greenchemicals SpA
- 12.1.4.1. Company Overview
- 12.1.4.2. Products
- 12.1.4.3. Company Financials
- 12.1.4.4. SWOT Analysis
- 12.1.5 Mayzo
- 12.1.5.1. Company Overview
- 12.1.5.2. Products
- 12.1.5.3. Company Financials
- 12.1.5.4. SWOT Analysis
- 12.1.6 Everlight Chemical Industrial Corp
- 12.1.6.1. Company Overview
- 12.1.6.2. Products
- 12.1.6.3. Company Financials
- 12.1.6.4. SWOT Analysis
- 12.1.7 Anhui Best Progress Imp & Exp Co Ltd
- 12.1.7.1. Company Overview
- 12.1.7.2. Products
- 12.1.7.3. Company Financials
- 12.1.7.4. SWOT Analysis
- 12.1.8 BASF SE
- 12.1.8.1. Company Overview
- 12.1.8.2. Products
- 12.1.8.3. Company Financials
- 12.1.8.4. SWOT Analysis
- 12.1.9 Huntsman International LLC
- 12.1.9.1. Company Overview
- 12.1.9.2. Products
- 12.1.9.3. Company Financials
- 12.1.9.4. SWOT Analysis
- 12.1.10 Partners in Chemicals
- 12.1.10.1. Company Overview
- 12.1.10.2. Products
- 12.1.10.3. Company Financials
- 12.1.10.4. SWOT Analysis
- 12.1.11 Hangzhou Disheng Import&Export Co Ltd
- 12.1.11.1. Company Overview
- 12.1.11.2. Products
- 12.1.11.3. Company Financials
- 12.1.11.4. SWOT Analysis
- 12.1.12 Suqian Liansheng Technology Co Ltd
- 12.1.12.1. Company Overview
- 12.1.12.2. Products
- 12.1.12.3. Company Financials
- 12.1.12.4. SWOT Analysis
- 12.1.13 Rianlon Corporation
- 12.1.13.1. Company Overview
- 12.1.13.2. Products
- 12.1.13.3. Company Financials
- 12.1.13.4. SWOT Analysis
- 12.1.14 NYACOL® Nano Technologies Inc
- 12.1.14.1. Company Overview
- 12.1.14.2. Products
- 12.1.14.3. Company Financials
- 12.1.14.4. SWOT Analysis
- 12.1.15 Suqian Liansheng Technology Co Ltd
- 12.1.15.1. Company Overview
- 12.1.15.2. Products
- 12.1.15.3. Company Financials
- 12.1.15.4. SWOT Analysis
- 12.1.16 SABO S p A
- 12.1.16.1. Company Overview
- 12.1.16.2. Products
- 12.1.16.3. Company Financials
- 12.1.16.4. SWOT Analysis
- 12.1.17 Hunan Chemical BV
- 12.1.17.1. Company Overview
- 12.1.17.2. Products
- 12.1.17.3. Company Financials
- 12.1.17.4. SWOT Analysis
- 12.1.18 Tiangang Auxiliary Co Ltd
- 12.1.18.1. Company Overview
- 12.1.18.2. Products
- 12.1.18.3. Company Financials
- 12.1.18.4. SWOT Analysis
- 12.1.19 Milliken Chemical
- 12.1.19.1. Company Overview
- 12.1.19.2. Products
- 12.1.19.3. Company Financials
- 12.1.19.4. SWOT Analysis
- 12.1.20 The Cary Company
- 12.1.20.1. Company Overview
- 12.1.20.2. Products
- 12.1.20.3. Company Financials
- 12.1.20.4. SWOT Analysis
- 12.1.1 Clariant
- 12.2. Market Entropy
- 12.2.1 Company's Key Areas Served
- 12.2.2 Recent Developments
- 12.3. Company Market Share Analysis 2025
- 12.3.1 Top 5 Companies Market Share Analysis
- 12.3.2 Top 3 Companies Market Share Analysis
- 12.4. List of Potential Customers
- 13. Research Methodology
List of Figures
- Figure 1: Global UV Absorber Industry Revenue Breakdown (Billion, %) by Region 2025 & 2033
- Figure 2: Global UV Absorber Industry Volume Breakdown (K Tons, %) by Region 2025 & 2033
- Figure 3: Asia Pacific UV Absorber Industry Revenue (Billion), by Types 2025 & 2033
- Figure 4: Asia Pacific UV Absorber Industry Volume (K Tons), by Types 2025 & 2033
- Figure 5: Asia Pacific UV Absorber Industry Revenue Share (%), by Types 2025 & 2033
- Figure 6: Asia Pacific UV Absorber Industry Volume Share (%), by Types 2025 & 2033
- Figure 7: Asia Pacific UV Absorber Industry Revenue (Billion), by Application 2025 & 2033
- Figure 8: Asia Pacific UV Absorber Industry Volume (K Tons), by Application 2025 & 2033
- Figure 9: Asia Pacific UV Absorber Industry Revenue Share (%), by Application 2025 & 2033
- Figure 10: Asia Pacific UV Absorber Industry Volume Share (%), by Application 2025 & 2033
- Figure 11: Asia Pacific UV Absorber Industry Revenue (Billion), by Country 2025 & 2033
- Figure 12: Asia Pacific UV Absorber Industry Volume (K Tons), by Country 2025 & 2033
- Figure 13: Asia Pacific UV Absorber Industry Revenue Share (%), by Country 2025 & 2033
- Figure 14: Asia Pacific UV Absorber Industry Volume Share (%), by Country 2025 & 2033
- Figure 15: North America UV Absorber Industry Revenue (Billion), by Types 2025 & 2033
- Figure 16: North America UV Absorber Industry Volume (K Tons), by Types 2025 & 2033
- Figure 17: North America UV Absorber Industry Revenue Share (%), by Types 2025 & 2033
- Figure 18: North America UV Absorber Industry Volume Share (%), by Types 2025 & 2033
- Figure 19: North America UV Absorber Industry Revenue (Billion), by Application 2025 & 2033
- Figure 20: North America UV Absorber Industry Volume (K Tons), by Application 2025 & 2033
- Figure 21: North America UV Absorber Industry Revenue Share (%), by Application 2025 & 2033
- Figure 22: North America UV Absorber Industry Volume Share (%), by Application 2025 & 2033
- Figure 23: North America UV Absorber Industry Revenue (Billion), by Country 2025 & 2033
- Figure 24: North America UV Absorber Industry Volume (K Tons), by Country 2025 & 2033
- Figure 25: North America UV Absorber Industry Revenue Share (%), by Country 2025 & 2033
- Figure 26: North America UV Absorber Industry Volume Share (%), by Country 2025 & 2033
- Figure 27: Europe UV Absorber Industry Revenue (Billion), by Types 2025 & 2033
- Figure 28: Europe UV Absorber Industry Volume (K Tons), by Types 2025 & 2033
- Figure 29: Europe UV Absorber Industry Revenue Share (%), by Types 2025 & 2033
- Figure 30: Europe UV Absorber Industry Volume Share (%), by Types 2025 & 2033
- Figure 31: Europe UV Absorber Industry Revenue (Billion), by Application 2025 & 2033
- Figure 32: Europe UV Absorber Industry Volume (K Tons), by Application 2025 & 2033
- Figure 33: Europe UV Absorber Industry Revenue Share (%), by Application 2025 & 2033
- Figure 34: Europe UV Absorber Industry Volume Share (%), by Application 2025 & 2033
- Figure 35: Europe UV Absorber Industry Revenue (Billion), by Country 2025 & 2033
- Figure 36: Europe UV Absorber Industry Volume (K Tons), by Country 2025 & 2033
- Figure 37: Europe UV Absorber Industry Revenue Share (%), by Country 2025 & 2033
- Figure 38: Europe UV Absorber Industry Volume Share (%), by Country 2025 & 2033
- Figure 39: South America UV Absorber Industry Revenue (Billion), by Types 2025 & 2033
- Figure 40: South America UV Absorber Industry Volume (K Tons), by Types 2025 & 2033
- Figure 41: South America UV Absorber Industry Revenue Share (%), by Types 2025 & 2033
- Figure 42: South America UV Absorber Industry Volume Share (%), by Types 2025 & 2033
- Figure 43: South America UV Absorber Industry Revenue (Billion), by Application 2025 & 2033
- Figure 44: South America UV Absorber Industry Volume (K Tons), by Application 2025 & 2033
- Figure 45: South America UV Absorber Industry Revenue Share (%), by Application 2025 & 2033
- Figure 46: South America UV Absorber Industry Volume Share (%), by Application 2025 & 2033
- Figure 47: South America UV Absorber Industry Revenue (Billion), by Country 2025 & 2033
- Figure 48: South America UV Absorber Industry Volume (K Tons), by Country 2025 & 2033
- Figure 49: South America UV Absorber Industry Revenue Share (%), by Country 2025 & 2033
- Figure 50: South America UV Absorber Industry Volume Share (%), by Country 2025 & 2033
- Figure 51: Middle East and Africa UV Absorber Industry Revenue (Billion), by Types 2025 & 2033
- Figure 52: Middle East and Africa UV Absorber Industry Volume (K Tons), by Types 2025 & 2033
- Figure 53: Middle East and Africa UV Absorber Industry Revenue Share (%), by Types 2025 & 2033
- Figure 54: Middle East and Africa UV Absorber Industry Volume Share (%), by Types 2025 & 2033
- Figure 55: Middle East and Africa UV Absorber Industry Revenue (Billion), by Application 2025 & 2033
- Figure 56: Middle East and Africa UV Absorber Industry Volume (K Tons), by Application 2025 & 2033
- Figure 57: Middle East and Africa UV Absorber Industry Revenue Share (%), by Application 2025 & 2033
- Figure 58: Middle East and Africa UV Absorber Industry Volume Share (%), by Application 2025 & 2033
- Figure 59: Middle East and Africa UV Absorber Industry Revenue (Billion), by Country 2025 & 2033
- Figure 60: Middle East and Africa UV Absorber Industry Volume (K Tons), by Country 2025 & 2033
- Figure 61: Middle East and Africa UV Absorber Industry Revenue Share (%), by Country 2025 & 2033
- Figure 62: Middle East and Africa UV Absorber Industry Volume Share (%), by Country 2025 & 2033
List of Tables
- Table 1: Global UV Absorber Industry Revenue Billion Forecast, by Types 2020 & 2033
- Table 2: Global UV Absorber Industry Volume K Tons Forecast, by Types 2020 & 2033
- Table 3: Global UV Absorber Industry Revenue Billion Forecast, by Application 2020 & 2033
- Table 4: Global UV Absorber Industry Volume K Tons Forecast, by Application 2020 & 2033
- Table 5: Global UV Absorber Industry Revenue Billion Forecast, by Region 2020 & 2033
- Table 6: Global UV Absorber Industry Volume K Tons Forecast, by Region 2020 & 2033
- Table 7: Global UV Absorber Industry Revenue Billion Forecast, by Types 2020 & 2033
- Table 8: Global UV Absorber Industry Volume K Tons Forecast, by Types 2020 & 2033
- Table 9: Global UV Absorber Industry Revenue Billion Forecast, by Application 2020 & 2033
- Table 10: Global UV Absorber Industry Volume K Tons Forecast, by Application 2020 & 2033
- Table 11: Global UV Absorber Industry Revenue Billion Forecast, by Country 2020 & 2033
- Table 12: Global UV Absorber Industry Volume K Tons Forecast, by Country 2020 & 2033
- Table 13: China UV Absorber Industry Revenue (Billion) Forecast, by Application 2020 & 2033
- Table 14: China UV Absorber Industry Volume (K Tons) Forecast, by Application 2020 & 2033
- Table 15: India UV Absorber Industry Revenue (Billion) Forecast, by Application 2020 & 2033
- Table 16: India UV Absorber Industry Volume (K Tons) Forecast, by Application 2020 & 2033
- Table 17: Japan UV Absorber Industry Revenue (Billion) Forecast, by Application 2020 & 2033
- Table 18: Japan UV Absorber Industry Volume (K Tons) Forecast, by Application 2020 & 2033
- Table 19: South Korea UV Absorber Industry Revenue (Billion) Forecast, by Application 2020 & 2033
- Table 20: South Korea UV Absorber Industry Volume (K Tons) Forecast, by Application 2020 & 2033
- Table 21: Rest of Asia Pacific UV Absorber Industry Revenue (Billion) Forecast, by Application 2020 & 2033
- Table 22: Rest of Asia Pacific UV Absorber Industry Volume (K Tons) Forecast, by Application 2020 & 2033
- Table 23: Global UV Absorber Industry Revenue Billion Forecast, by Types 2020 & 2033
- Table 24: Global UV Absorber Industry Volume K Tons Forecast, by Types 2020 & 2033
- Table 25: Global UV Absorber Industry Revenue Billion Forecast, by Application 2020 & 2033
- Table 26: Global UV Absorber Industry Volume K Tons Forecast, by Application 2020 & 2033
- Table 27: Global UV Absorber Industry Revenue Billion Forecast, by Country 2020 & 2033
- Table 28: Global UV Absorber Industry Volume K Tons Forecast, by Country 2020 & 2033
- Table 29: United States UV Absorber Industry Revenue (Billion) Forecast, by Application 2020 & 2033
- Table 30: United States UV Absorber Industry Volume (K Tons) Forecast, by Application 2020 & 2033
- Table 31: Canada UV Absorber Industry Revenue (Billion) Forecast, by Application 2020 & 2033
- Table 32: Canada UV Absorber Industry Volume (K Tons) Forecast, by Application 2020 & 2033
- Table 33: Mexico UV Absorber Industry Revenue (Billion) Forecast, by Application 2020 & 2033
- Table 34: Mexico UV Absorber Industry Volume (K Tons) Forecast, by Application 2020 & 2033
- Table 35: Global UV Absorber Industry Revenue Billion Forecast, by Types 2020 & 2033
- Table 36: Global UV Absorber Industry Volume K Tons Forecast, by Types 2020 & 2033
- Table 37: Global UV Absorber Industry Revenue Billion Forecast, by Application 2020 & 2033
- Table 38: Global UV Absorber Industry Volume K Tons Forecast, by Application 2020 & 2033
- Table 39: Global UV Absorber Industry Revenue Billion Forecast, by Country 2020 & 2033
- Table 40: Global UV Absorber Industry Volume K Tons Forecast, by Country 2020 & 2033
- Table 41: Germany UV Absorber Industry Revenue (Billion) Forecast, by Application 2020 & 2033
- Table 42: Germany UV Absorber Industry Volume (K Tons) Forecast, by Application 2020 & 2033
- Table 43: United Kingdom UV Absorber Industry Revenue (Billion) Forecast, by Application 2020 & 2033
- Table 44: United Kingdom UV Absorber Industry Volume (K Tons) Forecast, by Application 2020 & 2033
- Table 45: France UV Absorber Industry Revenue (Billion) Forecast, by Application 2020 & 2033
- Table 46: France UV Absorber Industry Volume (K Tons) Forecast, by Application 2020 & 2033
- Table 47: Italy UV Absorber Industry Revenue (Billion) Forecast, by Application 2020 & 2033
- Table 48: Italy UV Absorber Industry Volume (K Tons) Forecast, by Application 2020 & 2033
- Table 49: Rest of Europe UV Absorber Industry Revenue (Billion) Forecast, by Application 2020 & 2033
- Table 50: Rest of Europe UV Absorber Industry Volume (K Tons) Forecast, by Application 2020 & 2033
- Table 51: Global UV Absorber Industry Revenue Billion Forecast, by Types 2020 & 2033
- Table 52: Global UV Absorber Industry Volume K Tons Forecast, by Types 2020 & 2033
- Table 53: Global UV Absorber Industry Revenue Billion Forecast, by Application 2020 & 2033
- Table 54: Global UV Absorber Industry Volume K Tons Forecast, by Application 2020 & 2033
- Table 55: Global UV Absorber Industry Revenue Billion Forecast, by Country 2020 & 2033
- Table 56: Global UV Absorber Industry Volume K Tons Forecast, by Country 2020 & 2033
- Table 57: Brazil UV Absorber Industry Revenue (Billion) Forecast, by Application 2020 & 2033
- Table 58: Brazil UV Absorber Industry Volume (K Tons) Forecast, by Application 2020 & 2033
- Table 59: Argentina UV Absorber Industry Revenue (Billion) Forecast, by Application 2020 & 2033
- Table 60: Argentina UV Absorber Industry Volume (K Tons) Forecast, by Application 2020 & 2033
- Table 61: Rest of South America UV Absorber Industry Revenue (Billion) Forecast, by Application 2020 & 2033
- Table 62: Rest of South America UV Absorber Industry Volume (K Tons) Forecast, by Application 2020 & 2033
- Table 63: Global UV Absorber Industry Revenue Billion Forecast, by Types 2020 & 2033
- Table 64: Global UV Absorber Industry Volume K Tons Forecast, by Types 2020 & 2033
- Table 65: Global UV Absorber Industry Revenue Billion Forecast, by Application 2020 & 2033
- Table 66: Global UV Absorber Industry Volume K Tons Forecast, by Application 2020 & 2033
- Table 67: Global UV Absorber Industry Revenue Billion Forecast, by Country 2020 & 2033
- Table 68: Global UV Absorber Industry Volume K Tons Forecast, by Country 2020 & 2033
- Table 69: Saudi Arabia UV Absorber Industry Revenue (Billion) Forecast, by Application 2020 & 2033
- Table 70: Saudi Arabia UV Absorber Industry Volume (K Tons) Forecast, by Application 2020 & 2033
- Table 71: South Africa UV Absorber Industry Revenue (Billion) Forecast, by Application 2020 & 2033
- Table 72: South Africa UV Absorber Industry Volume (K Tons) Forecast, by Application 2020 & 2033
- Table 73: Rest of Middle East and Africa UV Absorber Industry Revenue (Billion) Forecast, by Application 2020 & 2033
- Table 74: Rest of Middle East and Africa UV Absorber Industry Volume (K Tons) Forecast, by Application 2020 & 2033
Frequently Asked Questions
1. What is the projected Compound Annual Growth Rate (CAGR) of the UV Absorber Industry?
The projected CAGR is approximately 5.5%.
2. Which companies are prominent players in the UV Absorber Industry?
Key companies in the market include Clariant, Solvay, Amfine Chemical Corporation, Greenchemicals SpA, Mayzo, Everlight Chemical Industrial Corp, Anhui Best Progress Imp & Exp Co Ltd, BASF SE, Huntsman International LLC, Partners in Chemicals, Hangzhou Disheng Import&Export Co Ltd, Suqian Liansheng Technology Co Ltd , Rianlon Corporation, NYACOL® Nano Technologies Inc, Suqian Liansheng Technology Co Ltd, SABO S p A, Hunan Chemical BV, Tiangang Auxiliary Co Ltd, Milliken Chemical, The Cary Company.
3. What are the main segments of the UV Absorber Industry?
The market segments include Types, Application.
4. Can you provide details about the market size?
The market size is estimated to be USD 1.49 Billion as of 2022.
5. What are some drivers contributing to market growth?
; Growing Application in Plastics and Packaging; Other Drivers.
6. What are the notable trends driving market growth?
Plastic to Dominate the Market.
7. Are there any restraints impacting market growth?
; Environmental Concerns of Benzotriazole UV Absorber; Unfavorable Conditions Arising Due to COVID-19 Outbreak.
8. Can you provide examples of recent developments in the market?
N/A
9. What pricing options are available for accessing the report?
Pricing options include single-user, multi-user, and enterprise licenses priced at USD 4750, USD 5250, and USD 8750 respectively.
10. Is the market size provided in terms of value or volume?
The market size is provided in terms of value, measured in Billion and volume, measured in K Tons.
11. Are there any specific market keywords associated with the report?
Yes, the market keyword associated with the report is "UV Absorber Industry," which aids in identifying and referencing the specific market segment covered.
12. How do I determine which pricing option suits my needs best?
The pricing options vary based on user requirements and access needs. Individual users may opt for single-user licenses, while businesses requiring broader access may choose multi-user or enterprise licenses for cost-effective access to the report.
13. Are there any additional resources or data provided in the UV Absorber Industry report?
While the report offers comprehensive insights, it's advisable to review the specific contents or supplementary materials provided to ascertain if additional resources or data are available.
14. How can I stay updated on further developments or reports in the UV Absorber Industry?
To stay informed about further developments, trends, and reports in the UV Absorber Industry, consider subscribing to industry newsletters, following relevant companies and organizations, or regularly checking reputable industry news sources and publications.
Methodology
Step 1 - Identification of Relevant Samples Size from Population Database


Step 2 - Approaches for Defining Global Market Size (Value, Volume* & Price*)

Note*: In applicable scenarios
Step 3 - Data Sources
Primary Research
- Web Analytics
- Survey Reports
- Research Institute
- Latest Research Reports
- Opinion Leaders
Secondary Research
- Annual Reports
- White Paper
- Latest Press Release
- Industry Association
- Paid Database
- Investor Presentations

Step 4 - Data Triangulation
Involves using different sources of information in order to increase the validity of a study
These sources are likely to be stakeholders in a program - participants, other researchers, program staff, other community members, and so on.
Then we put all data in single framework & apply various statistical tools to find out the dynamic on the market.
During the analysis stage, feedback from the stakeholder groups would be compared to determine areas of agreement as well as areas of divergence