

Key Insights
The U.S. automotive lubricants market is projected to reach $25.7 billion by 2025, with an anticipated Compound Annual Growth Rate (CAGR) of 4.1% from 2025 to 2033. This growth trajectory is propelled by an expanding vehicle parc, particularly passenger and commercial vehicles in urbanizing regions, and the escalating demand for high-performance lubricants engineered to meet rigorous fuel efficiency and emission standards. The market is segmented with passenger vehicle lubricants constituting the largest share, followed by commercial vehicles and motorcycles. Engine oils remain the dominant product segment due to ongoing maintenance requirements. However, the burgeoning adoption of electric and hybrid vehicles presents a dynamic shift, prompting lubricant manufacturers to innovate and develop specialized fluids for these emerging technologies. Market dynamics are also influenced by fluctuating crude oil prices and stringent environmental regulations, posing challenges to sustained expansion. Key demand centers within the U.S. include California, Texas, and Florida, driven by substantial populations and thriving automotive sectors. The competitive arena is primarily shaped by global leaders such as ExxonMobil, Shell, and Castrol, alongside prominent domestic and specialized brands like Valvoline and AMSOIL. These key players are prioritizing innovation in eco-friendly and high-performance lubricant development to solidify their market positions.
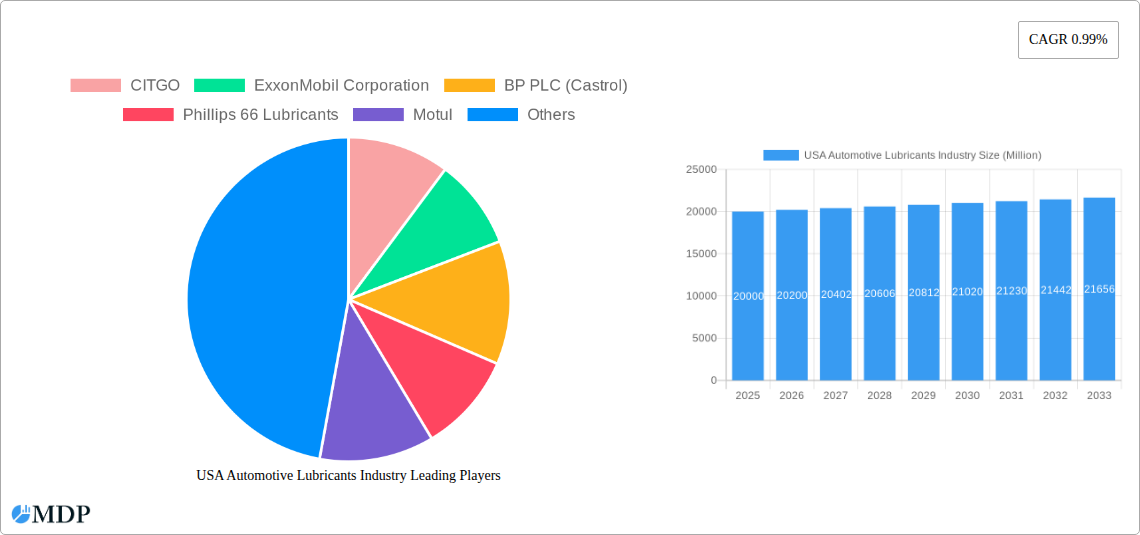
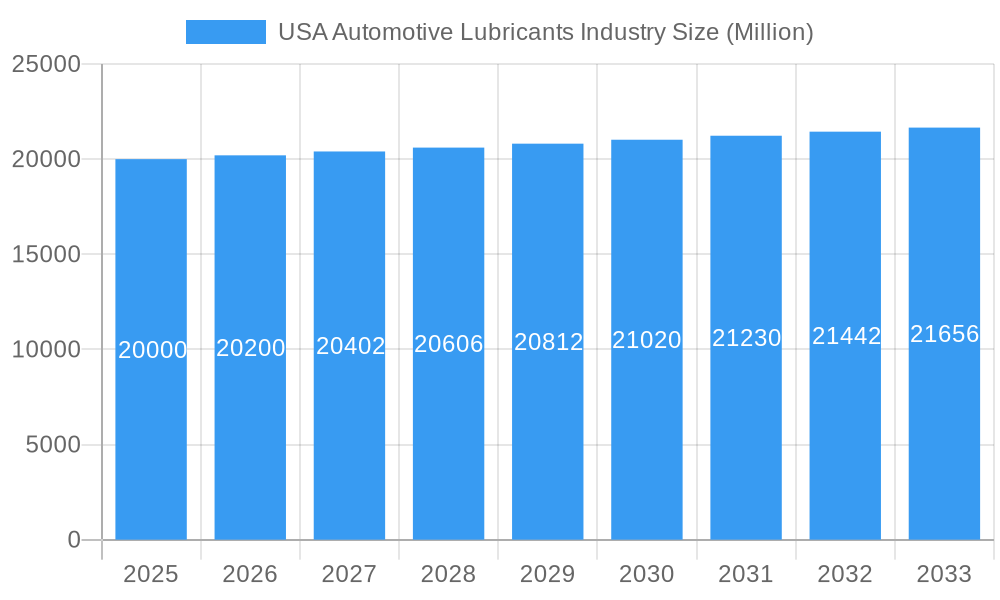
USA Automotive Lubricants Industry Market Size (In Billion)
The forecast period (2025-2033) indicates sustained market growth, characterized by an increasing vehicle fleet and the ongoing integration of advanced vehicle technologies. Strategic imperatives for market participants include leveraging the demand for high-performance lubricants optimized for modern engines, a pivot towards sustainable and biodegradable formulations, and strategic expansion into specialized segments such as heavy-duty commercial vehicle lubrication. Comprehensive market segmentation analyses will be crucial to adapt to technological evolution and the introduction of novel lubricant types. Competitive differentiation will be achieved through robust supply chain operations, pioneering technological advancements, and cultivating strong brand equity across diverse vehicle segments.
USA Automotive Lubricants Industry Company Market Share
USA Automotive Lubricants Industry: A Comprehensive Market Report (2019-2033)
Uncover the lucrative opportunities and challenges shaping the future of the US automotive lubricants market. This in-depth report provides a comprehensive analysis of the industry, encompassing market dynamics, key players, leading segments, and future trends. With data spanning from 2019 to 2033, including a base year of 2025 and a forecast period of 2025-2033, this report is an essential resource for industry stakeholders, investors, and strategic decision-makers.
USA Automotive Lubricants Industry Market Dynamics & Concentration
The US automotive lubricants market, valued at $XX Million in 2024, is experiencing [positive/negative - choose one based on data] growth, driven by factors including the increasing vehicle population, stringent emission regulations, and advancements in lubricant technology. Market concentration is [high/medium/low - choose one based on data], with a few major players holding significant market share.
Market Share: ExxonMobil Corporation holds approximately XX% market share, followed by Chevron Corporation at XX%, and Shell at XX%. Other significant players include CITGO, BP PLC (Castrol), Phillips 66 Lubricants, Motul, TotalEnergies, Valvoline Inc, and AMSOIL Inc. The remaining market share is distributed among numerous smaller players.
Innovation Drivers: The push for improved fuel efficiency, reduced emissions, and extended oil drain intervals is driving innovation in lubricant formulations, particularly in synthetic oils and specialized additives.
Regulatory Frameworks: EPA regulations regarding emissions and waste disposal significantly impact the industry, pushing for environmentally friendly lubricant formulations and responsible disposal practices.
Product Substitutes: The emergence of alternative fuels and electric vehicles poses a potential threat, although the continued growth of the internal combustion engine market mitigates this risk for the foreseeable future.
End-User Trends: Consumers are increasingly demanding high-performance lubricants that extend engine life, improve fuel economy, and protect against wear.
M&A Activities: The industry has witnessed [Number] significant mergers and acquisitions in the past five years, driven by the need to expand market share, access new technologies, and enhance product portfolios.
USA Automotive Lubricants Industry Industry Trends & Analysis
The US automotive lubricants market is projected to exhibit a CAGR of XX% during the forecast period (2025-2033). This growth is attributed to several key factors, including:
Increasing Vehicle Sales: The steady growth in passenger and commercial vehicle sales contributes significantly to the demand for automotive lubricants.
Technological Advancements: Innovations in lubricant formulations, such as synthetic blends and enhanced additives, are leading to improved engine performance and extended oil life.
Rising Consumer Awareness: Growing awareness of the importance of regular lubricant changes and the use of high-quality products is driving demand.
Government Regulations: Stricter emission regulations are driving the adoption of lubricants formulated to meet these standards.
Competitive Dynamics: Intense competition among major players is fostering innovation and driving down prices, making lubricants more accessible to consumers. This also leads to enhanced product offerings and increased market penetration. The market penetration rate for high-performance synthetic lubricants is estimated at XX% in 2025.
Leading Markets & Segments in USA Automotive Lubricants Industry
The passenger vehicle segment dominates the US automotive lubricants market, accounting for approximately XX% of total revenue in 2025. The high volume of passenger vehicles on the road and the frequency of oil changes directly impact this dominance.
By Vehicle Type:
- Passenger Vehicles: Key drivers include high vehicle density, frequent oil changes, and increasing consumer preference for high-quality lubricants.
- Commercial Vehicles: Driven by the heavy-duty nature of these vehicles, demanding robust and long-lasting lubricants. The demand is influenced by factors such as fleet size, mileage, and maintenance schedules.
- Motorcycles: This segment shows [steady/slow/rapid - choose one based on data] growth, driven by [reason for growth or lack thereof].
By Product Type:
- Engine Oils: This segment represents the largest share of the market due to the essential role engine oils play in vehicle performance and longevity.
- Greases: Demand for greases is driven by the need for lubrication in various vehicle components.
- Hydraulic Fluids: This segment's growth is linked to the increasing complexity of vehicle hydraulic systems.
- Transmission & Gear Oils: The demand for transmission and gear oils is directly related to the number of vehicles on the road and their maintenance requirements.
The [Region - choose most dominant region] region exhibits the strongest growth, driven by factors such as [economic policies, infrastructure, etc.].
USA Automotive Lubricants Industry Product Developments
Recent product developments emphasize energy efficiency, extended drain intervals, and improved performance under extreme conditions. Manufacturers are investing heavily in advanced synthetic blends and additive technologies to meet increasingly stringent emission standards and consumer demands for superior lubrication. The focus on bio-based and sustainable lubricant options is also gaining traction, aligning with the growing environmental consciousness.
Key Drivers of USA Automotive Lubricants Industry Growth
Technological advancements in lubricant formulations, coupled with stringent government regulations promoting fuel efficiency and reduced emissions, are primary growth drivers. The sustained growth of the automotive industry and rising disposable incomes also contribute significantly. Increased consumer awareness of the importance of regular vehicle maintenance further fuels market growth.
Challenges in the USA Automotive Lubricants Industry Market
The market faces challenges from fluctuating crude oil prices, intense competition from both domestic and international players, and the emergence of alternative fuel vehicles. Supply chain disruptions and environmental regulations also pose significant hurdles, impacting production costs and profitability. The shift toward electric vehicles represents a long-term threat, although the current dominance of internal combustion engines continues to support market demand.
Emerging Opportunities in USA Automotive Lubricants Industry
The development of bio-based and sustainable lubricants presents significant opportunities. Strategic partnerships between lubricant manufacturers and automotive OEMs, fostering collaborative research and development, are also creating new avenues for growth. Expanding into emerging markets and focusing on high-performance, specialized lubricants are further key strategies driving long-term market growth.
Leading Players in the USA Automotive Lubricants Industry Sector
Key Milestones in USA Automotive Lubricants Industry Industry
- July 2021: Mighty Distributing System partnered with Total Specialties USA, expanding the market reach of Quartz Ineo and Quartz 9000 lubricants. This highlights increased distribution efforts within the aftermarket.
- October 2021: Valvoline and Cummins extended their collaboration agreement, strengthening their market position in heavy-duty diesel engine lubricants. This exemplifies strategic partnerships driving growth.
- January 2022: ExxonMobil reorganized into three business lines, signaling a strategic shift towards a more focused approach within the lubricants sector. This reflects the evolving business landscape and adaptation to market changes.
Strategic Outlook for USA Automotive Lubricants Industry Market
The future of the US automotive lubricants market hinges on technological innovation, strategic partnerships, and a proactive response to the shift towards alternative fuel vehicles. Focusing on sustainable and high-performance lubricants, coupled with robust distribution networks and effective marketing strategies, will be crucial for long-term success. The continued growth of the passenger vehicle segment, coupled with the potential of the commercial vehicle and motorcycle segments, indicates a promising outlook, albeit one that requires careful navigation of emerging challenges.
USA Automotive Lubricants Industry Segmentation
-
1. Vehicle Type
- 1.1. Commercial Vehicles
- 1.2. Motorcycles
- 1.3. Passenger Vehicles
-
2. Product Type
- 2.1. Engine Oils
- 2.2. Greases
- 2.3. Hydraulic Fluids
- 2.4. Transmission & Gear Oils
USA Automotive Lubricants Industry Segmentation By Geography
-
1. North America
- 1.1. United States
- 1.2. Canada
- 1.3. Mexico
-
2. South America
- 2.1. Brazil
- 2.2. Argentina
- 2.3. Rest of South America
-
3. Europe
- 3.1. United Kingdom
- 3.2. Germany
- 3.3. France
- 3.4. Italy
- 3.5. Spain
- 3.6. Russia
- 3.7. Benelux
- 3.8. Nordics
- 3.9. Rest of Europe
-
4. Middle East & Africa
- 4.1. Turkey
- 4.2. Israel
- 4.3. GCC
- 4.4. North Africa
- 4.5. South Africa
- 4.6. Rest of Middle East & Africa
-
5. Asia Pacific
- 5.1. China
- 5.2. India
- 5.3. Japan
- 5.4. South Korea
- 5.5. ASEAN
- 5.6. Oceania
- 5.7. Rest of Asia Pacific
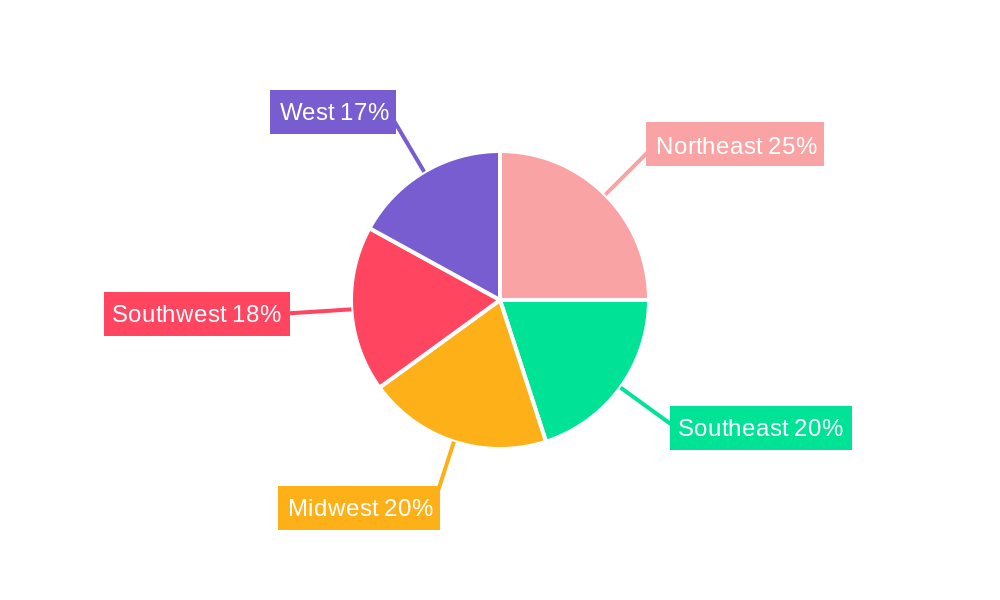
USA Automotive Lubricants Industry Regional Market Share
Geographic Coverage of USA Automotive Lubricants Industry
USA Automotive Lubricants Industry REPORT HIGHLIGHTS
| Aspects | Details |
|---|---|
| Study Period | 2020-2034 |
| Base Year | 2025 |
| Estimated Year | 2026 |
| Forecast Period | 2026-2034 |
| Historical Period | 2020-2025 |
| Growth Rate | CAGR of 4.1% from 2020-2034 |
| Segmentation |
|
Table of Contents
- 1. Introduction
- 1.1. Research Scope
- 1.2. Market Segmentation
- 1.3. Research Objective
- 1.4. Definitions and Assumptions
- 2. Executive Summary
- 2.1. Market Snapshot
- 3. Market Dynamics
- 3.1. Market Drivers
- 3.2. Market Restrains
- 3.3. Market Trends
- 3.4. Market Opportunities
- 4. Market Factor Analysis
- 4.1. Porters Five Forces
- 4.1.1. Bargaining Power of Suppliers
- 4.1.2. Bargaining Power of Buyers
- 4.1.3. Threat of New Entrants
- 4.1.4. Threat of Substitutes
- 4.1.5. Competitive Rivalry
- 4.2. PESTEL analysis
- 4.3. BCG Analysis
- 4.3.1. Stars (High Growth, High Market Share)
- 4.3.2. Cash Cows (Low Growth, High Market Share)
- 4.3.3. Question Mark (High Growth, Low Market Share)
- 4.3.4. Dogs (Low Growth, Low Market Share)
- 4.4. Ansoff Matrix Analysis
- 4.5. Supply Chain Analysis
- 4.6. Regulatory Landscape
- 4.7. Current Market Potential and Opportunity Assessment (TAM–SAM–SOM Framework)
- 4.8. MDP Analyst Note
- 4.1. Porters Five Forces
- 5. Market Analysis, Insights and Forecast 2021-2033
- 5.1. Market Analysis, Insights and Forecast - by Vehicle Type
- 5.1.1. Commercial Vehicles
- 5.1.2. Motorcycles
- 5.1.3. Passenger Vehicles
- 5.2. Market Analysis, Insights and Forecast - by Product Type
- 5.2.1. Engine Oils
- 5.2.2. Greases
- 5.2.3. Hydraulic Fluids
- 5.2.4. Transmission & Gear Oils
- 5.3. Market Analysis, Insights and Forecast - by Region
- 5.3.1. North America
- 5.3.2. South America
- 5.3.3. Europe
- 5.3.4. Middle East & Africa
- 5.3.5. Asia Pacific
- 5.1. Market Analysis, Insights and Forecast - by Vehicle Type
- 6. Global USA Automotive Lubricants Industry Analysis, Insights and Forecast, 2021-2033
- 6.1. Market Analysis, Insights and Forecast - by Vehicle Type
- 6.1.1. Commercial Vehicles
- 6.1.2. Motorcycles
- 6.1.3. Passenger Vehicles
- 6.2. Market Analysis, Insights and Forecast - by Product Type
- 6.2.1. Engine Oils
- 6.2.2. Greases
- 6.2.3. Hydraulic Fluids
- 6.2.4. Transmission & Gear Oils
- 6.1. Market Analysis, Insights and Forecast - by Vehicle Type
- 7. North America USA Automotive Lubricants Industry Analysis, Insights and Forecast, 2020-2032
- 7.1. Market Analysis, Insights and Forecast - by Vehicle Type
- 7.1.1. Commercial Vehicles
- 7.1.2. Motorcycles
- 7.1.3. Passenger Vehicles
- 7.2. Market Analysis, Insights and Forecast - by Product Type
- 7.2.1. Engine Oils
- 7.2.2. Greases
- 7.2.3. Hydraulic Fluids
- 7.2.4. Transmission & Gear Oils
- 7.1. Market Analysis, Insights and Forecast - by Vehicle Type
- 8. South America USA Automotive Lubricants Industry Analysis, Insights and Forecast, 2020-2032
- 8.1. Market Analysis, Insights and Forecast - by Vehicle Type
- 8.1.1. Commercial Vehicles
- 8.1.2. Motorcycles
- 8.1.3. Passenger Vehicles
- 8.2. Market Analysis, Insights and Forecast - by Product Type
- 8.2.1. Engine Oils
- 8.2.2. Greases
- 8.2.3. Hydraulic Fluids
- 8.2.4. Transmission & Gear Oils
- 8.1. Market Analysis, Insights and Forecast - by Vehicle Type
- 9. Europe USA Automotive Lubricants Industry Analysis, Insights and Forecast, 2020-2032
- 9.1. Market Analysis, Insights and Forecast - by Vehicle Type
- 9.1.1. Commercial Vehicles
- 9.1.2. Motorcycles
- 9.1.3. Passenger Vehicles
- 9.2. Market Analysis, Insights and Forecast - by Product Type
- 9.2.1. Engine Oils
- 9.2.2. Greases
- 9.2.3. Hydraulic Fluids
- 9.2.4. Transmission & Gear Oils
- 9.1. Market Analysis, Insights and Forecast - by Vehicle Type
- 10. Middle East & Africa USA Automotive Lubricants Industry Analysis, Insights and Forecast, 2020-2032
- 10.1. Market Analysis, Insights and Forecast - by Vehicle Type
- 10.1.1. Commercial Vehicles
- 10.1.2. Motorcycles
- 10.1.3. Passenger Vehicles
- 10.2. Market Analysis, Insights and Forecast - by Product Type
- 10.2.1. Engine Oils
- 10.2.2. Greases
- 10.2.3. Hydraulic Fluids
- 10.2.4. Transmission & Gear Oils
- 10.1. Market Analysis, Insights and Forecast - by Vehicle Type
- 11. Asia Pacific USA Automotive Lubricants Industry Analysis, Insights and Forecast, 2020-2032
- 11.1. Market Analysis, Insights and Forecast - by Vehicle Type
- 11.1.1. Commercial Vehicles
- 11.1.2. Motorcycles
- 11.1.3. Passenger Vehicles
- 11.2. Market Analysis, Insights and Forecast - by Product Type
- 11.2.1. Engine Oils
- 11.2.2. Greases
- 11.2.3. Hydraulic Fluids
- 11.2.4. Transmission & Gear Oils
- 11.1. Market Analysis, Insights and Forecast - by Vehicle Type
- 12. Competitive Analysis
- 12.1. Company Profiles
- 12.1.1 CITGO
- 12.1.1.1. Company Overview
- 12.1.1.2. Products
- 12.1.1.3. Company Financials
- 12.1.1.4. SWOT Analysis
- 12.1.2 ExxonMobil Corporation
- 12.1.2.1. Company Overview
- 12.1.2.2. Products
- 12.1.2.3. Company Financials
- 12.1.2.4. SWOT Analysis
- 12.1.3 BP PLC (Castrol)
- 12.1.3.1. Company Overview
- 12.1.3.2. Products
- 12.1.3.3. Company Financials
- 12.1.3.4. SWOT Analysis
- 12.1.4 Phillips 66 Lubricants
- 12.1.4.1. Company Overview
- 12.1.4.2. Products
- 12.1.4.3. Company Financials
- 12.1.4.4. SWOT Analysis
- 12.1.5 Motul
- 12.1.5.1. Company Overview
- 12.1.5.2. Products
- 12.1.5.3. Company Financials
- 12.1.5.4. SWOT Analysis
- 12.1.6 Royal Dutch Shell Plc
- 12.1.6.1. Company Overview
- 12.1.6.2. Products
- 12.1.6.3. Company Financials
- 12.1.6.4. SWOT Analysis
- 12.1.7 Chevron Corporation
- 12.1.7.1. Company Overview
- 12.1.7.2. Products
- 12.1.7.3. Company Financials
- 12.1.7.4. SWOT Analysis
- 12.1.8 TotalEnergies
- 12.1.8.1. Company Overview
- 12.1.8.2. Products
- 12.1.8.3. Company Financials
- 12.1.8.4. SWOT Analysis
- 12.1.9 Valvoline Inc
- 12.1.9.1. Company Overview
- 12.1.9.2. Products
- 12.1.9.3. Company Financials
- 12.1.9.4. SWOT Analysis
- 12.1.10 AMSOIL Inc
- 12.1.10.1. Company Overview
- 12.1.10.2. Products
- 12.1.10.3. Company Financials
- 12.1.10.4. SWOT Analysis
- 12.1.1 CITGO
- 12.2. Market Entropy
- 12.2.1 Company's Key Areas Served
- 12.2.2 Recent Developments
- 12.3. Company Market Share Analysis 2025
- 12.3.1 Top 5 Companies Market Share Analysis
- 12.3.2 Top 3 Companies Market Share Analysis
- 12.4. List of Potential Customers
- 13. Research Methodology
List of Figures
- Figure 1: Global USA Automotive Lubricants Industry Revenue Breakdown (billion, %) by Region 2025 & 2033
- Figure 2: Global USA Automotive Lubricants Industry Volume Breakdown (Billion, %) by Region 2025 & 2033
- Figure 3: North America USA Automotive Lubricants Industry Revenue (billion), by Vehicle Type 2025 & 2033
- Figure 4: North America USA Automotive Lubricants Industry Volume (Billion), by Vehicle Type 2025 & 2033
- Figure 5: North America USA Automotive Lubricants Industry Revenue Share (%), by Vehicle Type 2025 & 2033
- Figure 6: North America USA Automotive Lubricants Industry Volume Share (%), by Vehicle Type 2025 & 2033
- Figure 7: North America USA Automotive Lubricants Industry Revenue (billion), by Product Type 2025 & 2033
- Figure 8: North America USA Automotive Lubricants Industry Volume (Billion), by Product Type 2025 & 2033
- Figure 9: North America USA Automotive Lubricants Industry Revenue Share (%), by Product Type 2025 & 2033
- Figure 10: North America USA Automotive Lubricants Industry Volume Share (%), by Product Type 2025 & 2033
- Figure 11: North America USA Automotive Lubricants Industry Revenue (billion), by Country 2025 & 2033
- Figure 12: North America USA Automotive Lubricants Industry Volume (Billion), by Country 2025 & 2033
- Figure 13: North America USA Automotive Lubricants Industry Revenue Share (%), by Country 2025 & 2033
- Figure 14: North America USA Automotive Lubricants Industry Volume Share (%), by Country 2025 & 2033
- Figure 15: South America USA Automotive Lubricants Industry Revenue (billion), by Vehicle Type 2025 & 2033
- Figure 16: South America USA Automotive Lubricants Industry Volume (Billion), by Vehicle Type 2025 & 2033
- Figure 17: South America USA Automotive Lubricants Industry Revenue Share (%), by Vehicle Type 2025 & 2033
- Figure 18: South America USA Automotive Lubricants Industry Volume Share (%), by Vehicle Type 2025 & 2033
- Figure 19: South America USA Automotive Lubricants Industry Revenue (billion), by Product Type 2025 & 2033
- Figure 20: South America USA Automotive Lubricants Industry Volume (Billion), by Product Type 2025 & 2033
- Figure 21: South America USA Automotive Lubricants Industry Revenue Share (%), by Product Type 2025 & 2033
- Figure 22: South America USA Automotive Lubricants Industry Volume Share (%), by Product Type 2025 & 2033
- Figure 23: South America USA Automotive Lubricants Industry Revenue (billion), by Country 2025 & 2033
- Figure 24: South America USA Automotive Lubricants Industry Volume (Billion), by Country 2025 & 2033
- Figure 25: South America USA Automotive Lubricants Industry Revenue Share (%), by Country 2025 & 2033
- Figure 26: South America USA Automotive Lubricants Industry Volume Share (%), by Country 2025 & 2033
- Figure 27: Europe USA Automotive Lubricants Industry Revenue (billion), by Vehicle Type 2025 & 2033
- Figure 28: Europe USA Automotive Lubricants Industry Volume (Billion), by Vehicle Type 2025 & 2033
- Figure 29: Europe USA Automotive Lubricants Industry Revenue Share (%), by Vehicle Type 2025 & 2033
- Figure 30: Europe USA Automotive Lubricants Industry Volume Share (%), by Vehicle Type 2025 & 2033
- Figure 31: Europe USA Automotive Lubricants Industry Revenue (billion), by Product Type 2025 & 2033
- Figure 32: Europe USA Automotive Lubricants Industry Volume (Billion), by Product Type 2025 & 2033
- Figure 33: Europe USA Automotive Lubricants Industry Revenue Share (%), by Product Type 2025 & 2033
- Figure 34: Europe USA Automotive Lubricants Industry Volume Share (%), by Product Type 2025 & 2033
- Figure 35: Europe USA Automotive Lubricants Industry Revenue (billion), by Country 2025 & 2033
- Figure 36: Europe USA Automotive Lubricants Industry Volume (Billion), by Country 2025 & 2033
- Figure 37: Europe USA Automotive Lubricants Industry Revenue Share (%), by Country 2025 & 2033
- Figure 38: Europe USA Automotive Lubricants Industry Volume Share (%), by Country 2025 & 2033
- Figure 39: Middle East & Africa USA Automotive Lubricants Industry Revenue (billion), by Vehicle Type 2025 & 2033
- Figure 40: Middle East & Africa USA Automotive Lubricants Industry Volume (Billion), by Vehicle Type 2025 & 2033
- Figure 41: Middle East & Africa USA Automotive Lubricants Industry Revenue Share (%), by Vehicle Type 2025 & 2033
- Figure 42: Middle East & Africa USA Automotive Lubricants Industry Volume Share (%), by Vehicle Type 2025 & 2033
- Figure 43: Middle East & Africa USA Automotive Lubricants Industry Revenue (billion), by Product Type 2025 & 2033
- Figure 44: Middle East & Africa USA Automotive Lubricants Industry Volume (Billion), by Product Type 2025 & 2033
- Figure 45: Middle East & Africa USA Automotive Lubricants Industry Revenue Share (%), by Product Type 2025 & 2033
- Figure 46: Middle East & Africa USA Automotive Lubricants Industry Volume Share (%), by Product Type 2025 & 2033
- Figure 47: Middle East & Africa USA Automotive Lubricants Industry Revenue (billion), by Country 2025 & 2033
- Figure 48: Middle East & Africa USA Automotive Lubricants Industry Volume (Billion), by Country 2025 & 2033
- Figure 49: Middle East & Africa USA Automotive Lubricants Industry Revenue Share (%), by Country 2025 & 2033
- Figure 50: Middle East & Africa USA Automotive Lubricants Industry Volume Share (%), by Country 2025 & 2033
- Figure 51: Asia Pacific USA Automotive Lubricants Industry Revenue (billion), by Vehicle Type 2025 & 2033
- Figure 52: Asia Pacific USA Automotive Lubricants Industry Volume (Billion), by Vehicle Type 2025 & 2033
- Figure 53: Asia Pacific USA Automotive Lubricants Industry Revenue Share (%), by Vehicle Type 2025 & 2033
- Figure 54: Asia Pacific USA Automotive Lubricants Industry Volume Share (%), by Vehicle Type 2025 & 2033
- Figure 55: Asia Pacific USA Automotive Lubricants Industry Revenue (billion), by Product Type 2025 & 2033
- Figure 56: Asia Pacific USA Automotive Lubricants Industry Volume (Billion), by Product Type 2025 & 2033
- Figure 57: Asia Pacific USA Automotive Lubricants Industry Revenue Share (%), by Product Type 2025 & 2033
- Figure 58: Asia Pacific USA Automotive Lubricants Industry Volume Share (%), by Product Type 2025 & 2033
- Figure 59: Asia Pacific USA Automotive Lubricants Industry Revenue (billion), by Country 2025 & 2033
- Figure 60: Asia Pacific USA Automotive Lubricants Industry Volume (Billion), by Country 2025 & 2033
- Figure 61: Asia Pacific USA Automotive Lubricants Industry Revenue Share (%), by Country 2025 & 2033
- Figure 62: Asia Pacific USA Automotive Lubricants Industry Volume Share (%), by Country 2025 & 2033
List of Tables
- Table 1: Global USA Automotive Lubricants Industry Revenue billion Forecast, by Vehicle Type 2020 & 2033
- Table 2: Global USA Automotive Lubricants Industry Volume Billion Forecast, by Vehicle Type 2020 & 2033
- Table 3: Global USA Automotive Lubricants Industry Revenue billion Forecast, by Product Type 2020 & 2033
- Table 4: Global USA Automotive Lubricants Industry Volume Billion Forecast, by Product Type 2020 & 2033
- Table 5: Global USA Automotive Lubricants Industry Revenue billion Forecast, by Region 2020 & 2033
- Table 6: Global USA Automotive Lubricants Industry Volume Billion Forecast, by Region 2020 & 2033
- Table 7: Global USA Automotive Lubricants Industry Revenue billion Forecast, by Vehicle Type 2020 & 2033
- Table 8: Global USA Automotive Lubricants Industry Volume Billion Forecast, by Vehicle Type 2020 & 2033
- Table 9: Global USA Automotive Lubricants Industry Revenue billion Forecast, by Product Type 2020 & 2033
- Table 10: Global USA Automotive Lubricants Industry Volume Billion Forecast, by Product Type 2020 & 2033
- Table 11: Global USA Automotive Lubricants Industry Revenue billion Forecast, by Country 2020 & 2033
- Table 12: Global USA Automotive Lubricants Industry Volume Billion Forecast, by Country 2020 & 2033
- Table 13: United States USA Automotive Lubricants Industry Revenue (billion) Forecast, by Application 2020 & 2033
- Table 14: United States USA Automotive Lubricants Industry Volume (Billion) Forecast, by Application 2020 & 2033
- Table 15: Canada USA Automotive Lubricants Industry Revenue (billion) Forecast, by Application 2020 & 2033
- Table 16: Canada USA Automotive Lubricants Industry Volume (Billion) Forecast, by Application 2020 & 2033
- Table 17: Mexico USA Automotive Lubricants Industry Revenue (billion) Forecast, by Application 2020 & 2033
- Table 18: Mexico USA Automotive Lubricants Industry Volume (Billion) Forecast, by Application 2020 & 2033
- Table 19: Global USA Automotive Lubricants Industry Revenue billion Forecast, by Vehicle Type 2020 & 2033
- Table 20: Global USA Automotive Lubricants Industry Volume Billion Forecast, by Vehicle Type 2020 & 2033
- Table 21: Global USA Automotive Lubricants Industry Revenue billion Forecast, by Product Type 2020 & 2033
- Table 22: Global USA Automotive Lubricants Industry Volume Billion Forecast, by Product Type 2020 & 2033
- Table 23: Global USA Automotive Lubricants Industry Revenue billion Forecast, by Country 2020 & 2033
- Table 24: Global USA Automotive Lubricants Industry Volume Billion Forecast, by Country 2020 & 2033
- Table 25: Brazil USA Automotive Lubricants Industry Revenue (billion) Forecast, by Application 2020 & 2033
- Table 26: Brazil USA Automotive Lubricants Industry Volume (Billion) Forecast, by Application 2020 & 2033
- Table 27: Argentina USA Automotive Lubricants Industry Revenue (billion) Forecast, by Application 2020 & 2033
- Table 28: Argentina USA Automotive Lubricants Industry Volume (Billion) Forecast, by Application 2020 & 2033
- Table 29: Rest of South America USA Automotive Lubricants Industry Revenue (billion) Forecast, by Application 2020 & 2033
- Table 30: Rest of South America USA Automotive Lubricants Industry Volume (Billion) Forecast, by Application 2020 & 2033
- Table 31: Global USA Automotive Lubricants Industry Revenue billion Forecast, by Vehicle Type 2020 & 2033
- Table 32: Global USA Automotive Lubricants Industry Volume Billion Forecast, by Vehicle Type 2020 & 2033
- Table 33: Global USA Automotive Lubricants Industry Revenue billion Forecast, by Product Type 2020 & 2033
- Table 34: Global USA Automotive Lubricants Industry Volume Billion Forecast, by Product Type 2020 & 2033
- Table 35: Global USA Automotive Lubricants Industry Revenue billion Forecast, by Country 2020 & 2033
- Table 36: Global USA Automotive Lubricants Industry Volume Billion Forecast, by Country 2020 & 2033
- Table 37: United Kingdom USA Automotive Lubricants Industry Revenue (billion) Forecast, by Application 2020 & 2033
- Table 38: United Kingdom USA Automotive Lubricants Industry Volume (Billion) Forecast, by Application 2020 & 2033
- Table 39: Germany USA Automotive Lubricants Industry Revenue (billion) Forecast, by Application 2020 & 2033
- Table 40: Germany USA Automotive Lubricants Industry Volume (Billion) Forecast, by Application 2020 & 2033
- Table 41: France USA Automotive Lubricants Industry Revenue (billion) Forecast, by Application 2020 & 2033
- Table 42: France USA Automotive Lubricants Industry Volume (Billion) Forecast, by Application 2020 & 2033
- Table 43: Italy USA Automotive Lubricants Industry Revenue (billion) Forecast, by Application 2020 & 2033
- Table 44: Italy USA Automotive Lubricants Industry Volume (Billion) Forecast, by Application 2020 & 2033
- Table 45: Spain USA Automotive Lubricants Industry Revenue (billion) Forecast, by Application 2020 & 2033
- Table 46: Spain USA Automotive Lubricants Industry Volume (Billion) Forecast, by Application 2020 & 2033
- Table 47: Russia USA Automotive Lubricants Industry Revenue (billion) Forecast, by Application 2020 & 2033
- Table 48: Russia USA Automotive Lubricants Industry Volume (Billion) Forecast, by Application 2020 & 2033
- Table 49: Benelux USA Automotive Lubricants Industry Revenue (billion) Forecast, by Application 2020 & 2033
- Table 50: Benelux USA Automotive Lubricants Industry Volume (Billion) Forecast, by Application 2020 & 2033
- Table 51: Nordics USA Automotive Lubricants Industry Revenue (billion) Forecast, by Application 2020 & 2033
- Table 52: Nordics USA Automotive Lubricants Industry Volume (Billion) Forecast, by Application 2020 & 2033
- Table 53: Rest of Europe USA Automotive Lubricants Industry Revenue (billion) Forecast, by Application 2020 & 2033
- Table 54: Rest of Europe USA Automotive Lubricants Industry Volume (Billion) Forecast, by Application 2020 & 2033
- Table 55: Global USA Automotive Lubricants Industry Revenue billion Forecast, by Vehicle Type 2020 & 2033
- Table 56: Global USA Automotive Lubricants Industry Volume Billion Forecast, by Vehicle Type 2020 & 2033
- Table 57: Global USA Automotive Lubricants Industry Revenue billion Forecast, by Product Type 2020 & 2033
- Table 58: Global USA Automotive Lubricants Industry Volume Billion Forecast, by Product Type 2020 & 2033
- Table 59: Global USA Automotive Lubricants Industry Revenue billion Forecast, by Country 2020 & 2033
- Table 60: Global USA Automotive Lubricants Industry Volume Billion Forecast, by Country 2020 & 2033
- Table 61: Turkey USA Automotive Lubricants Industry Revenue (billion) Forecast, by Application 2020 & 2033
- Table 62: Turkey USA Automotive Lubricants Industry Volume (Billion) Forecast, by Application 2020 & 2033
- Table 63: Israel USA Automotive Lubricants Industry Revenue (billion) Forecast, by Application 2020 & 2033
- Table 64: Israel USA Automotive Lubricants Industry Volume (Billion) Forecast, by Application 2020 & 2033
- Table 65: GCC USA Automotive Lubricants Industry Revenue (billion) Forecast, by Application 2020 & 2033
- Table 66: GCC USA Automotive Lubricants Industry Volume (Billion) Forecast, by Application 2020 & 2033
- Table 67: North Africa USA Automotive Lubricants Industry Revenue (billion) Forecast, by Application 2020 & 2033
- Table 68: North Africa USA Automotive Lubricants Industry Volume (Billion) Forecast, by Application 2020 & 2033
- Table 69: South Africa USA Automotive Lubricants Industry Revenue (billion) Forecast, by Application 2020 & 2033
- Table 70: South Africa USA Automotive Lubricants Industry Volume (Billion) Forecast, by Application 2020 & 2033
- Table 71: Rest of Middle East & Africa USA Automotive Lubricants Industry Revenue (billion) Forecast, by Application 2020 & 2033
- Table 72: Rest of Middle East & Africa USA Automotive Lubricants Industry Volume (Billion) Forecast, by Application 2020 & 2033
- Table 73: Global USA Automotive Lubricants Industry Revenue billion Forecast, by Vehicle Type 2020 & 2033
- Table 74: Global USA Automotive Lubricants Industry Volume Billion Forecast, by Vehicle Type 2020 & 2033
- Table 75: Global USA Automotive Lubricants Industry Revenue billion Forecast, by Product Type 2020 & 2033
- Table 76: Global USA Automotive Lubricants Industry Volume Billion Forecast, by Product Type 2020 & 2033
- Table 77: Global USA Automotive Lubricants Industry Revenue billion Forecast, by Country 2020 & 2033
- Table 78: Global USA Automotive Lubricants Industry Volume Billion Forecast, by Country 2020 & 2033
- Table 79: China USA Automotive Lubricants Industry Revenue (billion) Forecast, by Application 2020 & 2033
- Table 80: China USA Automotive Lubricants Industry Volume (Billion) Forecast, by Application 2020 & 2033
- Table 81: India USA Automotive Lubricants Industry Revenue (billion) Forecast, by Application 2020 & 2033
- Table 82: India USA Automotive Lubricants Industry Volume (Billion) Forecast, by Application 2020 & 2033
- Table 83: Japan USA Automotive Lubricants Industry Revenue (billion) Forecast, by Application 2020 & 2033
- Table 84: Japan USA Automotive Lubricants Industry Volume (Billion) Forecast, by Application 2020 & 2033
- Table 85: South Korea USA Automotive Lubricants Industry Revenue (billion) Forecast, by Application 2020 & 2033
- Table 86: South Korea USA Automotive Lubricants Industry Volume (Billion) Forecast, by Application 2020 & 2033
- Table 87: ASEAN USA Automotive Lubricants Industry Revenue (billion) Forecast, by Application 2020 & 2033
- Table 88: ASEAN USA Automotive Lubricants Industry Volume (Billion) Forecast, by Application 2020 & 2033
- Table 89: Oceania USA Automotive Lubricants Industry Revenue (billion) Forecast, by Application 2020 & 2033
- Table 90: Oceania USA Automotive Lubricants Industry Volume (Billion) Forecast, by Application 2020 & 2033
- Table 91: Rest of Asia Pacific USA Automotive Lubricants Industry Revenue (billion) Forecast, by Application 2020 & 2033
- Table 92: Rest of Asia Pacific USA Automotive Lubricants Industry Volume (Billion) Forecast, by Application 2020 & 2033
Frequently Asked Questions
1. What is the projected Compound Annual Growth Rate (CAGR) of the USA Automotive Lubricants Industry?
The projected CAGR is approximately 4.1%.
2. Which companies are prominent players in the USA Automotive Lubricants Industry?
Key companies in the market include CITGO, ExxonMobil Corporation, BP PLC (Castrol), Phillips 66 Lubricants, Motul, Royal Dutch Shell Plc, Chevron Corporation, TotalEnergies, Valvoline Inc, AMSOIL Inc.
3. What are the main segments of the USA Automotive Lubricants Industry?
The market segments include Vehicle Type, Product Type.
4. Can you provide details about the market size?
The market size is estimated to be USD 25.7 billion as of 2022.
5. What are some drivers contributing to market growth?
Increasing Automotive Production and Sales; Increasing Adoption of High-performance Lubricants.
6. What are the notable trends driving market growth?
Largest Segment By Vehicle Type : <span style="font-family: 'regular_bold';color:#0e7db3;">Passenger Vehicles</span>.
7. Are there any restraints impacting market growth?
Extended Drain Intervals; Modest Impact of Electric Vehicles (EVs) in the Future.
8. Can you provide examples of recent developments in the market?
January 2022: Effective April 1, ExxonMobil Corporation was organized along three business lines - ExxonMobil Upstream Company, ExxonMobil Product Solutions and ExxonMobil Low Carbon Solutions.October 2021: Valvoline and Cummins extended their long-standing marketing and technology collaboration agreement for another five years. Cummins will endorse and promote Valvoline's Premium Blue engine oil for its heavy-duty diesel engines and generators and will distribute Valvoline products through its global distribution networks.July 2021: Mighty Distributing System (Mighty Auto Parts), a pioneer in automotive aftermarket goods and services, announced a new relationship with Total Specialties USA. It would target the Quartz Ineo and Quartz 9000 sub-ranges, geared for light automobiles and meet European OEMs' most stringent criteria.
9. What pricing options are available for accessing the report?
Pricing options include single-user, multi-user, and enterprise licenses priced at USD 3800, USD 4500, and USD 5800 respectively.
10. Is the market size provided in terms of value or volume?
The market size is provided in terms of value, measured in billion and volume, measured in Billion.
11. Are there any specific market keywords associated with the report?
Yes, the market keyword associated with the report is "USA Automotive Lubricants Industry," which aids in identifying and referencing the specific market segment covered.
12. How do I determine which pricing option suits my needs best?
The pricing options vary based on user requirements and access needs. Individual users may opt for single-user licenses, while businesses requiring broader access may choose multi-user or enterprise licenses for cost-effective access to the report.
13. Are there any additional resources or data provided in the USA Automotive Lubricants Industry report?
While the report offers comprehensive insights, it's advisable to review the specific contents or supplementary materials provided to ascertain if additional resources or data are available.
14. How can I stay updated on further developments or reports in the USA Automotive Lubricants Industry?
To stay informed about further developments, trends, and reports in the USA Automotive Lubricants Industry, consider subscribing to industry newsletters, following relevant companies and organizations, or regularly checking reputable industry news sources and publications.
Methodology
Step 1 - Identification of Relevant Samples Size from Population Database


Step 2 - Approaches for Defining Global Market Size (Value, Volume* & Price*)

Note*: In applicable scenarios
Step 3 - Data Sources
Primary Research
- Web Analytics
- Survey Reports
- Research Institute
- Latest Research Reports
- Opinion Leaders
Secondary Research
- Annual Reports
- White Paper
- Latest Press Release
- Industry Association
- Paid Database
- Investor Presentations

Step 4 - Data Triangulation
Involves using different sources of information in order to increase the validity of a study
These sources are likely to be stakeholders in a program - participants, other researchers, program staff, other community members, and so on.
Then we put all data in single framework & apply various statistical tools to find out the dynamic on the market.
During the analysis stage, feedback from the stakeholder groups would be compared to determine areas of agreement as well as areas of divergence