

Key Insights
The United States pressure-sensitive adhesives (PSA) market is poised for substantial growth, projected at a CAGR of 6% from 2025 to 2033. With a market size of $9.9 billion in the base year of 2025, this expansion is fueled by increasing demand across key sectors. The burgeoning e-commerce and food packaging industries are significant drivers, requiring high-performance PSAs for secure sealing and labeling. The construction and woodworking sectors also contribute, utilizing PSAs in tapes and labels. Furthermore, advancements in medical and electronics industries, demanding specialized PSAs with properties like biocompatibility and high temperature resistance, are stimulating market expansion. Technological innovations, including eco-friendly water-based PSAs and high-performance hot melt adhesives, are crucial growth enablers.
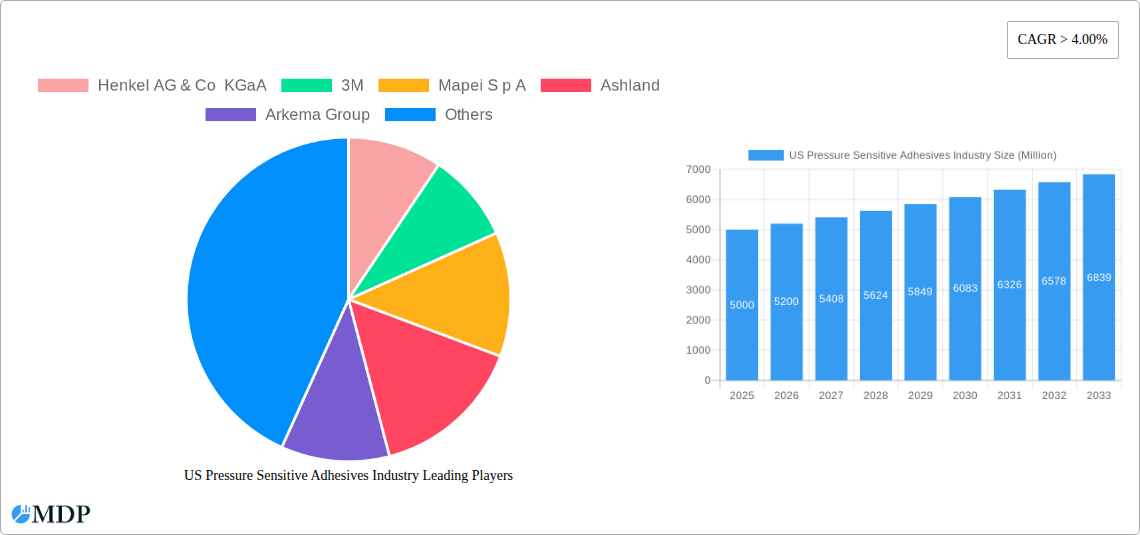
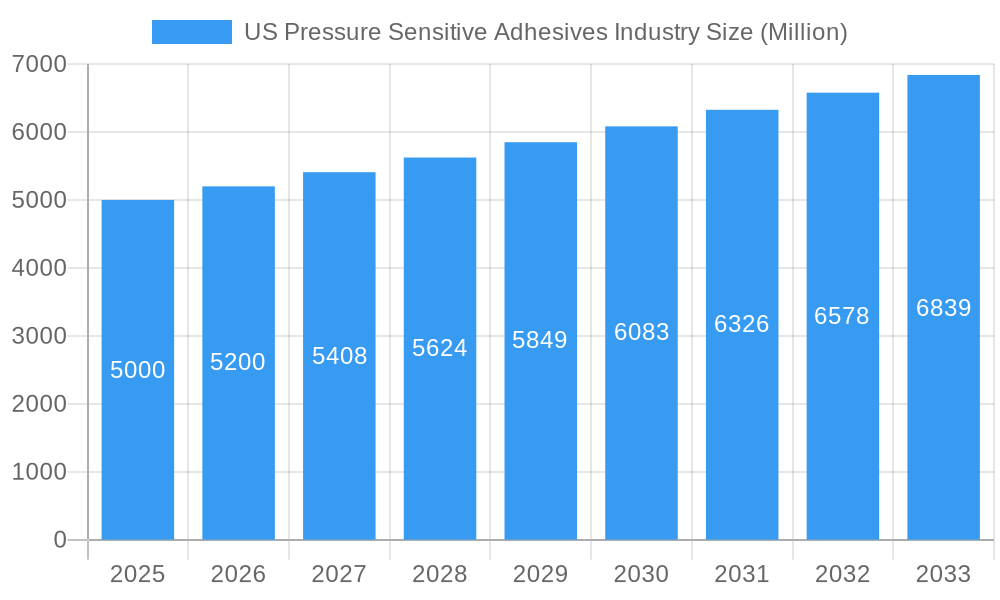
US Pressure Sensitive Adhesives Industry Market Size (In Billion)
Market restraints include raw material price volatility for resins and solvents, impacting profitability. Increasing environmental regulations on volatile organic compounds (VOCs) necessitate the adoption of sustainable PSA formulations, potentially leading to higher upfront costs. Despite these challenges, the long-term outlook for the US PSA market remains robust, with anticipated growth in specialized, high-performance adhesive applications. Leading players such as Henkel, 3M, and Mapei are actively investing in R&D to meet evolving market demands. Regional growth is expected to be stronger in the Northeast and West due to industry concentration.
US Pressure Sensitive Adhesives Industry Company Market Share
US Pressure Sensitive Adhesives Market Analysis: Size, Growth, and Forecast (2025-2033)
This comprehensive report offers invaluable insights into the US pressure-sensitive adhesives (PSA) industry, covering the period from 2025 to 2033. Leveraging rigorous data analysis and expert perspectives, it provides a clear overview of market trends, growth drivers, challenges, and opportunities within this dynamic sector.
US Pressure Sensitive Adhesives Industry Market Dynamics & Concentration
The US pressure sensitive adhesives market is characterized by a moderately concentrated landscape, with key players such as Henkel AG & Co KGaA, 3M, Mapei S.p.A., Ashland, Arkema Group, Dow, H.B. Fuller Company, Franklin International, Sika AG, Jowat SE, and Wacker Chemie AG holding significant market share. However, the presence of numerous smaller players indicates opportunities for both consolidation and niche market penetration. Innovation is a critical driver, with companies continually developing new adhesive technologies to meet evolving end-user demands for higher performance, sustainability, and cost-effectiveness. Stringent environmental regulations, particularly regarding volatile organic compounds (VOCs), are shaping the industry's trajectory, pushing manufacturers toward water-based and other eco-friendly solutions. The market also experiences pressure from substitute materials like mechanical fasteners, but the versatility and ease of application of PSAs continue to sustain strong demand. Significant mergers and acquisitions (M&A) activity in recent years reflects industry consolidation and expansion strategies. For example, the estimated number of M&A deals in the period 2019-2024 was xx. Market share data for 2025 suggests that the top 5 players control approximately xx% of the market.
- Market Concentration: Moderately concentrated, with top players holding significant shares, but also space for smaller players.
- Innovation Drivers: Demand for higher performance, sustainability, and cost-effective solutions.
- Regulatory Framework: Stringent environmental regulations driving adoption of eco-friendly alternatives.
- Product Substitutes: Mechanical fasteners, though PSA versatility maintains strong demand.
- End-User Trends: Shifting preferences towards specialized applications and sustainable products.
- M&A Activity: Significant consolidation and expansion through mergers and acquisitions; estimated xx deals between 2019-2024.
US Pressure Sensitive Adhesives Industry Industry Trends & Analysis
The US pressure sensitive adhesives market exhibits robust growth, driven by several key factors. The Packaging segment shows especially strong growth, projected at a CAGR of xx% during the forecast period (2025-2033). Technological advancements, particularly in water-based and hot melt adhesives, cater to increasing sustainability concerns and enhance performance across various applications. Consumer preference for convenience and easy-to-use products further fuels demand. However, fluctuating raw material prices and supply chain disruptions pose challenges. The market penetration of water-based adhesives is estimated to reach xx% by 2033, reflecting a growing preference for environmentally friendly solutions. Intense competition among established players and new entrants necessitates continuous innovation and strategic partnerships to maintain market share. The overall market size in 2025 is estimated at $xx Million, and is projected to reach $xx Million by 2033, demonstrating significant growth potential.
Leading Markets & Segments in US Pressure Sensitive Adhesives Industry
The Packaging end-user industry dominates the US pressure sensitive adhesives market, driven by high demand for labels, tapes, and other adhesive solutions in food, beverage, and consumer goods packaging. The Acrylics resin segment holds the largest market share due to its versatility, cost-effectiveness, and superior performance characteristics. Within technologies, Hot Melt adhesives are experiencing strong growth, owing to their high productivity and ease of application. Growth in the Packaging segment is further driven by factors like:
- Increased E-commerce: Driving demand for robust and efficient packaging solutions.
- Growth in Food and Beverage Industries: Leading to a higher consumption of pressure-sensitive adhesive labels.
- Rising Demand for Customized Packaging: Requiring specialized adhesive properties.
The Transportation sector also shows promise with significant growth expected in automotive applications. Geographically, the market is concentrated in regions with robust manufacturing industries.
US Pressure Sensitive Adhesives Industry Product Developments
Recent product innovations have focused on developing high-performance, eco-friendly adhesives that meet the stringent requirements of various applications. The introduction of bio-based and recyclable adhesives is gaining traction, addressing growing sustainability concerns. Companies are also developing customized solutions to meet specific industry needs, such as high-temperature resistance adhesives for electronics and medical applications. These developments are creating new opportunities in niche segments and driving competitive advantages.
Key Drivers of US Pressure Sensitive Adhesives Industry Growth
Several factors are driving the growth of the US pressure sensitive adhesives market. These include:
- Technological advancements: Development of high-performance, eco-friendly adhesives.
- Expanding end-user industries: Growth in e-commerce, food and beverage, and healthcare sectors.
- Favorable economic conditions: Supporting investments in manufacturing and packaging.
- Government regulations: Promoting sustainable packaging solutions.
Challenges in the US Pressure Sensitive Adhesives Industry Market
The US pressure sensitive adhesives market faces several challenges including:
- Fluctuating raw material prices: Impacting profitability and pricing strategies.
- Supply chain disruptions: Creating production delays and impacting availability.
- Intense competition: Requiring continuous innovation and cost optimization.
- Environmental regulations: Increasing compliance costs and limiting the use of certain materials.
Emerging Opportunities in US Pressure Sensitive Adhesives Industry
The US pressure sensitive adhesives market presents several promising opportunities. The increasing demand for sustainable and specialized adhesive solutions creates substantial growth potential. Strategic partnerships and collaborations between adhesive manufacturers and end-users can facilitate the development and adoption of innovative technologies. Furthermore, expansion into emerging markets, such as the growing renewable energy sector, can unlock additional growth avenues.
Leading Players in the US Pressure Sensitive Adhesives Industry Sector
Key Milestones in US Pressure Sensitive Adhesives Industry Industry
- 2020: Introduction of a new bio-based adhesive by Company X.
- 2021: Merger between Company Y and Company Z, creating a larger market player.
- 2022: Launch of a high-temperature adhesive for electronics applications by Company A.
- 2023: Implementation of new environmental regulations affecting adhesive manufacturing.
- 2024: Significant investment in R&D for sustainable adhesives by Company B.
(Note: Specific company names and details of milestones will be replaced with actual data in the final report.)
Strategic Outlook for US Pressure Sensitive Adhesives Industry Market
The future of the US pressure sensitive adhesives market is bright, driven by continued innovation, increasing demand across diverse end-user industries, and a growing emphasis on sustainability. Strategic opportunities lie in developing customized solutions, exploring new applications, and forging strategic partnerships to secure a competitive edge. Focusing on environmentally friendly and high-performance materials will be crucial for long-term success in this dynamic and evolving market.
US Pressure Sensitive Adhesives Industry Segmentation
-
1. Resin
- 1.1. Acrylics
- 1.2. Silicones
- 1.3. Elastomers
- 1.4. Other Resins
-
2. Technology
- 2.1. Water-based
- 2.2. Solvent-based
- 2.3. Hot Melt
- 2.4. Radiation
-
3. Application
- 3.1. Tapes
- 3.2. Labels
- 3.3. Graphics
- 3.4. Other Applications
-
4. End-user Industry
- 4.1. Packaging
- 4.2. Woodworking and Joinery
- 4.3. Medical
- 4.4. Commercial Graphics
- 4.5. Transportation
- 4.6. Electronics
- 4.7. Other End-user Industries
US Pressure Sensitive Adhesives Industry Segmentation By Geography
-
1. North America
- 1.1. United States
- 1.2. Canada
- 1.3. Mexico
-
2. South America
- 2.1. Brazil
- 2.2. Argentina
- 2.3. Rest of South America
-
3. Europe
- 3.1. United Kingdom
- 3.2. Germany
- 3.3. France
- 3.4. Italy
- 3.5. Spain
- 3.6. Russia
- 3.7. Benelux
- 3.8. Nordics
- 3.9. Rest of Europe
-
4. Middle East & Africa
- 4.1. Turkey
- 4.2. Israel
- 4.3. GCC
- 4.4. North Africa
- 4.5. South Africa
- 4.6. Rest of Middle East & Africa
-
5. Asia Pacific
- 5.1. China
- 5.2. India
- 5.3. Japan
- 5.4. South Korea
- 5.5. ASEAN
- 5.6. Oceania
- 5.7. Rest of Asia Pacific
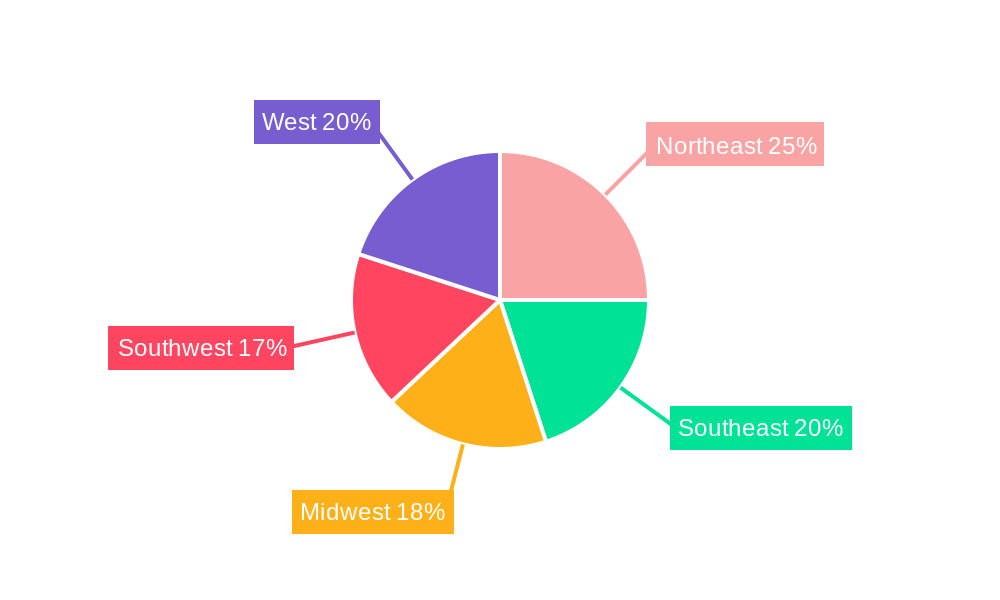
US Pressure Sensitive Adhesives Industry Regional Market Share
Geographic Coverage of US Pressure Sensitive Adhesives Industry
US Pressure Sensitive Adhesives Industry REPORT HIGHLIGHTS
| Aspects | Details |
|---|---|
| Study Period | 2020-2034 |
| Base Year | 2025 |
| Estimated Year | 2026 |
| Forecast Period | 2026-2034 |
| Historical Period | 2020-2025 |
| Growth Rate | CAGR of 6% from 2020-2034 |
| Segmentation |
|
Table of Contents
- 1. Introduction
- 1.1. Research Scope
- 1.2. Market Segmentation
- 1.3. Research Objective
- 1.4. Definitions and Assumptions
- 2. Executive Summary
- 2.1. Market Snapshot
- 3. Market Dynamics
- 3.1. Market Drivers
- 3.2. Market Restrains
- 3.3. Market Trends
- 3.4. Market Opportunities
- 4. Market Factor Analysis
- 4.1. Porters Five Forces
- 4.1.1. Bargaining Power of Suppliers
- 4.1.2. Bargaining Power of Buyers
- 4.1.3. Threat of New Entrants
- 4.1.4. Threat of Substitutes
- 4.1.5. Competitive Rivalry
- 4.2. PESTEL analysis
- 4.3. BCG Analysis
- 4.3.1. Stars (High Growth, High Market Share)
- 4.3.2. Cash Cows (Low Growth, High Market Share)
- 4.3.3. Question Mark (High Growth, Low Market Share)
- 4.3.4. Dogs (Low Growth, Low Market Share)
- 4.4. Ansoff Matrix Analysis
- 4.5. Supply Chain Analysis
- 4.6. Regulatory Landscape
- 4.7. Current Market Potential and Opportunity Assessment (TAM–SAM–SOM Framework)
- 4.8. MDP Analyst Note
- 4.1. Porters Five Forces
- 5. Market Analysis, Insights and Forecast 2021-2033
- 5.1. Market Analysis, Insights and Forecast - by Resin
- 5.1.1. Acrylics
- 5.1.2. Silicones
- 5.1.3. Elastomers
- 5.1.4. Other Resins
- 5.2. Market Analysis, Insights and Forecast - by Technology
- 5.2.1. Water-based
- 5.2.2. Solvent-based
- 5.2.3. Hot Melt
- 5.2.4. Radiation
- 5.3. Market Analysis, Insights and Forecast - by Application
- 5.3.1. Tapes
- 5.3.2. Labels
- 5.3.3. Graphics
- 5.3.4. Other Applications
- 5.4. Market Analysis, Insights and Forecast - by End-user Industry
- 5.4.1. Packaging
- 5.4.2. Woodworking and Joinery
- 5.4.3. Medical
- 5.4.4. Commercial Graphics
- 5.4.5. Transportation
- 5.4.6. Electronics
- 5.4.7. Other End-user Industries
- 5.5. Market Analysis, Insights and Forecast - by Region
- 5.5.1. North America
- 5.5.2. South America
- 5.5.3. Europe
- 5.5.4. Middle East & Africa
- 5.5.5. Asia Pacific
- 5.1. Market Analysis, Insights and Forecast - by Resin
- 6. Global US Pressure Sensitive Adhesives Industry Analysis, Insights and Forecast, 2021-2033
- 6.1. Market Analysis, Insights and Forecast - by Resin
- 6.1.1. Acrylics
- 6.1.2. Silicones
- 6.1.3. Elastomers
- 6.1.4. Other Resins
- 6.2. Market Analysis, Insights and Forecast - by Technology
- 6.2.1. Water-based
- 6.2.2. Solvent-based
- 6.2.3. Hot Melt
- 6.2.4. Radiation
- 6.3. Market Analysis, Insights and Forecast - by Application
- 6.3.1. Tapes
- 6.3.2. Labels
- 6.3.3. Graphics
- 6.3.4. Other Applications
- 6.4. Market Analysis, Insights and Forecast - by End-user Industry
- 6.4.1. Packaging
- 6.4.2. Woodworking and Joinery
- 6.4.3. Medical
- 6.4.4. Commercial Graphics
- 6.4.5. Transportation
- 6.4.6. Electronics
- 6.4.7. Other End-user Industries
- 6.1. Market Analysis, Insights and Forecast - by Resin
- 7. North America US Pressure Sensitive Adhesives Industry Analysis, Insights and Forecast, 2020-2032
- 7.1. Market Analysis, Insights and Forecast - by Resin
- 7.1.1. Acrylics
- 7.1.2. Silicones
- 7.1.3. Elastomers
- 7.1.4. Other Resins
- 7.2. Market Analysis, Insights and Forecast - by Technology
- 7.2.1. Water-based
- 7.2.2. Solvent-based
- 7.2.3. Hot Melt
- 7.2.4. Radiation
- 7.3. Market Analysis, Insights and Forecast - by Application
- 7.3.1. Tapes
- 7.3.2. Labels
- 7.3.3. Graphics
- 7.3.4. Other Applications
- 7.4. Market Analysis, Insights and Forecast - by End-user Industry
- 7.4.1. Packaging
- 7.4.2. Woodworking and Joinery
- 7.4.3. Medical
- 7.4.4. Commercial Graphics
- 7.4.5. Transportation
- 7.4.6. Electronics
- 7.4.7. Other End-user Industries
- 7.1. Market Analysis, Insights and Forecast - by Resin
- 8. South America US Pressure Sensitive Adhesives Industry Analysis, Insights and Forecast, 2020-2032
- 8.1. Market Analysis, Insights and Forecast - by Resin
- 8.1.1. Acrylics
- 8.1.2. Silicones
- 8.1.3. Elastomers
- 8.1.4. Other Resins
- 8.2. Market Analysis, Insights and Forecast - by Technology
- 8.2.1. Water-based
- 8.2.2. Solvent-based
- 8.2.3. Hot Melt
- 8.2.4. Radiation
- 8.3. Market Analysis, Insights and Forecast - by Application
- 8.3.1. Tapes
- 8.3.2. Labels
- 8.3.3. Graphics
- 8.3.4. Other Applications
- 8.4. Market Analysis, Insights and Forecast - by End-user Industry
- 8.4.1. Packaging
- 8.4.2. Woodworking and Joinery
- 8.4.3. Medical
- 8.4.4. Commercial Graphics
- 8.4.5. Transportation
- 8.4.6. Electronics
- 8.4.7. Other End-user Industries
- 8.1. Market Analysis, Insights and Forecast - by Resin
- 9. Europe US Pressure Sensitive Adhesives Industry Analysis, Insights and Forecast, 2020-2032
- 9.1. Market Analysis, Insights and Forecast - by Resin
- 9.1.1. Acrylics
- 9.1.2. Silicones
- 9.1.3. Elastomers
- 9.1.4. Other Resins
- 9.2. Market Analysis, Insights and Forecast - by Technology
- 9.2.1. Water-based
- 9.2.2. Solvent-based
- 9.2.3. Hot Melt
- 9.2.4. Radiation
- 9.3. Market Analysis, Insights and Forecast - by Application
- 9.3.1. Tapes
- 9.3.2. Labels
- 9.3.3. Graphics
- 9.3.4. Other Applications
- 9.4. Market Analysis, Insights and Forecast - by End-user Industry
- 9.4.1. Packaging
- 9.4.2. Woodworking and Joinery
- 9.4.3. Medical
- 9.4.4. Commercial Graphics
- 9.4.5. Transportation
- 9.4.6. Electronics
- 9.4.7. Other End-user Industries
- 9.1. Market Analysis, Insights and Forecast - by Resin
- 10. Middle East & Africa US Pressure Sensitive Adhesives Industry Analysis, Insights and Forecast, 2020-2032
- 10.1. Market Analysis, Insights and Forecast - by Resin
- 10.1.1. Acrylics
- 10.1.2. Silicones
- 10.1.3. Elastomers
- 10.1.4. Other Resins
- 10.2. Market Analysis, Insights and Forecast - by Technology
- 10.2.1. Water-based
- 10.2.2. Solvent-based
- 10.2.3. Hot Melt
- 10.2.4. Radiation
- 10.3. Market Analysis, Insights and Forecast - by Application
- 10.3.1. Tapes
- 10.3.2. Labels
- 10.3.3. Graphics
- 10.3.4. Other Applications
- 10.4. Market Analysis, Insights and Forecast - by End-user Industry
- 10.4.1. Packaging
- 10.4.2. Woodworking and Joinery
- 10.4.3. Medical
- 10.4.4. Commercial Graphics
- 10.4.5. Transportation
- 10.4.6. Electronics
- 10.4.7. Other End-user Industries
- 10.1. Market Analysis, Insights and Forecast - by Resin
- 11. Asia Pacific US Pressure Sensitive Adhesives Industry Analysis, Insights and Forecast, 2020-2032
- 11.1. Market Analysis, Insights and Forecast - by Resin
- 11.1.1. Acrylics
- 11.1.2. Silicones
- 11.1.3. Elastomers
- 11.1.4. Other Resins
- 11.2. Market Analysis, Insights and Forecast - by Technology
- 11.2.1. Water-based
- 11.2.2. Solvent-based
- 11.2.3. Hot Melt
- 11.2.4. Radiation
- 11.3. Market Analysis, Insights and Forecast - by Application
- 11.3.1. Tapes
- 11.3.2. Labels
- 11.3.3. Graphics
- 11.3.4. Other Applications
- 11.4. Market Analysis, Insights and Forecast - by End-user Industry
- 11.4.1. Packaging
- 11.4.2. Woodworking and Joinery
- 11.4.3. Medical
- 11.4.4. Commercial Graphics
- 11.4.5. Transportation
- 11.4.6. Electronics
- 11.4.7. Other End-user Industries
- 11.1. Market Analysis, Insights and Forecast - by Resin
- 12. Competitive Analysis
- 12.1. Company Profiles
- 12.1.1 Henkel AG & Co KGaA
- 12.1.1.1. Company Overview
- 12.1.1.2. Products
- 12.1.1.3. Company Financials
- 12.1.1.4. SWOT Analysis
- 12.1.2 3M
- 12.1.2.1. Company Overview
- 12.1.2.2. Products
- 12.1.2.3. Company Financials
- 12.1.2.4. SWOT Analysis
- 12.1.3 Mapei S p A
- 12.1.3.1. Company Overview
- 12.1.3.2. Products
- 12.1.3.3. Company Financials
- 12.1.3.4. SWOT Analysis
- 12.1.4 Ashland
- 12.1.4.1. Company Overview
- 12.1.4.2. Products
- 12.1.4.3. Company Financials
- 12.1.4.4. SWOT Analysis
- 12.1.5 Arkema Group
- 12.1.5.1. Company Overview
- 12.1.5.2. Products
- 12.1.5.3. Company Financials
- 12.1.5.4. SWOT Analysis
- 12.1.6 Dow
- 12.1.6.1. Company Overview
- 12.1.6.2. Products
- 12.1.6.3. Company Financials
- 12.1.6.4. SWOT Analysis
- 12.1.7 H B Fuller Company
- 12.1.7.1. Company Overview
- 12.1.7.2. Products
- 12.1.7.3. Company Financials
- 12.1.7.4. SWOT Analysis
- 12.1.8 Franklin International
- 12.1.8.1. Company Overview
- 12.1.8.2. Products
- 12.1.8.3. Company Financials
- 12.1.8.4. SWOT Analysis
- 12.1.9 Sika AG
- 12.1.9.1. Company Overview
- 12.1.9.2. Products
- 12.1.9.3. Company Financials
- 12.1.9.4. SWOT Analysis
- 12.1.10 Jowat SE
- 12.1.10.1. Company Overview
- 12.1.10.2. Products
- 12.1.10.3. Company Financials
- 12.1.10.4. SWOT Analysis
- 12.1.11 Wacker Chemie AG*List Not Exhaustive
- 12.1.11.1. Company Overview
- 12.1.11.2. Products
- 12.1.11.3. Company Financials
- 12.1.11.4. SWOT Analysis
- 12.1.1 Henkel AG & Co KGaA
- 12.2. Market Entropy
- 12.2.1 Company's Key Areas Served
- 12.2.2 Recent Developments
- 12.3. Company Market Share Analysis 2025
- 12.3.1 Top 5 Companies Market Share Analysis
- 12.3.2 Top 3 Companies Market Share Analysis
- 12.4. List of Potential Customers
- 13. Research Methodology
List of Figures
- Figure 1: Global US Pressure Sensitive Adhesives Industry Revenue Breakdown (billion, %) by Region 2025 & 2033
- Figure 2: North America US Pressure Sensitive Adhesives Industry Revenue (billion), by Resin 2025 & 2033
- Figure 3: North America US Pressure Sensitive Adhesives Industry Revenue Share (%), by Resin 2025 & 2033
- Figure 4: North America US Pressure Sensitive Adhesives Industry Revenue (billion), by Technology 2025 & 2033
- Figure 5: North America US Pressure Sensitive Adhesives Industry Revenue Share (%), by Technology 2025 & 2033
- Figure 6: North America US Pressure Sensitive Adhesives Industry Revenue (billion), by Application 2025 & 2033
- Figure 7: North America US Pressure Sensitive Adhesives Industry Revenue Share (%), by Application 2025 & 2033
- Figure 8: North America US Pressure Sensitive Adhesives Industry Revenue (billion), by End-user Industry 2025 & 2033
- Figure 9: North America US Pressure Sensitive Adhesives Industry Revenue Share (%), by End-user Industry 2025 & 2033
- Figure 10: North America US Pressure Sensitive Adhesives Industry Revenue (billion), by Country 2025 & 2033
- Figure 11: North America US Pressure Sensitive Adhesives Industry Revenue Share (%), by Country 2025 & 2033
- Figure 12: South America US Pressure Sensitive Adhesives Industry Revenue (billion), by Resin 2025 & 2033
- Figure 13: South America US Pressure Sensitive Adhesives Industry Revenue Share (%), by Resin 2025 & 2033
- Figure 14: South America US Pressure Sensitive Adhesives Industry Revenue (billion), by Technology 2025 & 2033
- Figure 15: South America US Pressure Sensitive Adhesives Industry Revenue Share (%), by Technology 2025 & 2033
- Figure 16: South America US Pressure Sensitive Adhesives Industry Revenue (billion), by Application 2025 & 2033
- Figure 17: South America US Pressure Sensitive Adhesives Industry Revenue Share (%), by Application 2025 & 2033
- Figure 18: South America US Pressure Sensitive Adhesives Industry Revenue (billion), by End-user Industry 2025 & 2033
- Figure 19: South America US Pressure Sensitive Adhesives Industry Revenue Share (%), by End-user Industry 2025 & 2033
- Figure 20: South America US Pressure Sensitive Adhesives Industry Revenue (billion), by Country 2025 & 2033
- Figure 21: South America US Pressure Sensitive Adhesives Industry Revenue Share (%), by Country 2025 & 2033
- Figure 22: Europe US Pressure Sensitive Adhesives Industry Revenue (billion), by Resin 2025 & 2033
- Figure 23: Europe US Pressure Sensitive Adhesives Industry Revenue Share (%), by Resin 2025 & 2033
- Figure 24: Europe US Pressure Sensitive Adhesives Industry Revenue (billion), by Technology 2025 & 2033
- Figure 25: Europe US Pressure Sensitive Adhesives Industry Revenue Share (%), by Technology 2025 & 2033
- Figure 26: Europe US Pressure Sensitive Adhesives Industry Revenue (billion), by Application 2025 & 2033
- Figure 27: Europe US Pressure Sensitive Adhesives Industry Revenue Share (%), by Application 2025 & 2033
- Figure 28: Europe US Pressure Sensitive Adhesives Industry Revenue (billion), by End-user Industry 2025 & 2033
- Figure 29: Europe US Pressure Sensitive Adhesives Industry Revenue Share (%), by End-user Industry 2025 & 2033
- Figure 30: Europe US Pressure Sensitive Adhesives Industry Revenue (billion), by Country 2025 & 2033
- Figure 31: Europe US Pressure Sensitive Adhesives Industry Revenue Share (%), by Country 2025 & 2033
- Figure 32: Middle East & Africa US Pressure Sensitive Adhesives Industry Revenue (billion), by Resin 2025 & 2033
- Figure 33: Middle East & Africa US Pressure Sensitive Adhesives Industry Revenue Share (%), by Resin 2025 & 2033
- Figure 34: Middle East & Africa US Pressure Sensitive Adhesives Industry Revenue (billion), by Technology 2025 & 2033
- Figure 35: Middle East & Africa US Pressure Sensitive Adhesives Industry Revenue Share (%), by Technology 2025 & 2033
- Figure 36: Middle East & Africa US Pressure Sensitive Adhesives Industry Revenue (billion), by Application 2025 & 2033
- Figure 37: Middle East & Africa US Pressure Sensitive Adhesives Industry Revenue Share (%), by Application 2025 & 2033
- Figure 38: Middle East & Africa US Pressure Sensitive Adhesives Industry Revenue (billion), by End-user Industry 2025 & 2033
- Figure 39: Middle East & Africa US Pressure Sensitive Adhesives Industry Revenue Share (%), by End-user Industry 2025 & 2033
- Figure 40: Middle East & Africa US Pressure Sensitive Adhesives Industry Revenue (billion), by Country 2025 & 2033
- Figure 41: Middle East & Africa US Pressure Sensitive Adhesives Industry Revenue Share (%), by Country 2025 & 2033
- Figure 42: Asia Pacific US Pressure Sensitive Adhesives Industry Revenue (billion), by Resin 2025 & 2033
- Figure 43: Asia Pacific US Pressure Sensitive Adhesives Industry Revenue Share (%), by Resin 2025 & 2033
- Figure 44: Asia Pacific US Pressure Sensitive Adhesives Industry Revenue (billion), by Technology 2025 & 2033
- Figure 45: Asia Pacific US Pressure Sensitive Adhesives Industry Revenue Share (%), by Technology 2025 & 2033
- Figure 46: Asia Pacific US Pressure Sensitive Adhesives Industry Revenue (billion), by Application 2025 & 2033
- Figure 47: Asia Pacific US Pressure Sensitive Adhesives Industry Revenue Share (%), by Application 2025 & 2033
- Figure 48: Asia Pacific US Pressure Sensitive Adhesives Industry Revenue (billion), by End-user Industry 2025 & 2033
- Figure 49: Asia Pacific US Pressure Sensitive Adhesives Industry Revenue Share (%), by End-user Industry 2025 & 2033
- Figure 50: Asia Pacific US Pressure Sensitive Adhesives Industry Revenue (billion), by Country 2025 & 2033
- Figure 51: Asia Pacific US Pressure Sensitive Adhesives Industry Revenue Share (%), by Country 2025 & 2033
List of Tables
- Table 1: Global US Pressure Sensitive Adhesives Industry Revenue billion Forecast, by Resin 2020 & 2033
- Table 2: Global US Pressure Sensitive Adhesives Industry Revenue billion Forecast, by Technology 2020 & 2033
- Table 3: Global US Pressure Sensitive Adhesives Industry Revenue billion Forecast, by Application 2020 & 2033
- Table 4: Global US Pressure Sensitive Adhesives Industry Revenue billion Forecast, by End-user Industry 2020 & 2033
- Table 5: Global US Pressure Sensitive Adhesives Industry Revenue billion Forecast, by Region 2020 & 2033
- Table 6: Global US Pressure Sensitive Adhesives Industry Revenue billion Forecast, by Resin 2020 & 2033
- Table 7: Global US Pressure Sensitive Adhesives Industry Revenue billion Forecast, by Technology 2020 & 2033
- Table 8: Global US Pressure Sensitive Adhesives Industry Revenue billion Forecast, by Application 2020 & 2033
- Table 9: Global US Pressure Sensitive Adhesives Industry Revenue billion Forecast, by End-user Industry 2020 & 2033
- Table 10: Global US Pressure Sensitive Adhesives Industry Revenue billion Forecast, by Country 2020 & 2033
- Table 11: United States US Pressure Sensitive Adhesives Industry Revenue (billion) Forecast, by Application 2020 & 2033
- Table 12: Canada US Pressure Sensitive Adhesives Industry Revenue (billion) Forecast, by Application 2020 & 2033
- Table 13: Mexico US Pressure Sensitive Adhesives Industry Revenue (billion) Forecast, by Application 2020 & 2033
- Table 14: Global US Pressure Sensitive Adhesives Industry Revenue billion Forecast, by Resin 2020 & 2033
- Table 15: Global US Pressure Sensitive Adhesives Industry Revenue billion Forecast, by Technology 2020 & 2033
- Table 16: Global US Pressure Sensitive Adhesives Industry Revenue billion Forecast, by Application 2020 & 2033
- Table 17: Global US Pressure Sensitive Adhesives Industry Revenue billion Forecast, by End-user Industry 2020 & 2033
- Table 18: Global US Pressure Sensitive Adhesives Industry Revenue billion Forecast, by Country 2020 & 2033
- Table 19: Brazil US Pressure Sensitive Adhesives Industry Revenue (billion) Forecast, by Application 2020 & 2033
- Table 20: Argentina US Pressure Sensitive Adhesives Industry Revenue (billion) Forecast, by Application 2020 & 2033
- Table 21: Rest of South America US Pressure Sensitive Adhesives Industry Revenue (billion) Forecast, by Application 2020 & 2033
- Table 22: Global US Pressure Sensitive Adhesives Industry Revenue billion Forecast, by Resin 2020 & 2033
- Table 23: Global US Pressure Sensitive Adhesives Industry Revenue billion Forecast, by Technology 2020 & 2033
- Table 24: Global US Pressure Sensitive Adhesives Industry Revenue billion Forecast, by Application 2020 & 2033
- Table 25: Global US Pressure Sensitive Adhesives Industry Revenue billion Forecast, by End-user Industry 2020 & 2033
- Table 26: Global US Pressure Sensitive Adhesives Industry Revenue billion Forecast, by Country 2020 & 2033
- Table 27: United Kingdom US Pressure Sensitive Adhesives Industry Revenue (billion) Forecast, by Application 2020 & 2033
- Table 28: Germany US Pressure Sensitive Adhesives Industry Revenue (billion) Forecast, by Application 2020 & 2033
- Table 29: France US Pressure Sensitive Adhesives Industry Revenue (billion) Forecast, by Application 2020 & 2033
- Table 30: Italy US Pressure Sensitive Adhesives Industry Revenue (billion) Forecast, by Application 2020 & 2033
- Table 31: Spain US Pressure Sensitive Adhesives Industry Revenue (billion) Forecast, by Application 2020 & 2033
- Table 32: Russia US Pressure Sensitive Adhesives Industry Revenue (billion) Forecast, by Application 2020 & 2033
- Table 33: Benelux US Pressure Sensitive Adhesives Industry Revenue (billion) Forecast, by Application 2020 & 2033
- Table 34: Nordics US Pressure Sensitive Adhesives Industry Revenue (billion) Forecast, by Application 2020 & 2033
- Table 35: Rest of Europe US Pressure Sensitive Adhesives Industry Revenue (billion) Forecast, by Application 2020 & 2033
- Table 36: Global US Pressure Sensitive Adhesives Industry Revenue billion Forecast, by Resin 2020 & 2033
- Table 37: Global US Pressure Sensitive Adhesives Industry Revenue billion Forecast, by Technology 2020 & 2033
- Table 38: Global US Pressure Sensitive Adhesives Industry Revenue billion Forecast, by Application 2020 & 2033
- Table 39: Global US Pressure Sensitive Adhesives Industry Revenue billion Forecast, by End-user Industry 2020 & 2033
- Table 40: Global US Pressure Sensitive Adhesives Industry Revenue billion Forecast, by Country 2020 & 2033
- Table 41: Turkey US Pressure Sensitive Adhesives Industry Revenue (billion) Forecast, by Application 2020 & 2033
- Table 42: Israel US Pressure Sensitive Adhesives Industry Revenue (billion) Forecast, by Application 2020 & 2033
- Table 43: GCC US Pressure Sensitive Adhesives Industry Revenue (billion) Forecast, by Application 2020 & 2033
- Table 44: North Africa US Pressure Sensitive Adhesives Industry Revenue (billion) Forecast, by Application 2020 & 2033
- Table 45: South Africa US Pressure Sensitive Adhesives Industry Revenue (billion) Forecast, by Application 2020 & 2033
- Table 46: Rest of Middle East & Africa US Pressure Sensitive Adhesives Industry Revenue (billion) Forecast, by Application 2020 & 2033
- Table 47: Global US Pressure Sensitive Adhesives Industry Revenue billion Forecast, by Resin 2020 & 2033
- Table 48: Global US Pressure Sensitive Adhesives Industry Revenue billion Forecast, by Technology 2020 & 2033
- Table 49: Global US Pressure Sensitive Adhesives Industry Revenue billion Forecast, by Application 2020 & 2033
- Table 50: Global US Pressure Sensitive Adhesives Industry Revenue billion Forecast, by End-user Industry 2020 & 2033
- Table 51: Global US Pressure Sensitive Adhesives Industry Revenue billion Forecast, by Country 2020 & 2033
- Table 52: China US Pressure Sensitive Adhesives Industry Revenue (billion) Forecast, by Application 2020 & 2033
- Table 53: India US Pressure Sensitive Adhesives Industry Revenue (billion) Forecast, by Application 2020 & 2033
- Table 54: Japan US Pressure Sensitive Adhesives Industry Revenue (billion) Forecast, by Application 2020 & 2033
- Table 55: South Korea US Pressure Sensitive Adhesives Industry Revenue (billion) Forecast, by Application 2020 & 2033
- Table 56: ASEAN US Pressure Sensitive Adhesives Industry Revenue (billion) Forecast, by Application 2020 & 2033
- Table 57: Oceania US Pressure Sensitive Adhesives Industry Revenue (billion) Forecast, by Application 2020 & 2033
- Table 58: Rest of Asia Pacific US Pressure Sensitive Adhesives Industry Revenue (billion) Forecast, by Application 2020 & 2033
Frequently Asked Questions
1. What is the projected Compound Annual Growth Rate (CAGR) of the US Pressure Sensitive Adhesives Industry?
The projected CAGR is approximately 6%.
2. Which companies are prominent players in the US Pressure Sensitive Adhesives Industry?
Key companies in the market include Henkel AG & Co KGaA, 3M, Mapei S p A, Ashland, Arkema Group, Dow, H B Fuller Company, Franklin International, Sika AG, Jowat SE, Wacker Chemie AG*List Not Exhaustive.
3. What are the main segments of the US Pressure Sensitive Adhesives Industry?
The market segments include Resin, Technology, Application, End-user Industry.
4. Can you provide details about the market size?
The market size is estimated to be USD 9.9 billion as of 2022.
5. What are some drivers contributing to market growth?
; Shifting Focus to Low-Cost Flexible Packaging; Other Drivers.
6. What are the notable trends driving market growth?
Packaging Industry to Dominate the Market.
7. Are there any restraints impacting market growth?
; Stringent Environmental Regulations Regarding VOC Emissions; Other Restraints.
8. Can you provide examples of recent developments in the market?
N/A
9. What pricing options are available for accessing the report?
Pricing options include single-user, multi-user, and enterprise licenses priced at USD 3800, USD 4500, and USD 5800 respectively.
10. Is the market size provided in terms of value or volume?
The market size is provided in terms of value, measured in billion.
11. Are there any specific market keywords associated with the report?
Yes, the market keyword associated with the report is "US Pressure Sensitive Adhesives Industry," which aids in identifying and referencing the specific market segment covered.
12. How do I determine which pricing option suits my needs best?
The pricing options vary based on user requirements and access needs. Individual users may opt for single-user licenses, while businesses requiring broader access may choose multi-user or enterprise licenses for cost-effective access to the report.
13. Are there any additional resources or data provided in the US Pressure Sensitive Adhesives Industry report?
While the report offers comprehensive insights, it's advisable to review the specific contents or supplementary materials provided to ascertain if additional resources or data are available.
14. How can I stay updated on further developments or reports in the US Pressure Sensitive Adhesives Industry?
To stay informed about further developments, trends, and reports in the US Pressure Sensitive Adhesives Industry, consider subscribing to industry newsletters, following relevant companies and organizations, or regularly checking reputable industry news sources and publications.
Methodology
Step 1 - Identification of Relevant Samples Size from Population Database


Step 2 - Approaches for Defining Global Market Size (Value, Volume* & Price*)

Note*: In applicable scenarios
Step 3 - Data Sources
Primary Research
- Web Analytics
- Survey Reports
- Research Institute
- Latest Research Reports
- Opinion Leaders
Secondary Research
- Annual Reports
- White Paper
- Latest Press Release
- Industry Association
- Paid Database
- Investor Presentations

Step 4 - Data Triangulation
Involves using different sources of information in order to increase the validity of a study
These sources are likely to be stakeholders in a program - participants, other researchers, program staff, other community members, and so on.
Then we put all data in single framework & apply various statistical tools to find out the dynamic on the market.
During the analysis stage, feedback from the stakeholder groups would be compared to determine areas of agreement as well as areas of divergence