

Key Insights
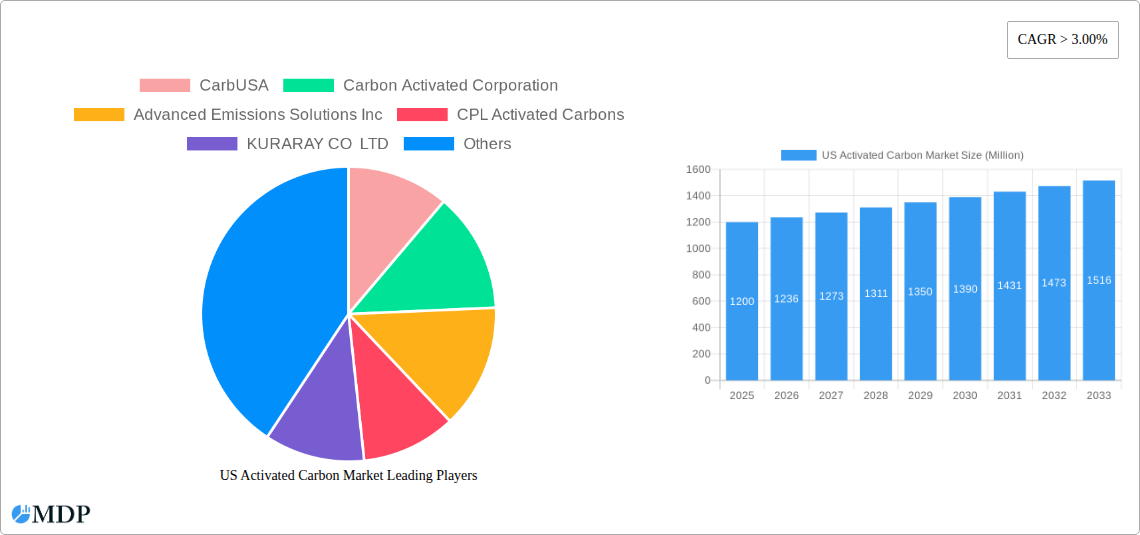
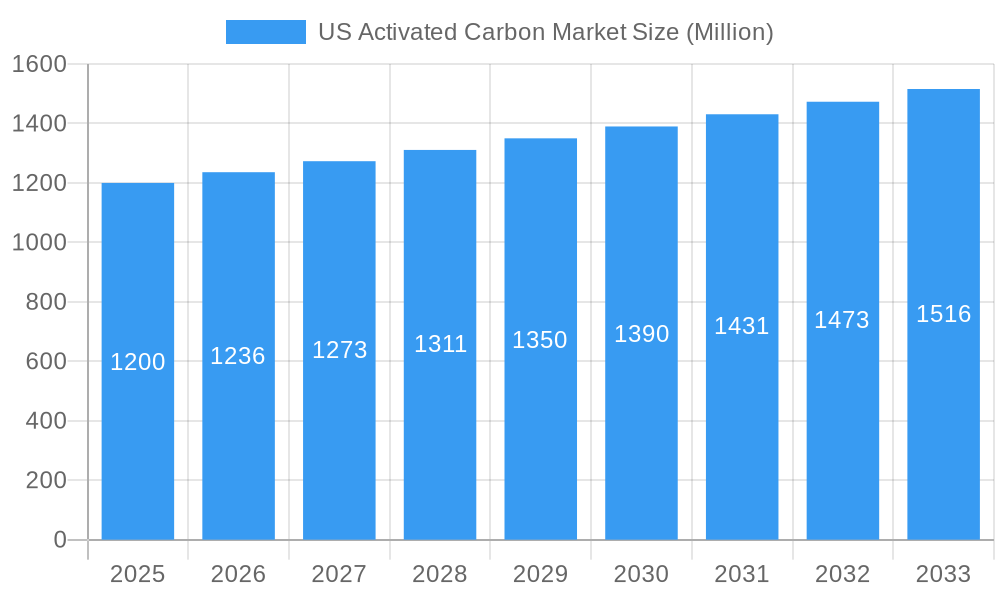
The US activated carbon market, valued at approximately $1.2 billion in 2025, is projected to experience robust growth, exceeding a 3% compound annual growth rate (CAGR) through 2033. This expansion is driven by several key factors. Increasing environmental regulations concerning water and air quality are pushing industries across various sectors – including water treatment, food and beverage, and automotive – to adopt activated carbon solutions for purification and filtration. Furthermore, the growing demand for advanced materials in diverse applications, such as medicine and metal extraction, contributes significantly to market growth. The granular activated carbon segment currently holds the largest market share due to its versatility and wide-ranging applications, while the water purification application segment dominates in terms of volume, fueled by increasing concerns about water scarcity and contamination. Regional variations exist, with the Northeast and West exhibiting higher adoption rates due to established industries and stringent environmental regulations. However, growth potential exists across all regions as awareness of activated carbon's benefits increases.
US Activated Carbon Market Market Size (In Billion)
Despite the positive outlook, the market faces certain challenges. Fluctuations in raw material prices, particularly coal and coconut shells, which are primary precursors for activated carbon production, can impact profitability. Furthermore, the emergence of alternative technologies for purification and filtration represents a potential restraint on market expansion. However, the ongoing research and development efforts focused on improving activated carbon’s efficiency, cost-effectiveness, and sustainability are expected to mitigate these challenges. The competitive landscape is characterized by a mix of established global players and regional manufacturers, leading to price competitiveness and innovation within the market. The strategic collaborations and acquisitions occurring within the industry also suggest a proactive approach towards market expansion and consolidation.
US Activated Carbon Market Company Market Share
US Activated Carbon Market Report: 2019-2033 Forecast
Dive deep into the lucrative US Activated Carbon market with this comprehensive report, offering a detailed analysis of market dynamics, trends, leading players, and future projections from 2019 to 2033. This in-depth study provides actionable insights for stakeholders across the value chain, including manufacturers, distributors, investors, and regulatory bodies. The report covers a market valued at $XX Million in 2025 and projects significant growth over the forecast period (2025-2033).
US Activated Carbon Market Market Dynamics & Concentration
The US activated carbon market is characterized by a moderately concentrated landscape with several key players vying for market share. The market's dynamics are influenced by several factors:
- Innovation Drivers: Ongoing R&D efforts are focused on developing advanced activated carbon materials with enhanced adsorption capacity, improved selectivity, and longer lifespans. This drive for innovation is further fueled by increasing demand across diverse applications.
- Regulatory Frameworks: Stringent environmental regulations related to water and air quality are driving the adoption of activated carbon solutions in various industries. Compliance mandates significantly impact market growth.
- Product Substitutes: While activated carbon possesses unique adsorption properties, competitive pressures arise from alternative technologies such as membrane filtration and ion exchange resins. The report analyzes the competitive landscape of these substitutes and their market penetration rates.
- End-User Trends: The growing awareness of water scarcity and stricter regulations concerning industrial emissions are fueling demand in water and gas purification, driving significant market expansion.
- M&A Activities: The report analyzes historical M&A activity (XX deals between 2019 and 2024), including the involvement of key players like Cabot Corporation and Calgon Carbon Corporation, which has resulted in market consolidation and reshaped the competitive landscape. Market share analysis for top players is included, revealing a concentration ratio of approximately XX%.
US Activated Carbon Market Industry Trends & Analysis
The US activated carbon market is experiencing robust growth, driven by a number of factors. The overall market is projected to register a CAGR of XX% during the forecast period (2025-2033), reaching a value of $XX Million by 2033. This growth is fueled by:
- Increased demand from the water treatment sector: Stringent regulations on wastewater discharge and the growing need for clean drinking water are key drivers. Market penetration within this segment stands at approximately XX% in 2025.
- Technological advancements: The development of novel activated carbon materials with enhanced performance characteristics is expanding application possibilities.
- Rising concerns over air pollution: Growing demand for clean air solutions in various industrial sectors and increasing awareness of indoor air quality are boosting market demand in gas purification.
- Competitive dynamics: Increased competition among manufacturers is leading to price reductions and product innovations, making activated carbon more accessible and attractive to a wider range of consumers.
Leading Markets & Segments in US Activated Carbon Market
The report identifies key market segments and leading regions within the US activated carbon market:
- Dominant Product Type: Granular Activated Carbon (GAC) currently holds the largest market share, driven by its versatility and wide applicability across various industries.
- Leading Application: Water purification dominates the application segment, owing to the increasing demand for clean drinking water and wastewater treatment.
- Key End-User Industry: The water treatment sector is the primary end-user, contributing a significant portion of the overall market revenue. Growth in this sector is fueled by robust infrastructure development initiatives and increasing government spending on water management projects.
Key Drivers:
- Favorable government policies and regulations: Incentives and subsidies for water treatment infrastructure development are boosting market growth.
- Expanding industrial processing sector: The growth of various industries, including pharmaceuticals and chemicals, is contributing to increased demand for activated carbon in purification processes.
US Activated Carbon Market Product Developments
Recent product developments focus on enhanced adsorption capabilities, improved selectivity, and tailored porosity for specific applications. This includes the development of advanced activated carbons synthesized from sustainable and renewable resources. These innovations are enhancing the efficiency and effectiveness of activated carbon in existing applications while opening doors to new market segments. The focus is shifting towards high-performance, cost-effective solutions that meet stringent regulatory requirements.
Key Drivers of US Activated Carbon Market Growth
Several factors are driving market growth, including:
- Stringent environmental regulations: Stricter emission standards are mandating the adoption of activated carbon solutions in various industries.
- Technological advancements: Improved manufacturing processes and innovations in activated carbon materials are enhancing performance and reducing costs.
- Growth in end-user industries: Expansion in water treatment, food & beverage, and healthcare sectors are driving increased demand.
Challenges in the US Activated Carbon Market Market
The market faces several challenges:
- Fluctuations in raw material prices: The price volatility of raw materials used in activated carbon production can impact profitability.
- Intense competition: A large number of players, both domestic and international, create competitive pressure, potentially leading to price wars.
- Regulatory uncertainties: Changes in environmental regulations can affect market dynamics and investment decisions.
Emerging Opportunities in US Activated Carbon Market
Emerging opportunities include:
- Expanding applications in new sectors: Growth in sectors like renewable energy and advanced materials applications offers considerable potential.
- Development of sustainable and eco-friendly activated carbon: Increased focus on environmentally friendly production processes aligns with growing sustainability concerns.
- Strategic partnerships and collaborations: Joint ventures between activated carbon manufacturers and end-users can create mutually beneficial growth opportunities.
Leading Players in the US Activated Carbon Market Sector
- CarbUSA
- Carbon Activated Corporation
- Advanced Emissions Solutions Inc
- CPL Activated Carbons
- KURARAY CO LTD
- JACOBI CARBONS GROUP
- Evoqua Water Technologies LLC
- Cabot Corporation
- Prominent Systems Inc
- Calgon Carbon Corporation
- Ingevity
- KUREHA CORPORATION
- Veolia
- Donau Chemie AG
- Albemarle Corporation
- PURAGEN ACTIVATED CARBONS
Key Milestones in US Activated Carbon Market Industry
- 2020: Introduction of a new, high-performance activated carbon by Cabot Corporation.
- 2022: Merger between two leading activated carbon manufacturers resulting in increased market concentration.
- 2023: Launch of a sustainable activated carbon production facility by a major player. (Further milestones will be detailed in the full report)
Strategic Outlook for US Activated Carbon Market Market
The US activated carbon market is poised for continued growth, driven by technological advancements, increasing environmental awareness, and expanding applications across diverse sectors. Strategic opportunities exist in developing innovative products, expanding into new markets, and forging strategic partnerships to capitalize on the market's growth trajectory. The focus on sustainability and the development of eco-friendly solutions will play a crucial role in shaping the future landscape of the industry.
US Activated Carbon Market Segmentation
-
1. Product Type
- 1.1. Powdered Activated Carbon
- 1.2. Granular Activated Carbon
- 1.3. Extruded or Pelletized Activated Carbon
-
2. Application
- 2.1. Gas Purification
- 2.2. Water Purification
- 2.3. Metal Extraction
- 2.4. Medicine
- 2.5. Other Applications
-
3. End-user Industry
- 3.1. Water Treatment
- 3.2. Food & Beverage
- 3.3. Healthcare
- 3.4. Automotive
- 3.5. Industrial Processing
- 3.6. Other End-user Industries
US Activated Carbon Market Segmentation By Geography
-
1. North America
- 1.1. United States
- 1.2. Canada
- 1.3. Mexico
-
2. South America
- 2.1. Brazil
- 2.2. Argentina
- 2.3. Rest of South America
-
3. Europe
- 3.1. United Kingdom
- 3.2. Germany
- 3.3. France
- 3.4. Italy
- 3.5. Spain
- 3.6. Russia
- 3.7. Benelux
- 3.8. Nordics
- 3.9. Rest of Europe
-
4. Middle East & Africa
- 4.1. Turkey
- 4.2. Israel
- 4.3. GCC
- 4.4. North Africa
- 4.5. South Africa
- 4.6. Rest of Middle East & Africa
-
5. Asia Pacific
- 5.1. China
- 5.2. India
- 5.3. Japan
- 5.4. South Korea
- 5.5. ASEAN
- 5.6. Oceania
- 5.7. Rest of Asia Pacific
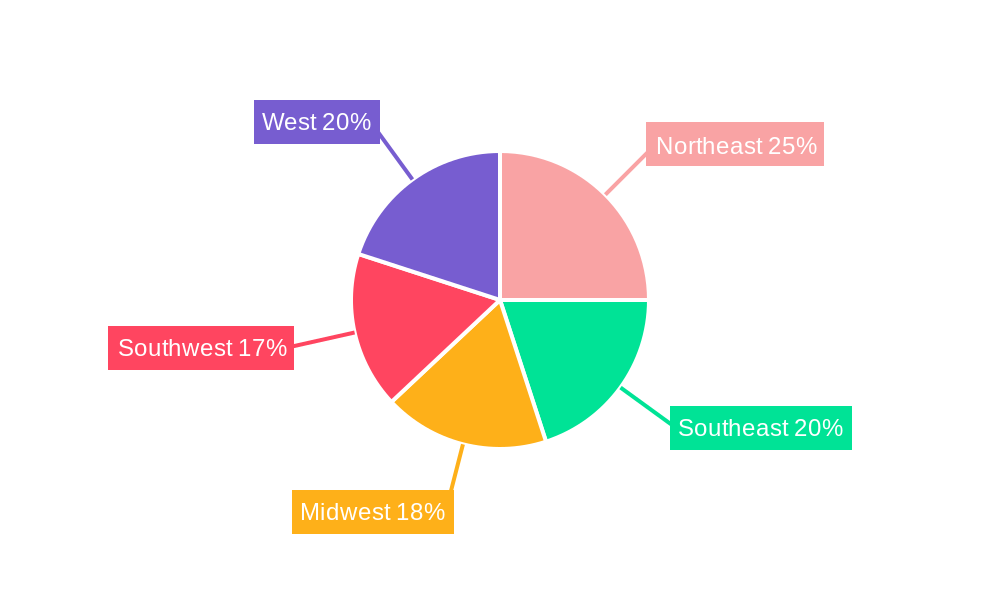
US Activated Carbon Market Regional Market Share
Geographic Coverage of US Activated Carbon Market
US Activated Carbon Market REPORT HIGHLIGHTS
| Aspects | Details |
|---|---|
| Study Period | 2020-2034 |
| Base Year | 2025 |
| Estimated Year | 2026 |
| Forecast Period | 2026-2034 |
| Historical Period | 2020-2025 |
| Growth Rate | CAGR of 8.8% from 2020-2034 |
| Segmentation |
|
Table of Contents
- 1. Introduction
- 1.1. Research Scope
- 1.2. Market Segmentation
- 1.3. Research Objective
- 1.4. Definitions and Assumptions
- 2. Executive Summary
- 2.1. Market Snapshot
- 3. Market Dynamics
- 3.1. Market Drivers
- 3.2. Market Restrains
- 3.3. Market Trends
- 3.4. Market Opportunities
- 4. Market Factor Analysis
- 4.1. Porters Five Forces
- 4.1.1. Bargaining Power of Suppliers
- 4.1.2. Bargaining Power of Buyers
- 4.1.3. Threat of New Entrants
- 4.1.4. Threat of Substitutes
- 4.1.5. Competitive Rivalry
- 4.2. PESTEL analysis
- 4.3. BCG Analysis
- 4.3.1. Stars (High Growth, High Market Share)
- 4.3.2. Cash Cows (Low Growth, High Market Share)
- 4.3.3. Question Mark (High Growth, Low Market Share)
- 4.3.4. Dogs (Low Growth, Low Market Share)
- 4.4. Ansoff Matrix Analysis
- 4.5. Supply Chain Analysis
- 4.6. Regulatory Landscape
- 4.7. Current Market Potential and Opportunity Assessment (TAM–SAM–SOM Framework)
- 4.8. MDP Analyst Note
- 4.1. Porters Five Forces
- 5. Market Analysis, Insights and Forecast 2021-2033
- 5.1. Market Analysis, Insights and Forecast - by Product Type
- 5.1.1. Powdered Activated Carbon
- 5.1.2. Granular Activated Carbon
- 5.1.3. Extruded or Pelletized Activated Carbon
- 5.2. Market Analysis, Insights and Forecast - by Application
- 5.2.1. Gas Purification
- 5.2.2. Water Purification
- 5.2.3. Metal Extraction
- 5.2.4. Medicine
- 5.2.5. Other Applications
- 5.3. Market Analysis, Insights and Forecast - by End-user Industry
- 5.3.1. Water Treatment
- 5.3.2. Food & Beverage
- 5.3.3. Healthcare
- 5.3.4. Automotive
- 5.3.5. Industrial Processing
- 5.3.6. Other End-user Industries
- 5.4. Market Analysis, Insights and Forecast - by Region
- 5.4.1. North America
- 5.4.2. South America
- 5.4.3. Europe
- 5.4.4. Middle East & Africa
- 5.4.5. Asia Pacific
- 5.1. Market Analysis, Insights and Forecast - by Product Type
- 6. Global US Activated Carbon Market Analysis, Insights and Forecast, 2021-2033
- 6.1. Market Analysis, Insights and Forecast - by Product Type
- 6.1.1. Powdered Activated Carbon
- 6.1.2. Granular Activated Carbon
- 6.1.3. Extruded or Pelletized Activated Carbon
- 6.2. Market Analysis, Insights and Forecast - by Application
- 6.2.1. Gas Purification
- 6.2.2. Water Purification
- 6.2.3. Metal Extraction
- 6.2.4. Medicine
- 6.2.5. Other Applications
- 6.3. Market Analysis, Insights and Forecast - by End-user Industry
- 6.3.1. Water Treatment
- 6.3.2. Food & Beverage
- 6.3.3. Healthcare
- 6.3.4. Automotive
- 6.3.5. Industrial Processing
- 6.3.6. Other End-user Industries
- 6.1. Market Analysis, Insights and Forecast - by Product Type
- 7. North America US Activated Carbon Market Analysis, Insights and Forecast, 2020-2032
- 7.1. Market Analysis, Insights and Forecast - by Product Type
- 7.1.1. Powdered Activated Carbon
- 7.1.2. Granular Activated Carbon
- 7.1.3. Extruded or Pelletized Activated Carbon
- 7.2. Market Analysis, Insights and Forecast - by Application
- 7.2.1. Gas Purification
- 7.2.2. Water Purification
- 7.2.3. Metal Extraction
- 7.2.4. Medicine
- 7.2.5. Other Applications
- 7.3. Market Analysis, Insights and Forecast - by End-user Industry
- 7.3.1. Water Treatment
- 7.3.2. Food & Beverage
- 7.3.3. Healthcare
- 7.3.4. Automotive
- 7.3.5. Industrial Processing
- 7.3.6. Other End-user Industries
- 7.1. Market Analysis, Insights and Forecast - by Product Type
- 8. South America US Activated Carbon Market Analysis, Insights and Forecast, 2020-2032
- 8.1. Market Analysis, Insights and Forecast - by Product Type
- 8.1.1. Powdered Activated Carbon
- 8.1.2. Granular Activated Carbon
- 8.1.3. Extruded or Pelletized Activated Carbon
- 8.2. Market Analysis, Insights and Forecast - by Application
- 8.2.1. Gas Purification
- 8.2.2. Water Purification
- 8.2.3. Metal Extraction
- 8.2.4. Medicine
- 8.2.5. Other Applications
- 8.3. Market Analysis, Insights and Forecast - by End-user Industry
- 8.3.1. Water Treatment
- 8.3.2. Food & Beverage
- 8.3.3. Healthcare
- 8.3.4. Automotive
- 8.3.5. Industrial Processing
- 8.3.6. Other End-user Industries
- 8.1. Market Analysis, Insights and Forecast - by Product Type
- 9. Europe US Activated Carbon Market Analysis, Insights and Forecast, 2020-2032
- 9.1. Market Analysis, Insights and Forecast - by Product Type
- 9.1.1. Powdered Activated Carbon
- 9.1.2. Granular Activated Carbon
- 9.1.3. Extruded or Pelletized Activated Carbon
- 9.2. Market Analysis, Insights and Forecast - by Application
- 9.2.1. Gas Purification
- 9.2.2. Water Purification
- 9.2.3. Metal Extraction
- 9.2.4. Medicine
- 9.2.5. Other Applications
- 9.3. Market Analysis, Insights and Forecast - by End-user Industry
- 9.3.1. Water Treatment
- 9.3.2. Food & Beverage
- 9.3.3. Healthcare
- 9.3.4. Automotive
- 9.3.5. Industrial Processing
- 9.3.6. Other End-user Industries
- 9.1. Market Analysis, Insights and Forecast - by Product Type
- 10. Middle East & Africa US Activated Carbon Market Analysis, Insights and Forecast, 2020-2032
- 10.1. Market Analysis, Insights and Forecast - by Product Type
- 10.1.1. Powdered Activated Carbon
- 10.1.2. Granular Activated Carbon
- 10.1.3. Extruded or Pelletized Activated Carbon
- 10.2. Market Analysis, Insights and Forecast - by Application
- 10.2.1. Gas Purification
- 10.2.2. Water Purification
- 10.2.3. Metal Extraction
- 10.2.4. Medicine
- 10.2.5. Other Applications
- 10.3. Market Analysis, Insights and Forecast - by End-user Industry
- 10.3.1. Water Treatment
- 10.3.2. Food & Beverage
- 10.3.3. Healthcare
- 10.3.4. Automotive
- 10.3.5. Industrial Processing
- 10.3.6. Other End-user Industries
- 10.1. Market Analysis, Insights and Forecast - by Product Type
- 11. Asia Pacific US Activated Carbon Market Analysis, Insights and Forecast, 2020-2032
- 11.1. Market Analysis, Insights and Forecast - by Product Type
- 11.1.1. Powdered Activated Carbon
- 11.1.2. Granular Activated Carbon
- 11.1.3. Extruded or Pelletized Activated Carbon
- 11.2. Market Analysis, Insights and Forecast - by Application
- 11.2.1. Gas Purification
- 11.2.2. Water Purification
- 11.2.3. Metal Extraction
- 11.2.4. Medicine
- 11.2.5. Other Applications
- 11.3. Market Analysis, Insights and Forecast - by End-user Industry
- 11.3.1. Water Treatment
- 11.3.2. Food & Beverage
- 11.3.3. Healthcare
- 11.3.4. Automotive
- 11.3.5. Industrial Processing
- 11.3.6. Other End-user Industries
- 11.1. Market Analysis, Insights and Forecast - by Product Type
- 12. Competitive Analysis
- 12.1. Company Profiles
- 12.1.1 CarbUSA
- 12.1.1.1. Company Overview
- 12.1.1.2. Products
- 12.1.1.3. Company Financials
- 12.1.1.4. SWOT Analysis
- 12.1.2 Carbon Activated Corporation
- 12.1.2.1. Company Overview
- 12.1.2.2. Products
- 12.1.2.3. Company Financials
- 12.1.2.4. SWOT Analysis
- 12.1.3 Advanced Emissions Solutions Inc
- 12.1.3.1. Company Overview
- 12.1.3.2. Products
- 12.1.3.3. Company Financials
- 12.1.3.4. SWOT Analysis
- 12.1.4 CPL Activated Carbons
- 12.1.4.1. Company Overview
- 12.1.4.2. Products
- 12.1.4.3. Company Financials
- 12.1.4.4. SWOT Analysis
- 12.1.5 KURARAY CO LTD
- 12.1.5.1. Company Overview
- 12.1.5.2. Products
- 12.1.5.3. Company Financials
- 12.1.5.4. SWOT Analysis
- 12.1.6 JACOBI CARBONS GROUP
- 12.1.6.1. Company Overview
- 12.1.6.2. Products
- 12.1.6.3. Company Financials
- 12.1.6.4. SWOT Analysis
- 12.1.7 Evoqua Water Technologies LLC
- 12.1.7.1. Company Overview
- 12.1.7.2. Products
- 12.1.7.3. Company Financials
- 12.1.7.4. SWOT Analysis
- 12.1.8 Cabot Corporation
- 12.1.8.1. Company Overview
- 12.1.8.2. Products
- 12.1.8.3. Company Financials
- 12.1.8.4. SWOT Analysis
- 12.1.9 Prominent Systems Inc
- 12.1.9.1. Company Overview
- 12.1.9.2. Products
- 12.1.9.3. Company Financials
- 12.1.9.4. SWOT Analysis
- 12.1.10 Calgon Carbon Corporation
- 12.1.10.1. Company Overview
- 12.1.10.2. Products
- 12.1.10.3. Company Financials
- 12.1.10.4. SWOT Analysis
- 12.1.11 Ingevity
- 12.1.11.1. Company Overview
- 12.1.11.2. Products
- 12.1.11.3. Company Financials
- 12.1.11.4. SWOT Analysis
- 12.1.12 KUREHA CORPORATION
- 12.1.12.1. Company Overview
- 12.1.12.2. Products
- 12.1.12.3. Company Financials
- 12.1.12.4. SWOT Analysis
- 12.1.13 Veolia*List Not Exhaustive
- 12.1.13.1. Company Overview
- 12.1.13.2. Products
- 12.1.13.3. Company Financials
- 12.1.13.4. SWOT Analysis
- 12.1.14 Donau Chemie AG
- 12.1.14.1. Company Overview
- 12.1.14.2. Products
- 12.1.14.3. Company Financials
- 12.1.14.4. SWOT Analysis
- 12.1.15 Albemarle Corporation
- 12.1.15.1. Company Overview
- 12.1.15.2. Products
- 12.1.15.3. Company Financials
- 12.1.15.4. SWOT Analysis
- 12.1.16 PURAGEN ACTIVATED CARBONS
- 12.1.16.1. Company Overview
- 12.1.16.2. Products
- 12.1.16.3. Company Financials
- 12.1.16.4. SWOT Analysis
- 12.1.1 CarbUSA
- 12.2. Market Entropy
- 12.2.1 Company's Key Areas Served
- 12.2.2 Recent Developments
- 12.3. Company Market Share Analysis 2025
- 12.3.1 Top 5 Companies Market Share Analysis
- 12.3.2 Top 3 Companies Market Share Analysis
- 12.4. List of Potential Customers
- 13. Research Methodology
List of Figures
- Figure 1: Global US Activated Carbon Market Revenue Breakdown (million, %) by Region 2025 & 2033
- Figure 2: North America US Activated Carbon Market Revenue (million), by Product Type 2025 & 2033
- Figure 3: North America US Activated Carbon Market Revenue Share (%), by Product Type 2025 & 2033
- Figure 4: North America US Activated Carbon Market Revenue (million), by Application 2025 & 2033
- Figure 5: North America US Activated Carbon Market Revenue Share (%), by Application 2025 & 2033
- Figure 6: North America US Activated Carbon Market Revenue (million), by End-user Industry 2025 & 2033
- Figure 7: North America US Activated Carbon Market Revenue Share (%), by End-user Industry 2025 & 2033
- Figure 8: North America US Activated Carbon Market Revenue (million), by Country 2025 & 2033
- Figure 9: North America US Activated Carbon Market Revenue Share (%), by Country 2025 & 2033
- Figure 10: South America US Activated Carbon Market Revenue (million), by Product Type 2025 & 2033
- Figure 11: South America US Activated Carbon Market Revenue Share (%), by Product Type 2025 & 2033
- Figure 12: South America US Activated Carbon Market Revenue (million), by Application 2025 & 2033
- Figure 13: South America US Activated Carbon Market Revenue Share (%), by Application 2025 & 2033
- Figure 14: South America US Activated Carbon Market Revenue (million), by End-user Industry 2025 & 2033
- Figure 15: South America US Activated Carbon Market Revenue Share (%), by End-user Industry 2025 & 2033
- Figure 16: South America US Activated Carbon Market Revenue (million), by Country 2025 & 2033
- Figure 17: South America US Activated Carbon Market Revenue Share (%), by Country 2025 & 2033
- Figure 18: Europe US Activated Carbon Market Revenue (million), by Product Type 2025 & 2033
- Figure 19: Europe US Activated Carbon Market Revenue Share (%), by Product Type 2025 & 2033
- Figure 20: Europe US Activated Carbon Market Revenue (million), by Application 2025 & 2033
- Figure 21: Europe US Activated Carbon Market Revenue Share (%), by Application 2025 & 2033
- Figure 22: Europe US Activated Carbon Market Revenue (million), by End-user Industry 2025 & 2033
- Figure 23: Europe US Activated Carbon Market Revenue Share (%), by End-user Industry 2025 & 2033
- Figure 24: Europe US Activated Carbon Market Revenue (million), by Country 2025 & 2033
- Figure 25: Europe US Activated Carbon Market Revenue Share (%), by Country 2025 & 2033
- Figure 26: Middle East & Africa US Activated Carbon Market Revenue (million), by Product Type 2025 & 2033
- Figure 27: Middle East & Africa US Activated Carbon Market Revenue Share (%), by Product Type 2025 & 2033
- Figure 28: Middle East & Africa US Activated Carbon Market Revenue (million), by Application 2025 & 2033
- Figure 29: Middle East & Africa US Activated Carbon Market Revenue Share (%), by Application 2025 & 2033
- Figure 30: Middle East & Africa US Activated Carbon Market Revenue (million), by End-user Industry 2025 & 2033
- Figure 31: Middle East & Africa US Activated Carbon Market Revenue Share (%), by End-user Industry 2025 & 2033
- Figure 32: Middle East & Africa US Activated Carbon Market Revenue (million), by Country 2025 & 2033
- Figure 33: Middle East & Africa US Activated Carbon Market Revenue Share (%), by Country 2025 & 2033
- Figure 34: Asia Pacific US Activated Carbon Market Revenue (million), by Product Type 2025 & 2033
- Figure 35: Asia Pacific US Activated Carbon Market Revenue Share (%), by Product Type 2025 & 2033
- Figure 36: Asia Pacific US Activated Carbon Market Revenue (million), by Application 2025 & 2033
- Figure 37: Asia Pacific US Activated Carbon Market Revenue Share (%), by Application 2025 & 2033
- Figure 38: Asia Pacific US Activated Carbon Market Revenue (million), by End-user Industry 2025 & 2033
- Figure 39: Asia Pacific US Activated Carbon Market Revenue Share (%), by End-user Industry 2025 & 2033
- Figure 40: Asia Pacific US Activated Carbon Market Revenue (million), by Country 2025 & 2033
- Figure 41: Asia Pacific US Activated Carbon Market Revenue Share (%), by Country 2025 & 2033
List of Tables
- Table 1: Global US Activated Carbon Market Revenue million Forecast, by Product Type 2020 & 2033
- Table 2: Global US Activated Carbon Market Revenue million Forecast, by Application 2020 & 2033
- Table 3: Global US Activated Carbon Market Revenue million Forecast, by End-user Industry 2020 & 2033
- Table 4: Global US Activated Carbon Market Revenue million Forecast, by Region 2020 & 2033
- Table 5: Global US Activated Carbon Market Revenue million Forecast, by Product Type 2020 & 2033
- Table 6: Global US Activated Carbon Market Revenue million Forecast, by Application 2020 & 2033
- Table 7: Global US Activated Carbon Market Revenue million Forecast, by End-user Industry 2020 & 2033
- Table 8: Global US Activated Carbon Market Revenue million Forecast, by Country 2020 & 2033
- Table 9: United States US Activated Carbon Market Revenue (million) Forecast, by Application 2020 & 2033
- Table 10: Canada US Activated Carbon Market Revenue (million) Forecast, by Application 2020 & 2033
- Table 11: Mexico US Activated Carbon Market Revenue (million) Forecast, by Application 2020 & 2033
- Table 12: Global US Activated Carbon Market Revenue million Forecast, by Product Type 2020 & 2033
- Table 13: Global US Activated Carbon Market Revenue million Forecast, by Application 2020 & 2033
- Table 14: Global US Activated Carbon Market Revenue million Forecast, by End-user Industry 2020 & 2033
- Table 15: Global US Activated Carbon Market Revenue million Forecast, by Country 2020 & 2033
- Table 16: Brazil US Activated Carbon Market Revenue (million) Forecast, by Application 2020 & 2033
- Table 17: Argentina US Activated Carbon Market Revenue (million) Forecast, by Application 2020 & 2033
- Table 18: Rest of South America US Activated Carbon Market Revenue (million) Forecast, by Application 2020 & 2033
- Table 19: Global US Activated Carbon Market Revenue million Forecast, by Product Type 2020 & 2033
- Table 20: Global US Activated Carbon Market Revenue million Forecast, by Application 2020 & 2033
- Table 21: Global US Activated Carbon Market Revenue million Forecast, by End-user Industry 2020 & 2033
- Table 22: Global US Activated Carbon Market Revenue million Forecast, by Country 2020 & 2033
- Table 23: United Kingdom US Activated Carbon Market Revenue (million) Forecast, by Application 2020 & 2033
- Table 24: Germany US Activated Carbon Market Revenue (million) Forecast, by Application 2020 & 2033
- Table 25: France US Activated Carbon Market Revenue (million) Forecast, by Application 2020 & 2033
- Table 26: Italy US Activated Carbon Market Revenue (million) Forecast, by Application 2020 & 2033
- Table 27: Spain US Activated Carbon Market Revenue (million) Forecast, by Application 2020 & 2033
- Table 28: Russia US Activated Carbon Market Revenue (million) Forecast, by Application 2020 & 2033
- Table 29: Benelux US Activated Carbon Market Revenue (million) Forecast, by Application 2020 & 2033
- Table 30: Nordics US Activated Carbon Market Revenue (million) Forecast, by Application 2020 & 2033
- Table 31: Rest of Europe US Activated Carbon Market Revenue (million) Forecast, by Application 2020 & 2033
- Table 32: Global US Activated Carbon Market Revenue million Forecast, by Product Type 2020 & 2033
- Table 33: Global US Activated Carbon Market Revenue million Forecast, by Application 2020 & 2033
- Table 34: Global US Activated Carbon Market Revenue million Forecast, by End-user Industry 2020 & 2033
- Table 35: Global US Activated Carbon Market Revenue million Forecast, by Country 2020 & 2033
- Table 36: Turkey US Activated Carbon Market Revenue (million) Forecast, by Application 2020 & 2033
- Table 37: Israel US Activated Carbon Market Revenue (million) Forecast, by Application 2020 & 2033
- Table 38: GCC US Activated Carbon Market Revenue (million) Forecast, by Application 2020 & 2033
- Table 39: North Africa US Activated Carbon Market Revenue (million) Forecast, by Application 2020 & 2033
- Table 40: South Africa US Activated Carbon Market Revenue (million) Forecast, by Application 2020 & 2033
- Table 41: Rest of Middle East & Africa US Activated Carbon Market Revenue (million) Forecast, by Application 2020 & 2033
- Table 42: Global US Activated Carbon Market Revenue million Forecast, by Product Type 2020 & 2033
- Table 43: Global US Activated Carbon Market Revenue million Forecast, by Application 2020 & 2033
- Table 44: Global US Activated Carbon Market Revenue million Forecast, by End-user Industry 2020 & 2033
- Table 45: Global US Activated Carbon Market Revenue million Forecast, by Country 2020 & 2033
- Table 46: China US Activated Carbon Market Revenue (million) Forecast, by Application 2020 & 2033
- Table 47: India US Activated Carbon Market Revenue (million) Forecast, by Application 2020 & 2033
- Table 48: Japan US Activated Carbon Market Revenue (million) Forecast, by Application 2020 & 2033
- Table 49: South Korea US Activated Carbon Market Revenue (million) Forecast, by Application 2020 & 2033
- Table 50: ASEAN US Activated Carbon Market Revenue (million) Forecast, by Application 2020 & 2033
- Table 51: Oceania US Activated Carbon Market Revenue (million) Forecast, by Application 2020 & 2033
- Table 52: Rest of Asia Pacific US Activated Carbon Market Revenue (million) Forecast, by Application 2020 & 2033
Frequently Asked Questions
1. What is the projected Compound Annual Growth Rate (CAGR) of the US Activated Carbon Market?
The projected CAGR is approximately 8.8%.
2. Which companies are prominent players in the US Activated Carbon Market?
Key companies in the market include CarbUSA, Carbon Activated Corporation, Advanced Emissions Solutions Inc, CPL Activated Carbons, KURARAY CO LTD, JACOBI CARBONS GROUP, Evoqua Water Technologies LLC, Cabot Corporation, Prominent Systems Inc, Calgon Carbon Corporation, Ingevity, KUREHA CORPORATION, Veolia*List Not Exhaustive, Donau Chemie AG, Albemarle Corporation, PURAGEN ACTIVATED CARBONS.
3. What are the main segments of the US Activated Carbon Market?
The market segments include Product Type, Application, End-user Industry.
4. Can you provide details about the market size?
The market size is estimated to be USD 1214.47 million as of 2022.
5. What are some drivers contributing to market growth?
; Conformance to Stringent Environmental Regulations In Water Treatment Applications; Augmenting Prominence for Air Pollution Control (Especially Mercury Removal).
6. What are the notable trends driving market growth?
Emerging Applications in the Medical and Pharmaceutical Sector.
7. Are there any restraints impacting market growth?
; Narrower Markets Due to Increased Costs of Some Grades of Activated Carbon; Threat of Substitutes Like Silica Gel and Supersand.
8. Can you provide examples of recent developments in the market?
N/A
9. What pricing options are available for accessing the report?
Pricing options include single-user, multi-user, and enterprise licenses priced at USD 3800, USD 4500, and USD 5800 respectively.
10. Is the market size provided in terms of value or volume?
The market size is provided in terms of value, measured in million.
11. Are there any specific market keywords associated with the report?
Yes, the market keyword associated with the report is "US Activated Carbon Market," which aids in identifying and referencing the specific market segment covered.
12. How do I determine which pricing option suits my needs best?
The pricing options vary based on user requirements and access needs. Individual users may opt for single-user licenses, while businesses requiring broader access may choose multi-user or enterprise licenses for cost-effective access to the report.
13. Are there any additional resources or data provided in the US Activated Carbon Market report?
While the report offers comprehensive insights, it's advisable to review the specific contents or supplementary materials provided to ascertain if additional resources or data are available.
14. How can I stay updated on further developments or reports in the US Activated Carbon Market?
To stay informed about further developments, trends, and reports in the US Activated Carbon Market, consider subscribing to industry newsletters, following relevant companies and organizations, or regularly checking reputable industry news sources and publications.
Methodology
Step 1 - Identification of Relevant Samples Size from Population Database


Step 2 - Approaches for Defining Global Market Size (Value, Volume* & Price*)

Note*: In applicable scenarios
Step 3 - Data Sources
Primary Research
- Web Analytics
- Survey Reports
- Research Institute
- Latest Research Reports
- Opinion Leaders
Secondary Research
- Annual Reports
- White Paper
- Latest Press Release
- Industry Association
- Paid Database
- Investor Presentations

Step 4 - Data Triangulation
Involves using different sources of information in order to increase the validity of a study
These sources are likely to be stakeholders in a program - participants, other researchers, program staff, other community members, and so on.
Then we put all data in single framework & apply various statistical tools to find out the dynamic on the market.
During the analysis stage, feedback from the stakeholder groups would be compared to determine areas of agreement as well as areas of divergence