

Key Insights
The global market for Thin Wall Clear Plastic Tubes is poised for robust expansion, estimated at $41.2 billion in 2024, with a projected Compound Annual Growth Rate (CAGR) of 6.5% through 2033. This significant market size underscores the widespread adoption and demand for these versatile components across numerous industries. The primary growth drivers include the increasing demand from the medical industry for sterile, transparent tubing in diagnostic equipment, drug delivery systems, and surgical devices. Similarly, the pharmaceutical sector relies heavily on these tubes for packaging, fluid transfer, and laboratory applications, where clarity and chemical resistance are paramount. The food and beverage industry also contributes to market growth through its use in packaging, dispensing systems, and specialized food processing equipment, benefiting from the material's safety and transparency.
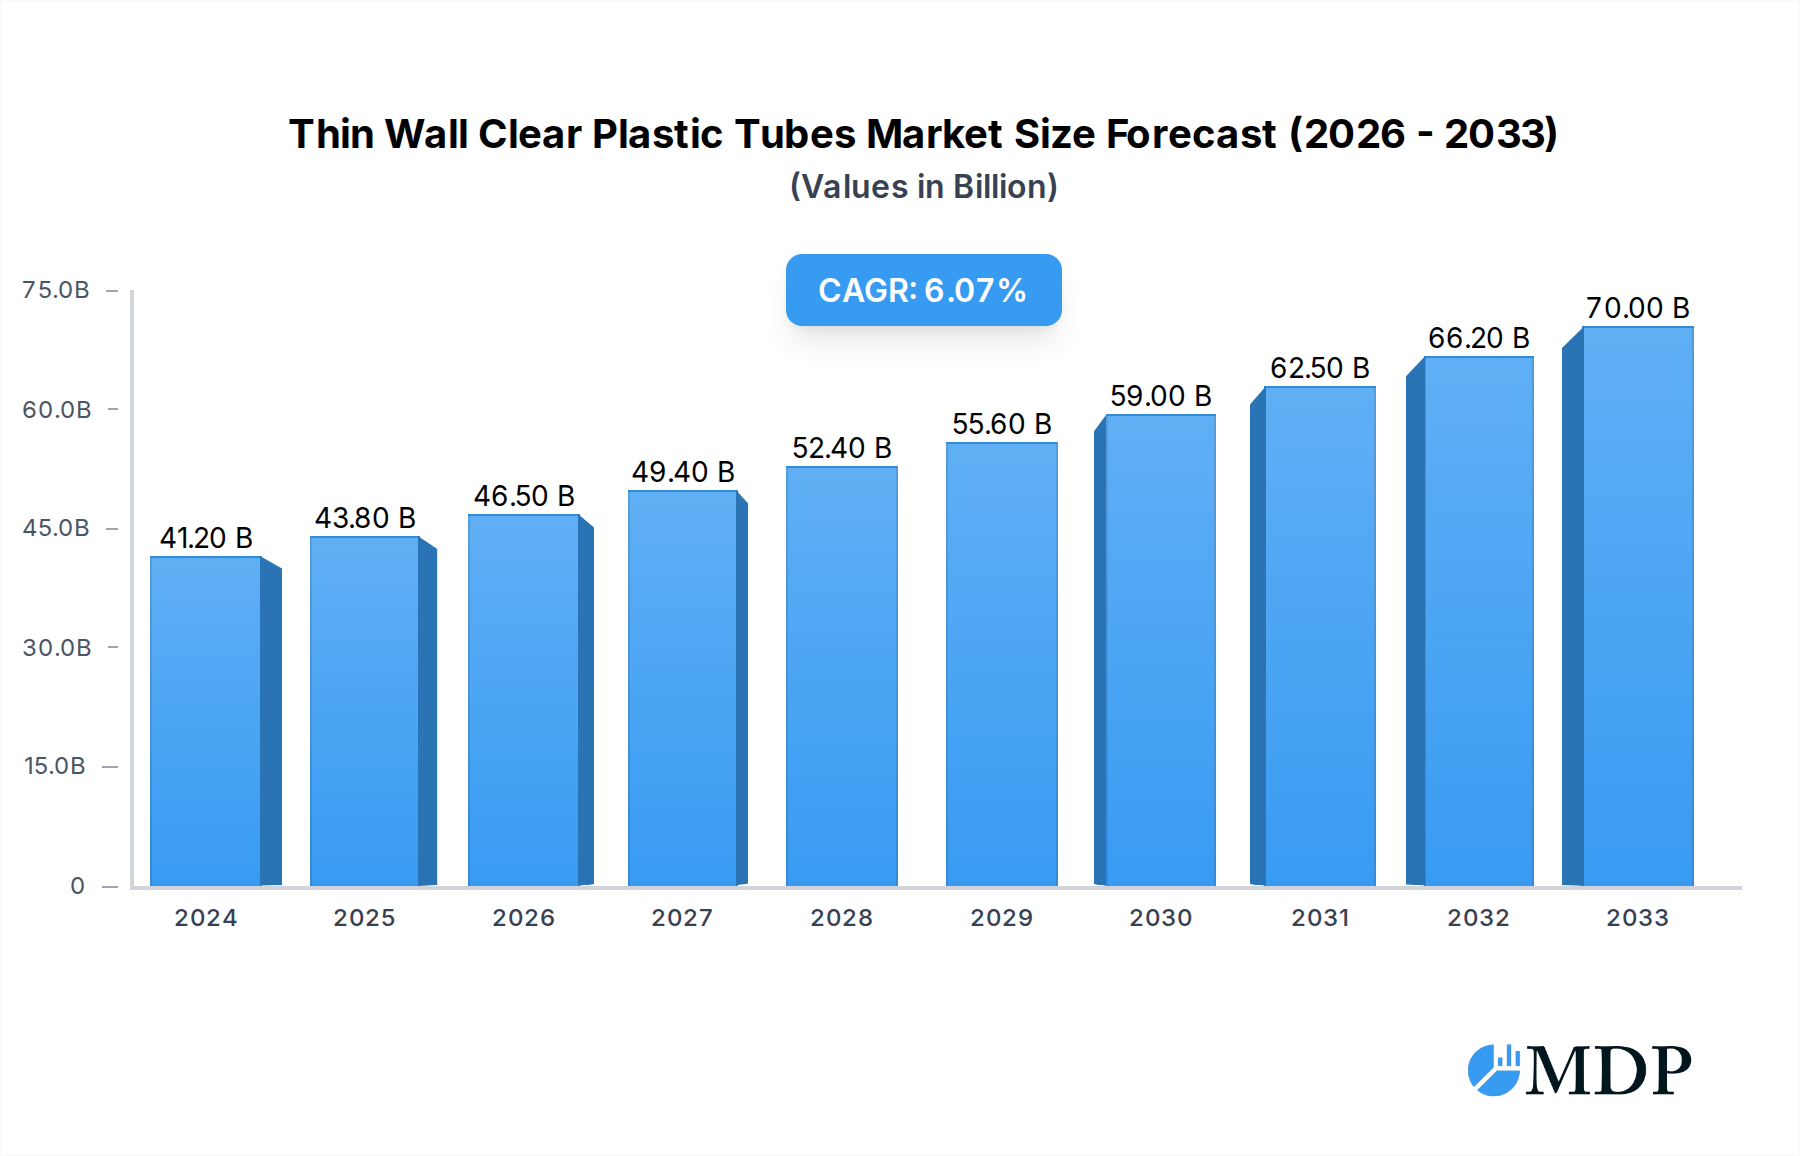
Thin Wall Clear Plastic Tubes Market Size (In Billion)
Further fueling this market's upward trajectory are ongoing technological advancements in extrusion processes, leading to the production of thinner, stronger, and more specialized plastic tubes. Innovations in materials science are also contributing, with the development of advanced polymers offering enhanced properties like improved chemical resistance, higher temperature tolerance, and greater biocompatibility. Emerging applications in the electronics sector, for instance, in wire insulation and optical components, are also presenting new avenues for growth. While the market is driven by these factors, potential restraints could include fluctuating raw material prices and the growing preference for sustainable alternatives in certain applications, although the inherent benefits of thin wall clear plastic tubes are expected to maintain their strong market position.

Thin Wall Clear Plastic Tubes Company Market Share
This in-depth report offers a definitive analysis of the global thin wall clear plastic tubes market, charting its trajectory from 2019 to 2033. Delving into market dynamics, industry trends, leading segments, product innovations, and strategic outlook, this research provides invaluable insights for manufacturers, suppliers, end-users, and investors. With a study period encompassing historical performance (2019-2024), a base year (2025), and a comprehensive forecast period (2025-2033), this report is an indispensable tool for understanding the evolving landscape of thin wall clear plastic tubes.
Thin Wall Clear Plastic Tubes Market Dynamics & Concentration
The global thin wall clear plastic tubes market exhibits a moderate concentration, with a blend of established multinational corporations and agile regional players. Innovation drivers are primarily fueled by the demand for enhanced material properties, such as improved clarity, chemical resistance, and biocompatibility, particularly within the medical and pharmaceutical industries. Stringent regulatory frameworks governing material safety and traceability, especially in healthcare applications, play a significant role in shaping market entry and product development. Product substitutes, though present, are largely niche and struggle to match the cost-effectiveness and versatility of thin wall clear plastic tubes. End-user trends are leaning towards specialized applications requiring high transparency for visual inspection and precise dispensing. Mergers and acquisitions (M&A) activities are expected to remain steady, with an estimated 50 M&A deals anticipated during the forecast period, as larger entities seek to consolidate market share and acquire innovative technologies. Market share is currently distributed, with the top five players holding approximately 35% of the global market.
Thin Wall Clear Plastic Tubes Industry Trends & Analysis
The thin wall clear plastic tubes industry is poised for robust growth, driven by an escalating demand across diverse sectors. The Compound Annual Growth Rate (CAGR) is projected to be a healthy 6.8% from 2025 to 2033. Market penetration is steadily increasing, currently standing at 45% of its potential addressable market. Key growth drivers include the expanding healthcare sector, with an increased need for drug delivery systems, diagnostic consumables, and sterile packaging. The pharmaceutical industry's continuous pursuit of advanced packaging solutions that ensure product integrity and visibility further propels this demand. Furthermore, the food and beverage sector leverages these tubes for product display, dispensing, and packaging of specialty items. The electronics industry also contributes to growth through their use in protective casings and components. Technological disruptions, such as advancements in extrusion technologies leading to thinner walls with enhanced strength and precision, are reshaping product capabilities. Consumer preferences for safe, transparent, and sustainable packaging solutions are also influencing material choices and manufacturing processes. The competitive landscape is characterized by a focus on customization, adherence to stringent quality standards, and the development of eco-friendly alternatives.
Leading Markets & Segments in Thin Wall Clear Plastic Tubes
The Medical Industry stands out as the dominant segment within the thin wall clear plastic tubes market, driven by an unyielding demand for sterile, biocompatible, and precision-engineered tubing for a myriad of applications. Within this segment, the United States leads in market penetration due to its advanced healthcare infrastructure and substantial investment in medical research and development.
Application Dominance:
- Medical Industry: Essential for catheters, IV sets, fluid delivery systems, diagnostic equipment, and surgical tools. High regulatory standards and the need for absolute product integrity ensure sustained demand.
- Pharmaceutical Industry: Crucial for drug packaging, vial inserts, and precise dispensing systems, where clarity is paramount for quality control.
- Food and Beverages: Growing use in specialty packaging for beverages, condiments, and confectionery, offering visual appeal and product protection.
- Electronics: Increasingly utilized for protective insulation, cable management, and component housing where clarity and dielectric properties are beneficial.
- Others: Encompasses diverse applications like industrial dispensing, scientific research, and hobbyist uses.
Type Dominance:
- Polycarbonate: Dominates due to its exceptional strength, clarity, rigidity, and impact resistance, making it ideal for demanding medical and industrial applications.
- PETG: Gaining traction for its excellent clarity, good chemical resistance, and ease of processing, suitable for food and beverage and some medical packaging.
- PVC: A cost-effective option with good flexibility and chemical resistance, widely used in general-purpose applications, though its usage is facing scrutiny in certain sensitive sectors due to environmental concerns.
Key drivers for the dominance of these segments include:
- Economic Policies: Government initiatives supporting healthcare and pharmaceutical innovation globally.
- Infrastructure: Robust healthcare infrastructure in developed nations fuels the demand for advanced medical devices.
- Technological Advancements: Continuous innovation in material science and extrusion techniques enables the development of specialized tubes meeting stringent application requirements.
Thin Wall Clear Plastic Tubes Product Developments
Product development in the thin wall clear plastic tubes market is characterized by an emphasis on enhanced material performance and specialized applications. Innovations are focused on achieving ultra-thin walls with exceptional tensile strength, improved chemical inertness for sensitive substances, and superior optical clarity for advanced diagnostic and visualization needs. Manufacturers are also exploring bio-compatible and recyclable material formulations to address growing environmental concerns and regulatory pressures, particularly within the medical and food packaging sectors. These advancements provide a significant competitive advantage by enabling novel applications and meeting the evolving demands of high-value industries.
Key Drivers of Thin Wall Clear Plastic Tubes Growth
The growth of the thin wall clear plastic tubes market is propelled by several key factors. The burgeoning global healthcare sector, with its increasing demand for advanced medical devices and drug delivery systems, serves as a primary engine. Technological advancements in extrusion processes, allowing for greater precision and thinner wall thicknesses without compromising integrity, are crucial. Economic growth, particularly in emerging economies, is expanding the reach of industries that utilize these tubes, such as food and beverages and electronics. Furthermore, regulatory support for innovation in medical packaging and a growing consumer preference for transparent packaging solutions are significant accelerators.
Challenges in the Thin Wall Clear Plastic Tubes Market
Despite the positive outlook, the thin wall clear plastic tubes market faces several challenges. Stringent regulatory hurdles, especially concerning biocompatibility and environmental impact in medical and food applications, can slow down product approvals and market entry. Supply chain disruptions, including raw material price volatility and availability issues, can impact production costs and lead times, with an estimated 15% increase in material costs impacting profit margins. Intense competitive pressure from established players and emerging manufacturers also necessitates continuous innovation and cost optimization to maintain market share. The perception and disposal of plastic waste also pose an ongoing challenge, pushing for the development of sustainable alternatives.
Emerging Opportunities in Thin Wall Clear Plastic Tubes
Emerging opportunities in the thin wall clear plastic tubes market are largely driven by technological breakthroughs and strategic market expansion. The development of biodegradable and compostable plastic alternatives presents a significant avenue for growth, catering to increasing environmental consciousness. Advances in nanotechnology for enhanced material properties, such as antimicrobial surfaces or improved barrier functions, open up new application possibilities. Strategic partnerships between tube manufacturers and end-users in specialized fields like advanced diagnostics or personalized medicine can lead to the co-creation of innovative solutions. Expansion into underserved emerging markets with growing healthcare and consumer goods sectors also represents a substantial growth catalyst.
Leading Players in the Thin Wall Clear Plastic Tubes Sector
- Teel Plastics
- Freelin-Wade
- Primex Plastics Corporation
- Cleartec Packaging
- SKS Bottle & Packaging
- StockCap
- Absolute Custom Extrusions
- NewAge Industries, Inc.
- Petro Extrusion Technologies
- Pexco
- GSH Industries
- Plastic Extrusion Technologies
- Polytec Plastics
Key Milestones in Thin Wall Clear Plastic Tubes Industry
- 2019: Introduction of advanced co-extrusion techniques enabling multi-layer tubing for enhanced chemical resistance.
- 2020: Increased adoption of thinner wall profiles across medical device applications to reduce material usage and cost.
- 2021: Significant investment in R&D for bio-compatible and recyclable clear plastic tube formulations.
- 2022: Growth in demand for highly transparent tubes in diagnostic assay kits and laboratory consumables.
- 2023: Stringent regulatory updates for plastic materials in direct contact with pharmaceuticals, driving material innovation.
- 2024: Emerging trend of customized printing and branding on clear plastic tubes for consumer-facing products.
Strategic Outlook for Thin Wall Clear Plastic Tubes Market
The strategic outlook for the thin wall clear plastic tubes market is overwhelmingly positive, characterized by sustained growth and expanding application frontiers. Key growth accelerators include the relentless demand from the healthcare sector for innovative drug delivery and diagnostic solutions, coupled with the increasing adoption of advanced materials offering superior clarity and biocompatibility. Manufacturers will continue to invest in sustainable material development and efficient manufacturing processes to meet both regulatory demands and evolving consumer preferences. Strategic partnerships and a focus on niche, high-value applications will be critical for navigating the competitive landscape and capitalizing on emerging opportunities, particularly in advanced medical technologies and specialized packaging.
Thin Wall Clear Plastic Tubes Segmentation
-
1. Application
- 1.1. Medical Industry
- 1.2. Pharmaceutical Industry
- 1.3. Food and Beverages
- 1.4. Electronics
- 1.5. Others
-
2. Types
- 2.1. PVC
- 2.2. PETG
- 2.3. Polycarbonate
Thin Wall Clear Plastic Tubes Segmentation By Geography
-
1. North America
- 1.1. United States
- 1.2. Canada
- 1.3. Mexico
-
2. South America
- 2.1. Brazil
- 2.2. Argentina
- 2.3. Rest of South America
-
3. Europe
- 3.1. United Kingdom
- 3.2. Germany
- 3.3. France
- 3.4. Italy
- 3.5. Spain
- 3.6. Russia
- 3.7. Benelux
- 3.8. Nordics
- 3.9. Rest of Europe
-
4. Middle East & Africa
- 4.1. Turkey
- 4.2. Israel
- 4.3. GCC
- 4.4. North Africa
- 4.5. South Africa
- 4.6. Rest of Middle East & Africa
-
5. Asia Pacific
- 5.1. China
- 5.2. India
- 5.3. Japan
- 5.4. South Korea
- 5.5. ASEAN
- 5.6. Oceania
- 5.7. Rest of Asia Pacific
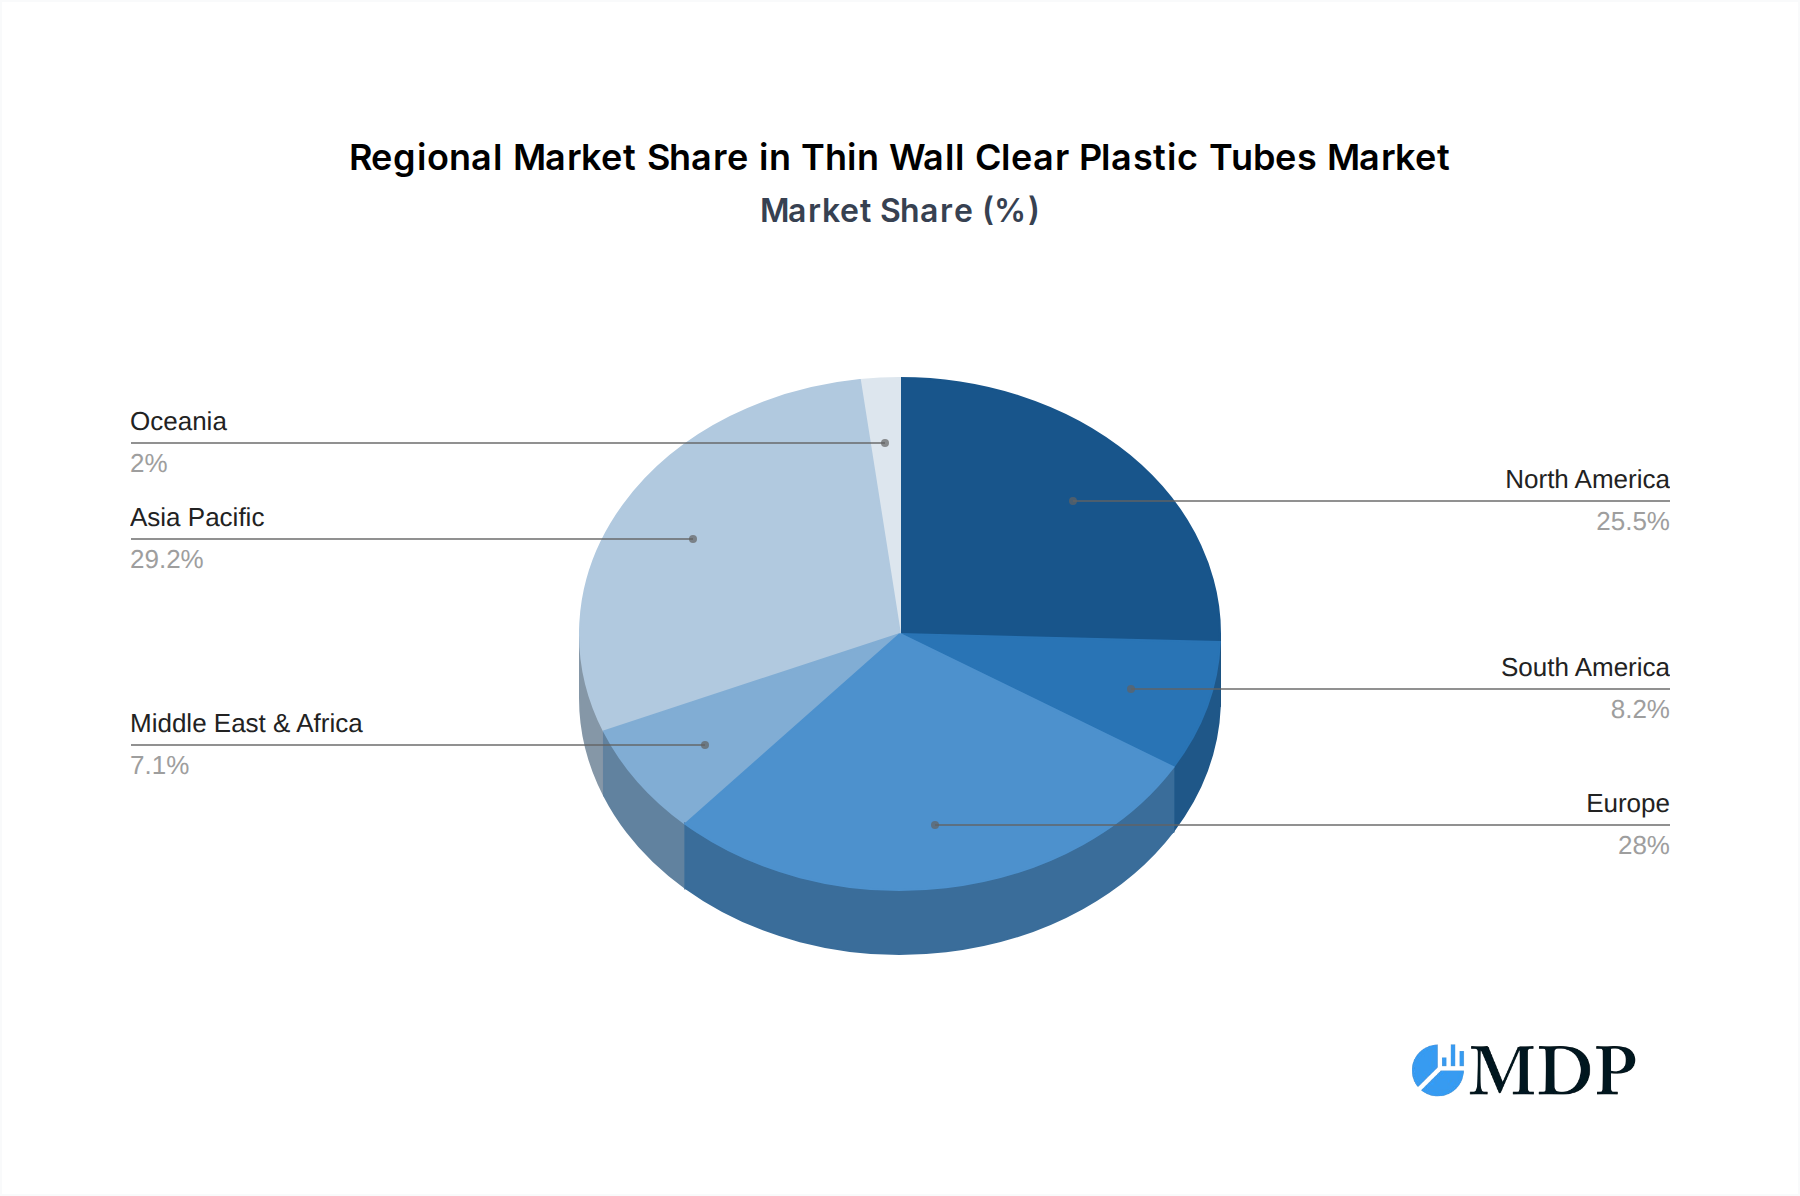
Thin Wall Clear Plastic Tubes Regional Market Share
Geographic Coverage of Thin Wall Clear Plastic Tubes
Thin Wall Clear Plastic Tubes REPORT HIGHLIGHTS
| Aspects | Details |
|---|---|
| Study Period | 2020-2034 |
| Base Year | 2025 |
| Estimated Year | 2026 |
| Forecast Period | 2026-2034 |
| Historical Period | 2020-2025 |
| Growth Rate | CAGR of 6.5% from 2020-2034 |
| Segmentation |
|
Table of Contents
- 1. Introduction
- 1.1. Research Scope
- 1.2. Market Segmentation
- 1.3. Research Methodology
- 1.4. Definitions and Assumptions
- 2. Executive Summary
- 2.1. Introduction
- 3. Market Dynamics
- 3.1. Introduction
- 3.2. Market Drivers
- 3.3. Market Restrains
- 3.4. Market Trends
- 4. Market Factor Analysis
- 4.1. Porters Five Forces
- 4.2. Supply/Value Chain
- 4.3. PESTEL analysis
- 4.4. Market Entropy
- 4.5. Patent/Trademark Analysis
- 5. Global Thin Wall Clear Plastic Tubes Analysis, Insights and Forecast, 2020-2032
- 5.1. Market Analysis, Insights and Forecast - by Application
- 5.1.1. Medical Industry
- 5.1.2. Pharmaceutical Industry
- 5.1.3. Food and Beverages
- 5.1.4. Electronics
- 5.1.5. Others
- 5.2. Market Analysis, Insights and Forecast - by Types
- 5.2.1. PVC
- 5.2.2. PETG
- 5.2.3. Polycarbonate
- 5.3. Market Analysis, Insights and Forecast - by Region
- 5.3.1. North America
- 5.3.2. South America
- 5.3.3. Europe
- 5.3.4. Middle East & Africa
- 5.3.5. Asia Pacific
- 5.1. Market Analysis, Insights and Forecast - by Application
- 6. North America Thin Wall Clear Plastic Tubes Analysis, Insights and Forecast, 2020-2032
- 6.1. Market Analysis, Insights and Forecast - by Application
- 6.1.1. Medical Industry
- 6.1.2. Pharmaceutical Industry
- 6.1.3. Food and Beverages
- 6.1.4. Electronics
- 6.1.5. Others
- 6.2. Market Analysis, Insights and Forecast - by Types
- 6.2.1. PVC
- 6.2.2. PETG
- 6.2.3. Polycarbonate
- 6.1. Market Analysis, Insights and Forecast - by Application
- 7. South America Thin Wall Clear Plastic Tubes Analysis, Insights and Forecast, 2020-2032
- 7.1. Market Analysis, Insights and Forecast - by Application
- 7.1.1. Medical Industry
- 7.1.2. Pharmaceutical Industry
- 7.1.3. Food and Beverages
- 7.1.4. Electronics
- 7.1.5. Others
- 7.2. Market Analysis, Insights and Forecast - by Types
- 7.2.1. PVC
- 7.2.2. PETG
- 7.2.3. Polycarbonate
- 7.1. Market Analysis, Insights and Forecast - by Application
- 8. Europe Thin Wall Clear Plastic Tubes Analysis, Insights and Forecast, 2020-2032
- 8.1. Market Analysis, Insights and Forecast - by Application
- 8.1.1. Medical Industry
- 8.1.2. Pharmaceutical Industry
- 8.1.3. Food and Beverages
- 8.1.4. Electronics
- 8.1.5. Others
- 8.2. Market Analysis, Insights and Forecast - by Types
- 8.2.1. PVC
- 8.2.2. PETG
- 8.2.3. Polycarbonate
- 8.1. Market Analysis, Insights and Forecast - by Application
- 9. Middle East & Africa Thin Wall Clear Plastic Tubes Analysis, Insights and Forecast, 2020-2032
- 9.1. Market Analysis, Insights and Forecast - by Application
- 9.1.1. Medical Industry
- 9.1.2. Pharmaceutical Industry
- 9.1.3. Food and Beverages
- 9.1.4. Electronics
- 9.1.5. Others
- 9.2. Market Analysis, Insights and Forecast - by Types
- 9.2.1. PVC
- 9.2.2. PETG
- 9.2.3. Polycarbonate
- 9.1. Market Analysis, Insights and Forecast - by Application
- 10. Asia Pacific Thin Wall Clear Plastic Tubes Analysis, Insights and Forecast, 2020-2032
- 10.1. Market Analysis, Insights and Forecast - by Application
- 10.1.1. Medical Industry
- 10.1.2. Pharmaceutical Industry
- 10.1.3. Food and Beverages
- 10.1.4. Electronics
- 10.1.5. Others
- 10.2. Market Analysis, Insights and Forecast - by Types
- 10.2.1. PVC
- 10.2.2. PETG
- 10.2.3. Polycarbonate
- 10.1. Market Analysis, Insights and Forecast - by Application
- 11. Competitive Analysis
- 11.1. Global Market Share Analysis 2025
- 11.2. Company Profiles
- 11.2.1 Teel Plastics
- 11.2.1.1. Overview
- 11.2.1.2. Products
- 11.2.1.3. SWOT Analysis
- 11.2.1.4. Recent Developments
- 11.2.1.5. Financials (Based on Availability)
- 11.2.2 Freelin-Wade
- 11.2.2.1. Overview
- 11.2.2.2. Products
- 11.2.2.3. SWOT Analysis
- 11.2.2.4. Recent Developments
- 11.2.2.5. Financials (Based on Availability)
- 11.2.3 Primex Plastics Corporation
- 11.2.3.1. Overview
- 11.2.3.2. Products
- 11.2.3.3. SWOT Analysis
- 11.2.3.4. Recent Developments
- 11.2.3.5. Financials (Based on Availability)
- 11.2.4 Cleartec Packaging
- 11.2.4.1. Overview
- 11.2.4.2. Products
- 11.2.4.3. SWOT Analysis
- 11.2.4.4. Recent Developments
- 11.2.4.5. Financials (Based on Availability)
- 11.2.5 SKS Bottle & Packaging
- 11.2.5.1. Overview
- 11.2.5.2. Products
- 11.2.5.3. SWOT Analysis
- 11.2.5.4. Recent Developments
- 11.2.5.5. Financials (Based on Availability)
- 11.2.6 StockCap
- 11.2.6.1. Overview
- 11.2.6.2. Products
- 11.2.6.3. SWOT Analysis
- 11.2.6.4. Recent Developments
- 11.2.6.5. Financials (Based on Availability)
- 11.2.7 Absolute Custom Extrusions
- 11.2.7.1. Overview
- 11.2.7.2. Products
- 11.2.7.3. SWOT Analysis
- 11.2.7.4. Recent Developments
- 11.2.7.5. Financials (Based on Availability)
- 11.2.8 NewAge Industries
- 11.2.8.1. Overview
- 11.2.8.2. Products
- 11.2.8.3. SWOT Analysis
- 11.2.8.4. Recent Developments
- 11.2.8.5. Financials (Based on Availability)
- 11.2.9 Inc.
- 11.2.9.1. Overview
- 11.2.9.2. Products
- 11.2.9.3. SWOT Analysis
- 11.2.9.4. Recent Developments
- 11.2.9.5. Financials (Based on Availability)
- 11.2.10 Petro Extrusion Technologies
- 11.2.10.1. Overview
- 11.2.10.2. Products
- 11.2.10.3. SWOT Analysis
- 11.2.10.4. Recent Developments
- 11.2.10.5. Financials (Based on Availability)
- 11.2.11 Pexco
- 11.2.11.1. Overview
- 11.2.11.2. Products
- 11.2.11.3. SWOT Analysis
- 11.2.11.4. Recent Developments
- 11.2.11.5. Financials (Based on Availability)
- 11.2.12 GSH Industries
- 11.2.12.1. Overview
- 11.2.12.2. Products
- 11.2.12.3. SWOT Analysis
- 11.2.12.4. Recent Developments
- 11.2.12.5. Financials (Based on Availability)
- 11.2.13 Plastic Extrusion Technologies
- 11.2.13.1. Overview
- 11.2.13.2. Products
- 11.2.13.3. SWOT Analysis
- 11.2.13.4. Recent Developments
- 11.2.13.5. Financials (Based on Availability)
- 11.2.14 Polytec Plastics
- 11.2.14.1. Overview
- 11.2.14.2. Products
- 11.2.14.3. SWOT Analysis
- 11.2.14.4. Recent Developments
- 11.2.14.5. Financials (Based on Availability)
- 11.2.1 Teel Plastics
List of Figures
- Figure 1: Global Thin Wall Clear Plastic Tubes Revenue Breakdown (billion, %) by Region 2025 & 2033
- Figure 2: North America Thin Wall Clear Plastic Tubes Revenue (billion), by Application 2025 & 2033
- Figure 3: North America Thin Wall Clear Plastic Tubes Revenue Share (%), by Application 2025 & 2033
- Figure 4: North America Thin Wall Clear Plastic Tubes Revenue (billion), by Types 2025 & 2033
- Figure 5: North America Thin Wall Clear Plastic Tubes Revenue Share (%), by Types 2025 & 2033
- Figure 6: North America Thin Wall Clear Plastic Tubes Revenue (billion), by Country 2025 & 2033
- Figure 7: North America Thin Wall Clear Plastic Tubes Revenue Share (%), by Country 2025 & 2033
- Figure 8: South America Thin Wall Clear Plastic Tubes Revenue (billion), by Application 2025 & 2033
- Figure 9: South America Thin Wall Clear Plastic Tubes Revenue Share (%), by Application 2025 & 2033
- Figure 10: South America Thin Wall Clear Plastic Tubes Revenue (billion), by Types 2025 & 2033
- Figure 11: South America Thin Wall Clear Plastic Tubes Revenue Share (%), by Types 2025 & 2033
- Figure 12: South America Thin Wall Clear Plastic Tubes Revenue (billion), by Country 2025 & 2033
- Figure 13: South America Thin Wall Clear Plastic Tubes Revenue Share (%), by Country 2025 & 2033
- Figure 14: Europe Thin Wall Clear Plastic Tubes Revenue (billion), by Application 2025 & 2033
- Figure 15: Europe Thin Wall Clear Plastic Tubes Revenue Share (%), by Application 2025 & 2033
- Figure 16: Europe Thin Wall Clear Plastic Tubes Revenue (billion), by Types 2025 & 2033
- Figure 17: Europe Thin Wall Clear Plastic Tubes Revenue Share (%), by Types 2025 & 2033
- Figure 18: Europe Thin Wall Clear Plastic Tubes Revenue (billion), by Country 2025 & 2033
- Figure 19: Europe Thin Wall Clear Plastic Tubes Revenue Share (%), by Country 2025 & 2033
- Figure 20: Middle East & Africa Thin Wall Clear Plastic Tubes Revenue (billion), by Application 2025 & 2033
- Figure 21: Middle East & Africa Thin Wall Clear Plastic Tubes Revenue Share (%), by Application 2025 & 2033
- Figure 22: Middle East & Africa Thin Wall Clear Plastic Tubes Revenue (billion), by Types 2025 & 2033
- Figure 23: Middle East & Africa Thin Wall Clear Plastic Tubes Revenue Share (%), by Types 2025 & 2033
- Figure 24: Middle East & Africa Thin Wall Clear Plastic Tubes Revenue (billion), by Country 2025 & 2033
- Figure 25: Middle East & Africa Thin Wall Clear Plastic Tubes Revenue Share (%), by Country 2025 & 2033
- Figure 26: Asia Pacific Thin Wall Clear Plastic Tubes Revenue (billion), by Application 2025 & 2033
- Figure 27: Asia Pacific Thin Wall Clear Plastic Tubes Revenue Share (%), by Application 2025 & 2033
- Figure 28: Asia Pacific Thin Wall Clear Plastic Tubes Revenue (billion), by Types 2025 & 2033
- Figure 29: Asia Pacific Thin Wall Clear Plastic Tubes Revenue Share (%), by Types 2025 & 2033
- Figure 30: Asia Pacific Thin Wall Clear Plastic Tubes Revenue (billion), by Country 2025 & 2033
- Figure 31: Asia Pacific Thin Wall Clear Plastic Tubes Revenue Share (%), by Country 2025 & 2033
List of Tables
- Table 1: Global Thin Wall Clear Plastic Tubes Revenue billion Forecast, by Application 2020 & 2033
- Table 2: Global Thin Wall Clear Plastic Tubes Revenue billion Forecast, by Types 2020 & 2033
- Table 3: Global Thin Wall Clear Plastic Tubes Revenue billion Forecast, by Region 2020 & 2033
- Table 4: Global Thin Wall Clear Plastic Tubes Revenue billion Forecast, by Application 2020 & 2033
- Table 5: Global Thin Wall Clear Plastic Tubes Revenue billion Forecast, by Types 2020 & 2033
- Table 6: Global Thin Wall Clear Plastic Tubes Revenue billion Forecast, by Country 2020 & 2033
- Table 7: United States Thin Wall Clear Plastic Tubes Revenue (billion) Forecast, by Application 2020 & 2033
- Table 8: Canada Thin Wall Clear Plastic Tubes Revenue (billion) Forecast, by Application 2020 & 2033
- Table 9: Mexico Thin Wall Clear Plastic Tubes Revenue (billion) Forecast, by Application 2020 & 2033
- Table 10: Global Thin Wall Clear Plastic Tubes Revenue billion Forecast, by Application 2020 & 2033
- Table 11: Global Thin Wall Clear Plastic Tubes Revenue billion Forecast, by Types 2020 & 2033
- Table 12: Global Thin Wall Clear Plastic Tubes Revenue billion Forecast, by Country 2020 & 2033
- Table 13: Brazil Thin Wall Clear Plastic Tubes Revenue (billion) Forecast, by Application 2020 & 2033
- Table 14: Argentina Thin Wall Clear Plastic Tubes Revenue (billion) Forecast, by Application 2020 & 2033
- Table 15: Rest of South America Thin Wall Clear Plastic Tubes Revenue (billion) Forecast, by Application 2020 & 2033
- Table 16: Global Thin Wall Clear Plastic Tubes Revenue billion Forecast, by Application 2020 & 2033
- Table 17: Global Thin Wall Clear Plastic Tubes Revenue billion Forecast, by Types 2020 & 2033
- Table 18: Global Thin Wall Clear Plastic Tubes Revenue billion Forecast, by Country 2020 & 2033
- Table 19: United Kingdom Thin Wall Clear Plastic Tubes Revenue (billion) Forecast, by Application 2020 & 2033
- Table 20: Germany Thin Wall Clear Plastic Tubes Revenue (billion) Forecast, by Application 2020 & 2033
- Table 21: France Thin Wall Clear Plastic Tubes Revenue (billion) Forecast, by Application 2020 & 2033
- Table 22: Italy Thin Wall Clear Plastic Tubes Revenue (billion) Forecast, by Application 2020 & 2033
- Table 23: Spain Thin Wall Clear Plastic Tubes Revenue (billion) Forecast, by Application 2020 & 2033
- Table 24: Russia Thin Wall Clear Plastic Tubes Revenue (billion) Forecast, by Application 2020 & 2033
- Table 25: Benelux Thin Wall Clear Plastic Tubes Revenue (billion) Forecast, by Application 2020 & 2033
- Table 26: Nordics Thin Wall Clear Plastic Tubes Revenue (billion) Forecast, by Application 2020 & 2033
- Table 27: Rest of Europe Thin Wall Clear Plastic Tubes Revenue (billion) Forecast, by Application 2020 & 2033
- Table 28: Global Thin Wall Clear Plastic Tubes Revenue billion Forecast, by Application 2020 & 2033
- Table 29: Global Thin Wall Clear Plastic Tubes Revenue billion Forecast, by Types 2020 & 2033
- Table 30: Global Thin Wall Clear Plastic Tubes Revenue billion Forecast, by Country 2020 & 2033
- Table 31: Turkey Thin Wall Clear Plastic Tubes Revenue (billion) Forecast, by Application 2020 & 2033
- Table 32: Israel Thin Wall Clear Plastic Tubes Revenue (billion) Forecast, by Application 2020 & 2033
- Table 33: GCC Thin Wall Clear Plastic Tubes Revenue (billion) Forecast, by Application 2020 & 2033
- Table 34: North Africa Thin Wall Clear Plastic Tubes Revenue (billion) Forecast, by Application 2020 & 2033
- Table 35: South Africa Thin Wall Clear Plastic Tubes Revenue (billion) Forecast, by Application 2020 & 2033
- Table 36: Rest of Middle East & Africa Thin Wall Clear Plastic Tubes Revenue (billion) Forecast, by Application 2020 & 2033
- Table 37: Global Thin Wall Clear Plastic Tubes Revenue billion Forecast, by Application 2020 & 2033
- Table 38: Global Thin Wall Clear Plastic Tubes Revenue billion Forecast, by Types 2020 & 2033
- Table 39: Global Thin Wall Clear Plastic Tubes Revenue billion Forecast, by Country 2020 & 2033
- Table 40: China Thin Wall Clear Plastic Tubes Revenue (billion) Forecast, by Application 2020 & 2033
- Table 41: India Thin Wall Clear Plastic Tubes Revenue (billion) Forecast, by Application 2020 & 2033
- Table 42: Japan Thin Wall Clear Plastic Tubes Revenue (billion) Forecast, by Application 2020 & 2033
- Table 43: South Korea Thin Wall Clear Plastic Tubes Revenue (billion) Forecast, by Application 2020 & 2033
- Table 44: ASEAN Thin Wall Clear Plastic Tubes Revenue (billion) Forecast, by Application 2020 & 2033
- Table 45: Oceania Thin Wall Clear Plastic Tubes Revenue (billion) Forecast, by Application 2020 & 2033
- Table 46: Rest of Asia Pacific Thin Wall Clear Plastic Tubes Revenue (billion) Forecast, by Application 2020 & 2033
Frequently Asked Questions
1. What is the projected Compound Annual Growth Rate (CAGR) of the Thin Wall Clear Plastic Tubes?
The projected CAGR is approximately 6.5%.
2. Which companies are prominent players in the Thin Wall Clear Plastic Tubes?
Key companies in the market include Teel Plastics, Freelin-Wade, Primex Plastics Corporation, Cleartec Packaging, SKS Bottle & Packaging, StockCap, Absolute Custom Extrusions, NewAge Industries, Inc., Petro Extrusion Technologies, Pexco, GSH Industries, Plastic Extrusion Technologies, Polytec Plastics.
3. What are the main segments of the Thin Wall Clear Plastic Tubes?
The market segments include Application, Types.
4. Can you provide details about the market size?
The market size is estimated to be USD 41.2 billion as of 2022.
5. What are some drivers contributing to market growth?
N/A
6. What are the notable trends driving market growth?
N/A
7. Are there any restraints impacting market growth?
N/A
8. Can you provide examples of recent developments in the market?
N/A
9. What pricing options are available for accessing the report?
Pricing options include single-user, multi-user, and enterprise licenses priced at USD 4900.00, USD 7350.00, and USD 9800.00 respectively.
10. Is the market size provided in terms of value or volume?
The market size is provided in terms of value, measured in billion.
11. Are there any specific market keywords associated with the report?
Yes, the market keyword associated with the report is "Thin Wall Clear Plastic Tubes," which aids in identifying and referencing the specific market segment covered.
12. How do I determine which pricing option suits my needs best?
The pricing options vary based on user requirements and access needs. Individual users may opt for single-user licenses, while businesses requiring broader access may choose multi-user or enterprise licenses for cost-effective access to the report.
13. Are there any additional resources or data provided in the Thin Wall Clear Plastic Tubes report?
While the report offers comprehensive insights, it's advisable to review the specific contents or supplementary materials provided to ascertain if additional resources or data are available.
14. How can I stay updated on further developments or reports in the Thin Wall Clear Plastic Tubes?
To stay informed about further developments, trends, and reports in the Thin Wall Clear Plastic Tubes, consider subscribing to industry newsletters, following relevant companies and organizations, or regularly checking reputable industry news sources and publications.
Methodology
Step 1 - Identification of Relevant Samples Size from Population Database


Step 2 - Approaches for Defining Global Market Size (Value, Volume* & Price*)

Note*: In applicable scenarios
Step 3 - Data Sources
Primary Research
- Web Analytics
- Survey Reports
- Research Institute
- Latest Research Reports
- Opinion Leaders
Secondary Research
- Annual Reports
- White Paper
- Latest Press Release
- Industry Association
- Paid Database
- Investor Presentations

Step 4 - Data Triangulation
Involves using different sources of information in order to increase the validity of a study
These sources are likely to be stakeholders in a program - participants, other researchers, program staff, other community members, and so on.
Then we put all data in single framework & apply various statistical tools to find out the dynamic on the market.
During the analysis stage, feedback from the stakeholder groups would be compared to determine areas of agreement as well as areas of divergence