

Key Insights
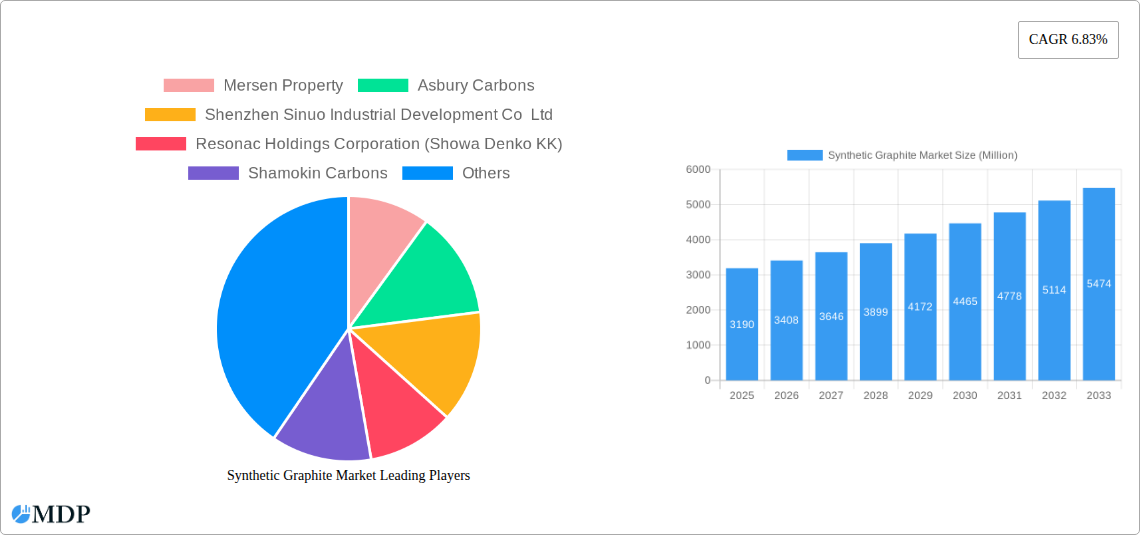
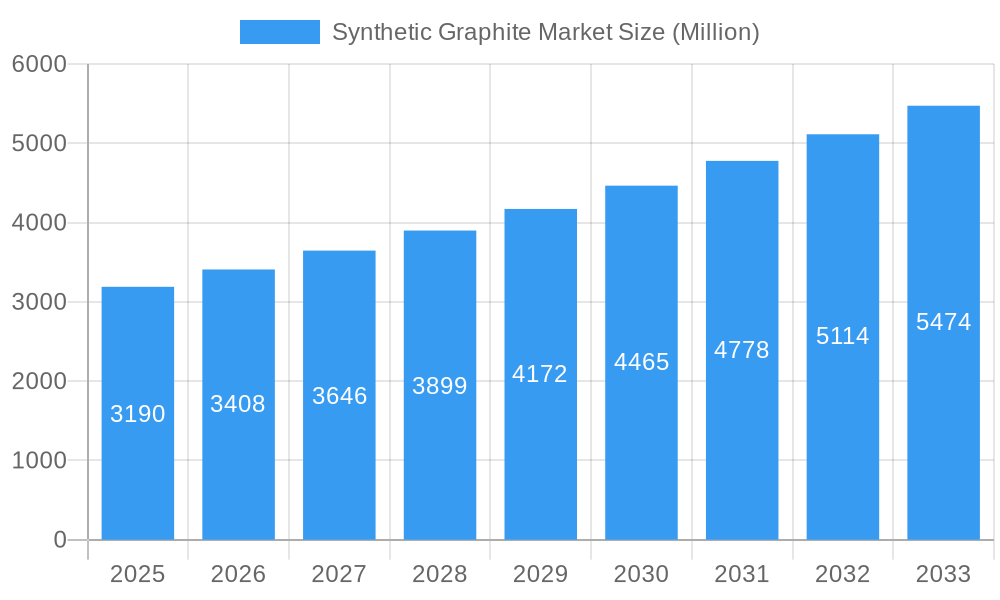
The global synthetic graphite market, valued at $3.19 billion in 2025, is projected to experience robust growth, driven by the escalating demand for high-performance batteries in electric vehicles (EVs) and energy storage systems (ESS). A compound annual growth rate (CAGR) of 6.83% from 2025 to 2033 indicates a significant expansion, reaching an estimated market value exceeding $5.5 billion by 2033. This growth is fueled by several key factors. The increasing adoption of EVs globally, coupled with the growing need for renewable energy solutions and grid stabilization, is creating a substantial demand for high-quality synthetic graphite anodes. Furthermore, advancements in battery technology, leading to higher energy density and longer lifespan, further bolster market expansion. The metallurgy and other industrial applications of synthetic graphite also contribute to overall market size, though the battery sector dominates growth. While raw material price fluctuations and environmental regulations present challenges, technological innovations aimed at improving efficiency and reducing environmental impact are mitigating these restraints. The market is segmented by type (graphite anode, graphite block, other types) and application (metallurgy, parts & components, batteries, nuclear, other applications), with the battery application segment displaying the most significant growth potential. Regional analysis reveals that the Asia-Pacific region, particularly China and other Asian manufacturing hubs, holds the largest market share, driven by significant battery production and manufacturing capacity. North America and Europe follow, reflecting strong demand from the automotive and energy sectors in those regions.
Synthetic Graphite Market Market Size (In Billion)
The competitive landscape is characterized by a mix of large multinational corporations and specialized regional players. Key market participants include established players like Mersen, Asbury Carbons, and Showa Denko, alongside emerging companies in China and other Asian nations. The competitive dynamics are shaped by factors such as technological innovation, production capacity, cost efficiency, and geographical reach. The market will likely witness increased strategic partnerships, mergers, and acquisitions to gain a competitive edge. Going forward, the focus will be on developing sustainable and cost-effective synthetic graphite production methods, meeting the growing demand while minimizing environmental impacts. This will involve significant investment in research and development, along with the adoption of advanced manufacturing technologies to ensure a secure supply chain for the future.
Synthetic Graphite Market Company Market Share
Synthetic Graphite Market: A Comprehensive Report (2019-2033)
This in-depth report provides a comprehensive analysis of the Synthetic Graphite Market, offering valuable insights for stakeholders across the industry value chain. From market dynamics and leading players to emerging opportunities and future trends, this report is your essential guide to navigating the complexities of this rapidly evolving sector. The report covers the period 2019-2033, with a base year of 2025 and a forecast period of 2025-2033. The study period covers historical data from 2019-2024.
Synthetic Graphite Market Market Dynamics & Concentration
The global synthetic graphite market is characterized by moderate concentration, with a handful of major players holding significant market share. The market's dynamics are shaped by several key factors:
- Innovation Drivers: Continuous advancements in material science are driving the development of higher-performance synthetic graphite products, catering to the demanding requirements of diverse applications. This includes improvements in purity, thermal conductivity, and electrical properties.
- Regulatory Frameworks: Government regulations concerning environmental sustainability and the responsible sourcing of raw materials are increasingly influencing market trends. Stringent emission standards are pushing manufacturers to adopt more efficient and eco-friendly production processes.
- Product Substitutes: While synthetic graphite possesses unique properties, alternative materials like carbon nanotubes and graphene are emerging as potential substitutes in specific niche applications, exerting competitive pressure. However, the established cost-effectiveness and performance characteristics of synthetic graphite continue to secure its dominant position.
- End-User Trends: The booming electric vehicle (EV) battery market is a major growth driver, significantly increasing the demand for high-quality synthetic graphite anodes. The expanding renewable energy sector, particularly solar power and energy storage systems, further contributes to market growth.
- M&A Activities: The past five years have witnessed xx M&A deals in the synthetic graphite industry, reflecting a trend of consolidation and strategic expansion among major players. These deals often aim to secure access to critical raw materials, enhance technological capabilities, and broaden market reach. Market share distribution is estimated to be as follows: the top 5 players hold approximately 60% of the market share, while the remaining 40% is distributed among numerous smaller companies.
Synthetic Graphite Market Industry Trends & Analysis
The global synthetic graphite market is experiencing robust growth, with a projected CAGR of xx% during the forecast period (2025-2033). This growth is primarily driven by the increasing demand from the battery industry. Market penetration in the EV battery sector is expected to reach xx% by 2033, significantly propelling market expansion. Several factors contribute to this upward trajectory:
- Technological Disruptions: Advancements in production techniques, such as the development of more efficient purification and processing methods, are reducing costs and improving product quality.
- Consumer Preferences: The growing preference for electric vehicles and renewable energy sources is driving the demand for high-performance synthetic graphite. Consumers are increasingly concerned with environmental sustainability, fueling demand for environmentally friendly battery technologies.
- Competitive Dynamics: Intense competition among established players and the emergence of new entrants are driving innovation and price optimization. However, a relatively high barrier to entry due to the capital-intensive nature of production helps maintain a degree of market stability. The continuous improvement in the quality and performance of synthetic graphite products also contribute to a strong competitive landscape.
Leading Markets & Segments in Synthetic Graphite Market
The batteries segment currently dominates the synthetic graphite market, accounting for approximately xx Million USD in revenue in 2025. The strong growth in the electric vehicle and energy storage sectors is the primary driver of this segment's dominance. In terms of type, graphite anode material holds the largest market share, owing to its critical role in lithium-ion batteries.
Key Drivers for Battery Segment Dominance:
- Rapid growth of the electric vehicle industry.
- Expansion of renewable energy storage solutions.
- Increasing demand for high-energy-density batteries.
Key Drivers for Graphite Anode Segment Dominance:
- Superior electrochemical properties compared to other graphite types.
- High energy storage capacity.
- Extensive research and development efforts focused on improving graphite anode performance.
Geographically, Asia-Pacific is the leading region, primarily driven by the rapid growth of the lithium-ion battery industry in China, Japan, and South Korea. The region benefits from favorable government policies promoting the adoption of electric vehicles and renewable energy technologies. This coupled with a robust manufacturing base and established supply chains contributes significantly to the region’s dominance. The robust infrastructure and supportive government policies in this region are vital in driving market growth.
The metallurgy and nuclear segments constitute a significant, though smaller portion of the market in comparison to the battery segment. Parts and components are another application, which is gaining traction.
Synthetic Graphite Market Product Developments
Recent advancements have focused on developing high-purity, high-performance synthetic graphite materials to meet the increasingly stringent requirements of next-generation lithium-ion batteries and other high-value applications. Innovations in processing techniques are leading to improved material consistency, reducing manufacturing costs and enhancing product reliability. This ongoing product development is crucial for maintaining the competitive edge in the global market.
Key Drivers of Synthetic Graphite Market Growth
The synthetic graphite market's growth is driven by several key factors:
- Technological Advancements: Continuous improvements in production technologies and material properties.
- Electric Vehicle Revolution: The exponential growth of the electric vehicle market is driving significant demand for high-quality synthetic graphite anodes.
- Renewable Energy Expansion: The increasing deployment of renewable energy sources, especially solar and wind power, contributes to heightened demand for energy storage solutions using lithium-ion batteries.
Challenges in the Synthetic Graphite Market Market
Several challenges hinder the market's growth:
- Raw Material Supply: The availability and price volatility of raw materials, particularly petroleum coke, are major concerns.
- Environmental Regulations: Stringent environmental regulations regarding emissions and waste disposal increase production costs.
- Competition: Intense competition among existing players and the entry of new players exert price pressure and increase the need for continuous innovation.
Emerging Opportunities in Synthetic Graphite Market
Emerging opportunities lie in the development of advanced graphite materials for next-generation battery technologies, expansion into new applications (e.g., fuel cells), and strategic partnerships to secure raw materials and expand market reach. The increasing demand for sustainable energy solutions also presents a vast market opportunity.
Leading Players in the Synthetic Graphite Market Sector
- Mersen Property
- Asbury Carbons
- Shenzhen Sinuo Industrial Development Co Ltd
- Resonac Holdings Corporation (Showa Denko KK)
- Shamokin Carbons
- Mitsubishi Chemical Corporation
- Nippon Carbon Co Ltd
- Jiangxi Zichen Technology Co Ltd
- Tokai Cobex GmbH
- GrafTech International
- BTR New Materials Group Co Ltd
- Imerys
- Shanghai Shanshan Technology Co Ltd
- Graphit Kropfmühl GmbH
- Graphite India Limited
- Lianyungang Jinli Carbon Co Ltd
Key Milestones in Synthetic Graphite Market Industry
- October 2022: Imerys Imerys Graphite & Carbon Company launched the EMILI Project, a significant lithium exploitation project aiming to reduce lithium imports and support the production of nearly 700,000 electric vehicle batteries annually. This development significantly impacts the supply chain and enhances the market's sustainability.
- April 2022: Shanghai Shanshan Lithium Battery Material Technology Co. Ltd. secured USD 477 Million in investments from Wending Investment, BYD, Amperex Technology Limited (ATL), and the Kunlun Fund. This substantial investment underscores the growing investor confidence in the lithium-ion battery industry and the crucial role of synthetic graphite.
Strategic Outlook for Synthetic Graphite Market Market
The future of the synthetic graphite market is bright, driven by sustained growth in the electric vehicle and renewable energy sectors. Strategic partnerships, technological innovation, and expansion into new applications will be critical for capturing market share and achieving long-term success. The market's continued expansion offers significant opportunities for both established players and new entrants.
Synthetic Graphite Market Segmentation
-
1. Type
- 1.1. Graphite Anode
- 1.2. Graphite Block (Fine Carbon)
- 1.3. Other Types (Graphite Electrode, etc.)
-
2. Application
- 2.1. Metallurgy
- 2.2. Parts and Components
- 2.3. Batteries
- 2.4. Nuclear
- 2.5. Other Applications
Synthetic Graphite Market Segmentation By Geography
-
1. Asia Pacific
- 1.1. China
- 1.2. India
- 1.3. Japan
- 1.4. South Korea
- 1.5. Asean Countries
- 1.6. Rest of Asia Pacific
-
2. North America
- 2.1. United States
- 2.2. Canada
- 2.3. Mexico
-
3. Europe
- 3.1. Germany
- 3.2. United Kingdom
- 3.3. Italy
- 3.4. France
- 3.5. Russia
- 3.6. Rest of Europe
-
4. South America
- 4.1. Brazil
- 4.2. Argentina
- 4.3. Rest of South America
-
5. Middle East and Africa
- 5.1. Saudi Arabia
- 5.2. South Africa
- 5.3. Rest of Middle East and Africa
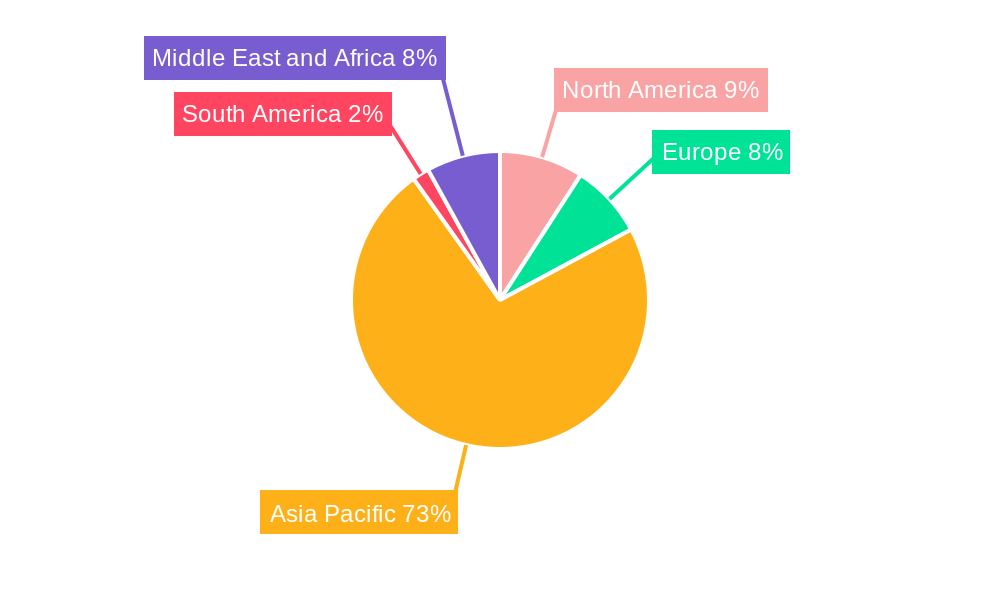
Synthetic Graphite Market Regional Market Share
Geographic Coverage of Synthetic Graphite Market
Synthetic Graphite Market REPORT HIGHLIGHTS
| Aspects | Details |
|---|---|
| Study Period | 2020-2034 |
| Base Year | 2025 |
| Estimated Year | 2026 |
| Forecast Period | 2026-2034 |
| Historical Period | 2020-2025 |
| Growth Rate | CAGR of 15.1% from 2020-2034 |
| Segmentation |
|
Table of Contents
- 1. Introduction
- 1.1. Research Scope
- 1.2. Market Segmentation
- 1.3. Research Objective
- 1.4. Definitions and Assumptions
- 2. Executive Summary
- 2.1. Market Snapshot
- 3. Market Dynamics
- 3.1. Market Drivers
- 3.2. Market Restrains
- 3.3. Market Trends
- 3.4. Market Opportunities
- 4. Market Factor Analysis
- 4.1. Porters Five Forces
- 4.1.1. Bargaining Power of Suppliers
- 4.1.2. Bargaining Power of Buyers
- 4.1.3. Threat of New Entrants
- 4.1.4. Threat of Substitutes
- 4.1.5. Competitive Rivalry
- 4.2. PESTEL analysis
- 4.3. BCG Analysis
- 4.3.1. Stars (High Growth, High Market Share)
- 4.3.2. Cash Cows (Low Growth, High Market Share)
- 4.3.3. Question Mark (High Growth, Low Market Share)
- 4.3.4. Dogs (Low Growth, Low Market Share)
- 4.4. Ansoff Matrix Analysis
- 4.5. Supply Chain Analysis
- 4.6. Regulatory Landscape
- 4.7. Current Market Potential and Opportunity Assessment (TAM–SAM–SOM Framework)
- 4.8. MDP Analyst Note
- 4.1. Porters Five Forces
- 5. Market Analysis, Insights and Forecast 2021-2033
- 5.1. Market Analysis, Insights and Forecast - by Type
- 5.1.1. Graphite Anode
- 5.1.2. Graphite Block (Fine Carbon)
- 5.1.3. Other Types (Graphite Electrode, etc.)
- 5.2. Market Analysis, Insights and Forecast - by Application
- 5.2.1. Metallurgy
- 5.2.2. Parts and Components
- 5.2.3. Batteries
- 5.2.4. Nuclear
- 5.2.5. Other Applications
- 5.3. Market Analysis, Insights and Forecast - by Region
- 5.3.1. Asia Pacific
- 5.3.2. North America
- 5.3.3. Europe
- 5.3.4. South America
- 5.3.5. Middle East and Africa
- 5.1. Market Analysis, Insights and Forecast - by Type
- 6. Global Synthetic Graphite Market Analysis, Insights and Forecast, 2021-2033
- 6.1. Market Analysis, Insights and Forecast - by Type
- 6.1.1. Graphite Anode
- 6.1.2. Graphite Block (Fine Carbon)
- 6.1.3. Other Types (Graphite Electrode, etc.)
- 6.2. Market Analysis, Insights and Forecast - by Application
- 6.2.1. Metallurgy
- 6.2.2. Parts and Components
- 6.2.3. Batteries
- 6.2.4. Nuclear
- 6.2.5. Other Applications
- 6.1. Market Analysis, Insights and Forecast - by Type
- 7. Asia Pacific Synthetic Graphite Market Analysis, Insights and Forecast, 2020-2032
- 7.1. Market Analysis, Insights and Forecast - by Type
- 7.1.1. Graphite Anode
- 7.1.2. Graphite Block (Fine Carbon)
- 7.1.3. Other Types (Graphite Electrode, etc.)
- 7.2. Market Analysis, Insights and Forecast - by Application
- 7.2.1. Metallurgy
- 7.2.2. Parts and Components
- 7.2.3. Batteries
- 7.2.4. Nuclear
- 7.2.5. Other Applications
- 7.1. Market Analysis, Insights and Forecast - by Type
- 8. North America Synthetic Graphite Market Analysis, Insights and Forecast, 2020-2032
- 8.1. Market Analysis, Insights and Forecast - by Type
- 8.1.1. Graphite Anode
- 8.1.2. Graphite Block (Fine Carbon)
- 8.1.3. Other Types (Graphite Electrode, etc.)
- 8.2. Market Analysis, Insights and Forecast - by Application
- 8.2.1. Metallurgy
- 8.2.2. Parts and Components
- 8.2.3. Batteries
- 8.2.4. Nuclear
- 8.2.5. Other Applications
- 8.1. Market Analysis, Insights and Forecast - by Type
- 9. Europe Synthetic Graphite Market Analysis, Insights and Forecast, 2020-2032
- 9.1. Market Analysis, Insights and Forecast - by Type
- 9.1.1. Graphite Anode
- 9.1.2. Graphite Block (Fine Carbon)
- 9.1.3. Other Types (Graphite Electrode, etc.)
- 9.2. Market Analysis, Insights and Forecast - by Application
- 9.2.1. Metallurgy
- 9.2.2. Parts and Components
- 9.2.3. Batteries
- 9.2.4. Nuclear
- 9.2.5. Other Applications
- 9.1. Market Analysis, Insights and Forecast - by Type
- 10. South America Synthetic Graphite Market Analysis, Insights and Forecast, 2020-2032
- 10.1. Market Analysis, Insights and Forecast - by Type
- 10.1.1. Graphite Anode
- 10.1.2. Graphite Block (Fine Carbon)
- 10.1.3. Other Types (Graphite Electrode, etc.)
- 10.2. Market Analysis, Insights and Forecast - by Application
- 10.2.1. Metallurgy
- 10.2.2. Parts and Components
- 10.2.3. Batteries
- 10.2.4. Nuclear
- 10.2.5. Other Applications
- 10.1. Market Analysis, Insights and Forecast - by Type
- 11. Middle East and Africa Synthetic Graphite Market Analysis, Insights and Forecast, 2020-2032
- 11.1. Market Analysis, Insights and Forecast - by Type
- 11.1.1. Graphite Anode
- 11.1.2. Graphite Block (Fine Carbon)
- 11.1.3. Other Types (Graphite Electrode, etc.)
- 11.2. Market Analysis, Insights and Forecast - by Application
- 11.2.1. Metallurgy
- 11.2.2. Parts and Components
- 11.2.3. Batteries
- 11.2.4. Nuclear
- 11.2.5. Other Applications
- 11.1. Market Analysis, Insights and Forecast - by Type
- 12. Competitive Analysis
- 12.1. Company Profiles
- 12.1.1 Mersen Property
- 12.1.1.1. Company Overview
- 12.1.1.2. Products
- 12.1.1.3. Company Financials
- 12.1.1.4. SWOT Analysis
- 12.1.2 Asbury Carbons
- 12.1.2.1. Company Overview
- 12.1.2.2. Products
- 12.1.2.3. Company Financials
- 12.1.2.4. SWOT Analysis
- 12.1.3 Shenzhen Sinuo Industrial Development Co Ltd
- 12.1.3.1. Company Overview
- 12.1.3.2. Products
- 12.1.3.3. Company Financials
- 12.1.3.4. SWOT Analysis
- 12.1.4 Resonac Holdings Corporation (Showa Denko KK)
- 12.1.4.1. Company Overview
- 12.1.4.2. Products
- 12.1.4.3. Company Financials
- 12.1.4.4. SWOT Analysis
- 12.1.5 Shamokin Carbons
- 12.1.5.1. Company Overview
- 12.1.5.2. Products
- 12.1.5.3. Company Financials
- 12.1.5.4. SWOT Analysis
- 12.1.6 Mitsubishi Chemical Corporation
- 12.1.6.1. Company Overview
- 12.1.6.2. Products
- 12.1.6.3. Company Financials
- 12.1.6.4. SWOT Analysis
- 12.1.7 Nippon Carbon Co Ltd
- 12.1.7.1. Company Overview
- 12.1.7.2. Products
- 12.1.7.3. Company Financials
- 12.1.7.4. SWOT Analysis
- 12.1.8 Jiangxi Zichen Technology Co Ltd
- 12.1.8.1. Company Overview
- 12.1.8.2. Products
- 12.1.8.3. Company Financials
- 12.1.8.4. SWOT Analysis
- 12.1.9 Tokai Cobex GmbH
- 12.1.9.1. Company Overview
- 12.1.9.2. Products
- 12.1.9.3. Company Financials
- 12.1.9.4. SWOT Analysis
- 12.1.10 GrafTech International
- 12.1.10.1. Company Overview
- 12.1.10.2. Products
- 12.1.10.3. Company Financials
- 12.1.10.4. SWOT Analysis
- 12.1.11 BTR New Materials Group Co Ltd
- 12.1.11.1. Company Overview
- 12.1.11.2. Products
- 12.1.11.3. Company Financials
- 12.1.11.4. SWOT Analysis
- 12.1.12 Imerys
- 12.1.12.1. Company Overview
- 12.1.12.2. Products
- 12.1.12.3. Company Financials
- 12.1.12.4. SWOT Analysis
- 12.1.13 Shanghai Shanshan Technology Co Ltd
- 12.1.13.1. Company Overview
- 12.1.13.2. Products
- 12.1.13.3. Company Financials
- 12.1.13.4. SWOT Analysis
- 12.1.14 Graphit Kropfmhl GmbH
- 12.1.14.1. Company Overview
- 12.1.14.2. Products
- 12.1.14.3. Company Financials
- 12.1.14.4. SWOT Analysis
- 12.1.15 Graphite India Limited
- 12.1.15.1. Company Overview
- 12.1.15.2. Products
- 12.1.15.3. Company Financials
- 12.1.15.4. SWOT Analysis
- 12.1.16 Lianyungang Jinli Carbon Co Ltd
- 12.1.16.1. Company Overview
- 12.1.16.2. Products
- 12.1.16.3. Company Financials
- 12.1.16.4. SWOT Analysis
- 12.1.1 Mersen Property
- 12.2. Market Entropy
- 12.2.1 Company's Key Areas Served
- 12.2.2 Recent Developments
- 12.3. Company Market Share Analysis 2025
- 12.3.1 Top 5 Companies Market Share Analysis
- 12.3.2 Top 3 Companies Market Share Analysis
- 12.4. List of Potential Customers
- 13. Research Methodology
List of Figures
- Figure 1: Global Synthetic Graphite Market Revenue Breakdown (billion, %) by Region 2025 & 2033
- Figure 2: Global Synthetic Graphite Market Volume Breakdown (K Tons, %) by Region 2025 & 2033
- Figure 3: Asia Pacific Synthetic Graphite Market Revenue (billion), by Type 2025 & 2033
- Figure 4: Asia Pacific Synthetic Graphite Market Volume (K Tons), by Type 2025 & 2033
- Figure 5: Asia Pacific Synthetic Graphite Market Revenue Share (%), by Type 2025 & 2033
- Figure 6: Asia Pacific Synthetic Graphite Market Volume Share (%), by Type 2025 & 2033
- Figure 7: Asia Pacific Synthetic Graphite Market Revenue (billion), by Application 2025 & 2033
- Figure 8: Asia Pacific Synthetic Graphite Market Volume (K Tons), by Application 2025 & 2033
- Figure 9: Asia Pacific Synthetic Graphite Market Revenue Share (%), by Application 2025 & 2033
- Figure 10: Asia Pacific Synthetic Graphite Market Volume Share (%), by Application 2025 & 2033
- Figure 11: Asia Pacific Synthetic Graphite Market Revenue (billion), by Country 2025 & 2033
- Figure 12: Asia Pacific Synthetic Graphite Market Volume (K Tons), by Country 2025 & 2033
- Figure 13: Asia Pacific Synthetic Graphite Market Revenue Share (%), by Country 2025 & 2033
- Figure 14: Asia Pacific Synthetic Graphite Market Volume Share (%), by Country 2025 & 2033
- Figure 15: North America Synthetic Graphite Market Revenue (billion), by Type 2025 & 2033
- Figure 16: North America Synthetic Graphite Market Volume (K Tons), by Type 2025 & 2033
- Figure 17: North America Synthetic Graphite Market Revenue Share (%), by Type 2025 & 2033
- Figure 18: North America Synthetic Graphite Market Volume Share (%), by Type 2025 & 2033
- Figure 19: North America Synthetic Graphite Market Revenue (billion), by Application 2025 & 2033
- Figure 20: North America Synthetic Graphite Market Volume (K Tons), by Application 2025 & 2033
- Figure 21: North America Synthetic Graphite Market Revenue Share (%), by Application 2025 & 2033
- Figure 22: North America Synthetic Graphite Market Volume Share (%), by Application 2025 & 2033
- Figure 23: North America Synthetic Graphite Market Revenue (billion), by Country 2025 & 2033
- Figure 24: North America Synthetic Graphite Market Volume (K Tons), by Country 2025 & 2033
- Figure 25: North America Synthetic Graphite Market Revenue Share (%), by Country 2025 & 2033
- Figure 26: North America Synthetic Graphite Market Volume Share (%), by Country 2025 & 2033
- Figure 27: Europe Synthetic Graphite Market Revenue (billion), by Type 2025 & 2033
- Figure 28: Europe Synthetic Graphite Market Volume (K Tons), by Type 2025 & 2033
- Figure 29: Europe Synthetic Graphite Market Revenue Share (%), by Type 2025 & 2033
- Figure 30: Europe Synthetic Graphite Market Volume Share (%), by Type 2025 & 2033
- Figure 31: Europe Synthetic Graphite Market Revenue (billion), by Application 2025 & 2033
- Figure 32: Europe Synthetic Graphite Market Volume (K Tons), by Application 2025 & 2033
- Figure 33: Europe Synthetic Graphite Market Revenue Share (%), by Application 2025 & 2033
- Figure 34: Europe Synthetic Graphite Market Volume Share (%), by Application 2025 & 2033
- Figure 35: Europe Synthetic Graphite Market Revenue (billion), by Country 2025 & 2033
- Figure 36: Europe Synthetic Graphite Market Volume (K Tons), by Country 2025 & 2033
- Figure 37: Europe Synthetic Graphite Market Revenue Share (%), by Country 2025 & 2033
- Figure 38: Europe Synthetic Graphite Market Volume Share (%), by Country 2025 & 2033
- Figure 39: South America Synthetic Graphite Market Revenue (billion), by Type 2025 & 2033
- Figure 40: South America Synthetic Graphite Market Volume (K Tons), by Type 2025 & 2033
- Figure 41: South America Synthetic Graphite Market Revenue Share (%), by Type 2025 & 2033
- Figure 42: South America Synthetic Graphite Market Volume Share (%), by Type 2025 & 2033
- Figure 43: South America Synthetic Graphite Market Revenue (billion), by Application 2025 & 2033
- Figure 44: South America Synthetic Graphite Market Volume (K Tons), by Application 2025 & 2033
- Figure 45: South America Synthetic Graphite Market Revenue Share (%), by Application 2025 & 2033
- Figure 46: South America Synthetic Graphite Market Volume Share (%), by Application 2025 & 2033
- Figure 47: South America Synthetic Graphite Market Revenue (billion), by Country 2025 & 2033
- Figure 48: South America Synthetic Graphite Market Volume (K Tons), by Country 2025 & 2033
- Figure 49: South America Synthetic Graphite Market Revenue Share (%), by Country 2025 & 2033
- Figure 50: South America Synthetic Graphite Market Volume Share (%), by Country 2025 & 2033
- Figure 51: Middle East and Africa Synthetic Graphite Market Revenue (billion), by Type 2025 & 2033
- Figure 52: Middle East and Africa Synthetic Graphite Market Volume (K Tons), by Type 2025 & 2033
- Figure 53: Middle East and Africa Synthetic Graphite Market Revenue Share (%), by Type 2025 & 2033
- Figure 54: Middle East and Africa Synthetic Graphite Market Volume Share (%), by Type 2025 & 2033
- Figure 55: Middle East and Africa Synthetic Graphite Market Revenue (billion), by Application 2025 & 2033
- Figure 56: Middle East and Africa Synthetic Graphite Market Volume (K Tons), by Application 2025 & 2033
- Figure 57: Middle East and Africa Synthetic Graphite Market Revenue Share (%), by Application 2025 & 2033
- Figure 58: Middle East and Africa Synthetic Graphite Market Volume Share (%), by Application 2025 & 2033
- Figure 59: Middle East and Africa Synthetic Graphite Market Revenue (billion), by Country 2025 & 2033
- Figure 60: Middle East and Africa Synthetic Graphite Market Volume (K Tons), by Country 2025 & 2033
- Figure 61: Middle East and Africa Synthetic Graphite Market Revenue Share (%), by Country 2025 & 2033
- Figure 62: Middle East and Africa Synthetic Graphite Market Volume Share (%), by Country 2025 & 2033
List of Tables
- Table 1: Global Synthetic Graphite Market Revenue billion Forecast, by Type 2020 & 2033
- Table 2: Global Synthetic Graphite Market Volume K Tons Forecast, by Type 2020 & 2033
- Table 3: Global Synthetic Graphite Market Revenue billion Forecast, by Application 2020 & 2033
- Table 4: Global Synthetic Graphite Market Volume K Tons Forecast, by Application 2020 & 2033
- Table 5: Global Synthetic Graphite Market Revenue billion Forecast, by Region 2020 & 2033
- Table 6: Global Synthetic Graphite Market Volume K Tons Forecast, by Region 2020 & 2033
- Table 7: Global Synthetic Graphite Market Revenue billion Forecast, by Type 2020 & 2033
- Table 8: Global Synthetic Graphite Market Volume K Tons Forecast, by Type 2020 & 2033
- Table 9: Global Synthetic Graphite Market Revenue billion Forecast, by Application 2020 & 2033
- Table 10: Global Synthetic Graphite Market Volume K Tons Forecast, by Application 2020 & 2033
- Table 11: Global Synthetic Graphite Market Revenue billion Forecast, by Country 2020 & 2033
- Table 12: Global Synthetic Graphite Market Volume K Tons Forecast, by Country 2020 & 2033
- Table 13: China Synthetic Graphite Market Revenue (billion) Forecast, by Application 2020 & 2033
- Table 14: China Synthetic Graphite Market Volume (K Tons) Forecast, by Application 2020 & 2033
- Table 15: India Synthetic Graphite Market Revenue (billion) Forecast, by Application 2020 & 2033
- Table 16: India Synthetic Graphite Market Volume (K Tons) Forecast, by Application 2020 & 2033
- Table 17: Japan Synthetic Graphite Market Revenue (billion) Forecast, by Application 2020 & 2033
- Table 18: Japan Synthetic Graphite Market Volume (K Tons) Forecast, by Application 2020 & 2033
- Table 19: South Korea Synthetic Graphite Market Revenue (billion) Forecast, by Application 2020 & 2033
- Table 20: South Korea Synthetic Graphite Market Volume (K Tons) Forecast, by Application 2020 & 2033
- Table 21: Asean Countries Synthetic Graphite Market Revenue (billion) Forecast, by Application 2020 & 2033
- Table 22: Asean Countries Synthetic Graphite Market Volume (K Tons) Forecast, by Application 2020 & 2033
- Table 23: Rest of Asia Pacific Synthetic Graphite Market Revenue (billion) Forecast, by Application 2020 & 2033
- Table 24: Rest of Asia Pacific Synthetic Graphite Market Volume (K Tons) Forecast, by Application 2020 & 2033
- Table 25: Global Synthetic Graphite Market Revenue billion Forecast, by Type 2020 & 2033
- Table 26: Global Synthetic Graphite Market Volume K Tons Forecast, by Type 2020 & 2033
- Table 27: Global Synthetic Graphite Market Revenue billion Forecast, by Application 2020 & 2033
- Table 28: Global Synthetic Graphite Market Volume K Tons Forecast, by Application 2020 & 2033
- Table 29: Global Synthetic Graphite Market Revenue billion Forecast, by Country 2020 & 2033
- Table 30: Global Synthetic Graphite Market Volume K Tons Forecast, by Country 2020 & 2033
- Table 31: United States Synthetic Graphite Market Revenue (billion) Forecast, by Application 2020 & 2033
- Table 32: United States Synthetic Graphite Market Volume (K Tons) Forecast, by Application 2020 & 2033
- Table 33: Canada Synthetic Graphite Market Revenue (billion) Forecast, by Application 2020 & 2033
- Table 34: Canada Synthetic Graphite Market Volume (K Tons) Forecast, by Application 2020 & 2033
- Table 35: Mexico Synthetic Graphite Market Revenue (billion) Forecast, by Application 2020 & 2033
- Table 36: Mexico Synthetic Graphite Market Volume (K Tons) Forecast, by Application 2020 & 2033
- Table 37: Global Synthetic Graphite Market Revenue billion Forecast, by Type 2020 & 2033
- Table 38: Global Synthetic Graphite Market Volume K Tons Forecast, by Type 2020 & 2033
- Table 39: Global Synthetic Graphite Market Revenue billion Forecast, by Application 2020 & 2033
- Table 40: Global Synthetic Graphite Market Volume K Tons Forecast, by Application 2020 & 2033
- Table 41: Global Synthetic Graphite Market Revenue billion Forecast, by Country 2020 & 2033
- Table 42: Global Synthetic Graphite Market Volume K Tons Forecast, by Country 2020 & 2033
- Table 43: Germany Synthetic Graphite Market Revenue (billion) Forecast, by Application 2020 & 2033
- Table 44: Germany Synthetic Graphite Market Volume (K Tons) Forecast, by Application 2020 & 2033
- Table 45: United Kingdom Synthetic Graphite Market Revenue (billion) Forecast, by Application 2020 & 2033
- Table 46: United Kingdom Synthetic Graphite Market Volume (K Tons) Forecast, by Application 2020 & 2033
- Table 47: Italy Synthetic Graphite Market Revenue (billion) Forecast, by Application 2020 & 2033
- Table 48: Italy Synthetic Graphite Market Volume (K Tons) Forecast, by Application 2020 & 2033
- Table 49: France Synthetic Graphite Market Revenue (billion) Forecast, by Application 2020 & 2033
- Table 50: France Synthetic Graphite Market Volume (K Tons) Forecast, by Application 2020 & 2033
- Table 51: Russia Synthetic Graphite Market Revenue (billion) Forecast, by Application 2020 & 2033
- Table 52: Russia Synthetic Graphite Market Volume (K Tons) Forecast, by Application 2020 & 2033
- Table 53: Rest of Europe Synthetic Graphite Market Revenue (billion) Forecast, by Application 2020 & 2033
- Table 54: Rest of Europe Synthetic Graphite Market Volume (K Tons) Forecast, by Application 2020 & 2033
- Table 55: Global Synthetic Graphite Market Revenue billion Forecast, by Type 2020 & 2033
- Table 56: Global Synthetic Graphite Market Volume K Tons Forecast, by Type 2020 & 2033
- Table 57: Global Synthetic Graphite Market Revenue billion Forecast, by Application 2020 & 2033
- Table 58: Global Synthetic Graphite Market Volume K Tons Forecast, by Application 2020 & 2033
- Table 59: Global Synthetic Graphite Market Revenue billion Forecast, by Country 2020 & 2033
- Table 60: Global Synthetic Graphite Market Volume K Tons Forecast, by Country 2020 & 2033
- Table 61: Brazil Synthetic Graphite Market Revenue (billion) Forecast, by Application 2020 & 2033
- Table 62: Brazil Synthetic Graphite Market Volume (K Tons) Forecast, by Application 2020 & 2033
- Table 63: Argentina Synthetic Graphite Market Revenue (billion) Forecast, by Application 2020 & 2033
- Table 64: Argentina Synthetic Graphite Market Volume (K Tons) Forecast, by Application 2020 & 2033
- Table 65: Rest of South America Synthetic Graphite Market Revenue (billion) Forecast, by Application 2020 & 2033
- Table 66: Rest of South America Synthetic Graphite Market Volume (K Tons) Forecast, by Application 2020 & 2033
- Table 67: Global Synthetic Graphite Market Revenue billion Forecast, by Type 2020 & 2033
- Table 68: Global Synthetic Graphite Market Volume K Tons Forecast, by Type 2020 & 2033
- Table 69: Global Synthetic Graphite Market Revenue billion Forecast, by Application 2020 & 2033
- Table 70: Global Synthetic Graphite Market Volume K Tons Forecast, by Application 2020 & 2033
- Table 71: Global Synthetic Graphite Market Revenue billion Forecast, by Country 2020 & 2033
- Table 72: Global Synthetic Graphite Market Volume K Tons Forecast, by Country 2020 & 2033
- Table 73: Saudi Arabia Synthetic Graphite Market Revenue (billion) Forecast, by Application 2020 & 2033
- Table 74: Saudi Arabia Synthetic Graphite Market Volume (K Tons) Forecast, by Application 2020 & 2033
- Table 75: South Africa Synthetic Graphite Market Revenue (billion) Forecast, by Application 2020 & 2033
- Table 76: South Africa Synthetic Graphite Market Volume (K Tons) Forecast, by Application 2020 & 2033
- Table 77: Rest of Middle East and Africa Synthetic Graphite Market Revenue (billion) Forecast, by Application 2020 & 2033
- Table 78: Rest of Middle East and Africa Synthetic Graphite Market Volume (K Tons) Forecast, by Application 2020 & 2033
Frequently Asked Questions
1. What is the projected Compound Annual Growth Rate (CAGR) of the Synthetic Graphite Market?
The projected CAGR is approximately 15.1%.
2. Which companies are prominent players in the Synthetic Graphite Market?
Key companies in the market include Mersen Property, Asbury Carbons, Shenzhen Sinuo Industrial Development Co Ltd, Resonac Holdings Corporation (Showa Denko KK), Shamokin Carbons, Mitsubishi Chemical Corporation, Nippon Carbon Co Ltd, Jiangxi Zichen Technology Co Ltd, Tokai Cobex GmbH, GrafTech International, BTR New Materials Group Co Ltd, Imerys, Shanghai Shanshan Technology Co Ltd, Graphit Kropfmhl GmbH, Graphite India Limited, Lianyungang Jinli Carbon Co Ltd.
3. What are the main segments of the Synthetic Graphite Market?
The market segments include Type, Application.
4. Can you provide details about the market size?
The market size is estimated to be USD 15.67 billion as of 2022.
5. What are some drivers contributing to market growth?
Increasing Demand for Electric Vehicles; Growing Utilization of Electric ARC Furnace Process for Steel Production.
6. What are the notable trends driving market growth?
Metallurgy Segment to Drive the Market.
7. Are there any restraints impacting market growth?
Stringent Environmental Regulations; Decreasing Production of Steel.
8. Can you provide examples of recent developments in the market?
October 2022: Imerys Imerys Graphite & Carbon Company announced the launch of a landmark lithium exploitation project ('the EMILI Project'). It may significantly reduce the need to import lithium and aid in producing nearly 700,000 electric vehicle batteries annually.
9. What pricing options are available for accessing the report?
Pricing options include single-user, multi-user, and enterprise licenses priced at USD 4750, USD 5250, and USD 8750 respectively.
10. Is the market size provided in terms of value or volume?
The market size is provided in terms of value, measured in billion and volume, measured in K Tons.
11. Are there any specific market keywords associated with the report?
Yes, the market keyword associated with the report is "Synthetic Graphite Market," which aids in identifying and referencing the specific market segment covered.
12. How do I determine which pricing option suits my needs best?
The pricing options vary based on user requirements and access needs. Individual users may opt for single-user licenses, while businesses requiring broader access may choose multi-user or enterprise licenses for cost-effective access to the report.
13. Are there any additional resources or data provided in the Synthetic Graphite Market report?
While the report offers comprehensive insights, it's advisable to review the specific contents or supplementary materials provided to ascertain if additional resources or data are available.
14. How can I stay updated on further developments or reports in the Synthetic Graphite Market?
To stay informed about further developments, trends, and reports in the Synthetic Graphite Market, consider subscribing to industry newsletters, following relevant companies and organizations, or regularly checking reputable industry news sources and publications.
Methodology
Step 1 - Identification of Relevant Samples Size from Population Database


Step 2 - Approaches for Defining Global Market Size (Value, Volume* & Price*)

Note*: In applicable scenarios
Step 3 - Data Sources
Primary Research
- Web Analytics
- Survey Reports
- Research Institute
- Latest Research Reports
- Opinion Leaders
Secondary Research
- Annual Reports
- White Paper
- Latest Press Release
- Industry Association
- Paid Database
- Investor Presentations

Step 4 - Data Triangulation
Involves using different sources of information in order to increase the validity of a study
These sources are likely to be stakeholders in a program - participants, other researchers, program staff, other community members, and so on.
Then we put all data in single framework & apply various statistical tools to find out the dynamic on the market.
During the analysis stage, feedback from the stakeholder groups would be compared to determine areas of agreement as well as areas of divergence