

Key Insights
The global synthetic diamond market is poised for substantial expansion, driven by escalating demand across diverse industrial and consumer sectors. With a projected Compound Annual Growth Rate (CAGR) of 2.7%, the market is estimated to reach $42.74 billion by the base year of 2025. Key growth catalysts include the jewelry industry's increasing preference for lab-grown diamonds as ethical and sustainable alternatives. Concurrently, expanding industrial applications in cutting tools, electronics, and medical devices further bolster market growth. Innovations in manufacturing technologies, such as High Pressure High Temperature (HPHT) and Chemical Vapor Deposition (CVD), are enabling the production of high-quality synthetic diamonds at competitive price points, thereby stimulating market penetration. While challenges like raw material price volatility and competition from natural diamonds exist, the market demonstrates a strong upward trajectory. Market segmentation by product type (polished and rough) and manufacturing process highlights opportunities for niche players. Geographically, North America, Europe, and Asia Pacific represent significant market shares, each exhibiting distinct growth patterns influenced by regional economic factors and adoption rates.
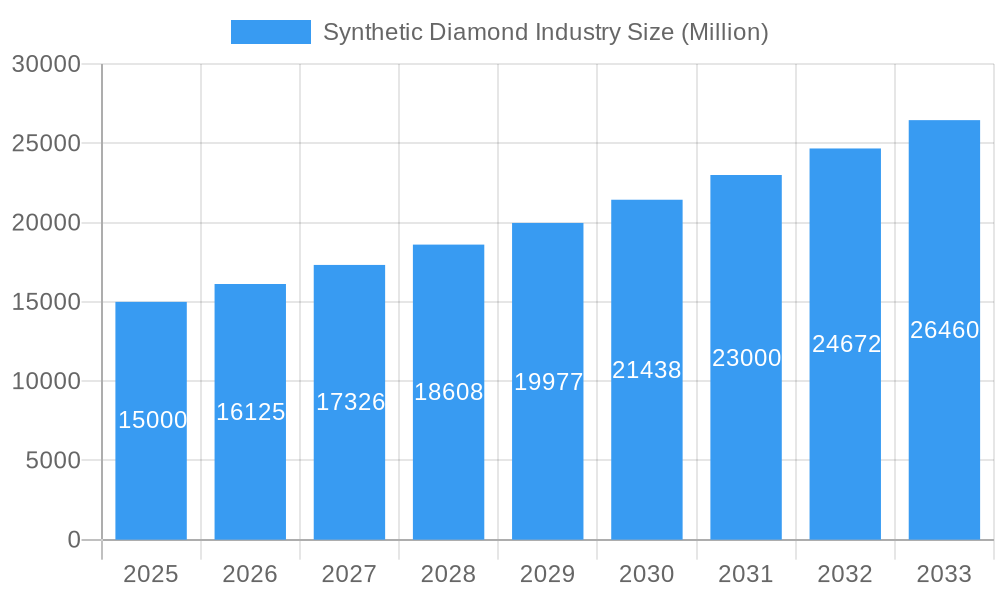
Synthetic Diamond Industry Market Size (In Billion)
The competitive environment features a blend of established industry leaders and emerging enterprises. Prominent companies actively contribute to market dynamics, each capitalizing on distinct market segments. Future market expansion will be critically dependent on continuous technological innovation, the capacity to meet surging demand, and effective marketing strategies to highlight the benefits of synthetic diamonds. Ongoing research and development focused on enhancing the quality, size, and production efficiency of synthetic diamonds are anticipated to reinforce this positive growth trend. Strategic collaborations and industry consolidations are expected to further solidify market positions and foster innovation, paving the way for a more sophisticated and diversified market landscape.
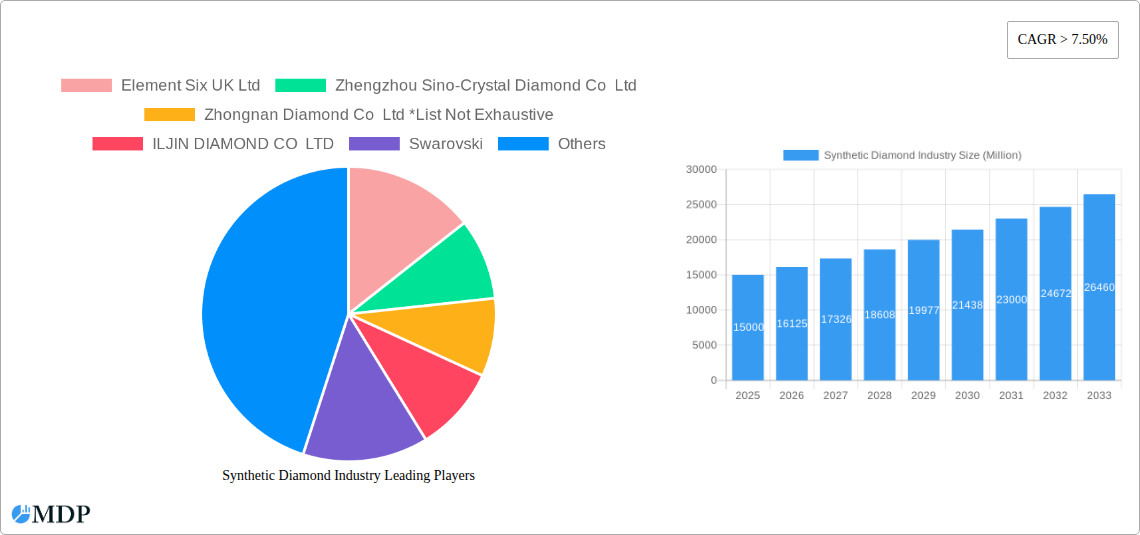
Synthetic Diamond Industry Company Market Share
Synthetic Diamond Industry Market Report: 2019-2033
Dive deep into the burgeoning synthetic diamond market with this comprehensive report, projecting a xx Million USD valuation by 2033. This in-depth analysis covers market dynamics, leading players like Element Six UK Ltd, and emerging trends shaping this high-growth sector. Ideal for investors, industry stakeholders, and strategic planners, this report provides actionable insights to navigate the complexities and capitalize on opportunities within the synthetic diamond industry.
Synthetic Diamond Industry Market Dynamics & Concentration
The global synthetic diamond market, valued at xx Million USD in 2024, exhibits a moderately concentrated structure. Key players like Element Six UK Ltd, Zhengzhou Sino-Crystal Diamond Co Ltd, and Zhongnan Diamond Co Ltd hold significant market share, though the landscape is dynamic due to ongoing innovation and new entrants. The market is driven by advancements in High Pressure, High Temperature (HPHT) and Chemical Vapor Deposition (CVD) manufacturing processes, leading to improved quality and reduced costs. Stringent environmental regulations regarding mined diamonds are further bolstering demand for synthetic alternatives. Product substitution from other gemstones is minimal, given the synthetic diamond's superior properties like hardness and brilliance. End-user trends show increasing demand across industrial applications and jewelry, contributing to market growth. M&A activity, such as the collaboration between Element Six UK Ltd and II-VI Inc. in 2022, signals strategic positioning and consolidation within the industry.
- Market Concentration: Moderately concentrated, with top 5 players holding approximately xx% market share in 2024.
- Innovation Drivers: Advancements in HPHT and CVD processes, material science breakthroughs.
- Regulatory Frameworks: Favorable regulations promoting sustainable alternatives to mined diamonds.
- Product Substitutes: Minimal threat from other gemstones due to superior properties.
- End-User Trends: Growing demand in industrial applications (e.g., cutting tools, electronics) and jewelry.
- M&A Activity: xx M&A deals recorded between 2019 and 2024, indicating industry consolidation.
Synthetic Diamond Industry Industry Trends & Analysis
The synthetic diamond market is experiencing robust growth, projected to reach xx Million USD by 2033, with a CAGR of xx% during the forecast period (2025-2033). This growth is primarily fueled by technological advancements leading to higher-quality, more cost-effective production. Consumer preferences are shifting towards ethically sourced and environmentally friendly alternatives to mined diamonds, further driving market penetration. The increasing adoption of synthetic diamonds in various industrial applications, such as semiconductors and cutting tools, is also a major growth catalyst. However, competitive dynamics remain intense, with established players and new entrants vying for market share. Price fluctuations in raw materials and technological disruptions could potentially impact the market's trajectory. Overall, the market outlook remains optimistic, with projections indicating continued strong growth driven by technological advancements, increasing consumer demand, and expanding industrial applications.
Leading Markets & Segments in Synthetic Diamond Industry
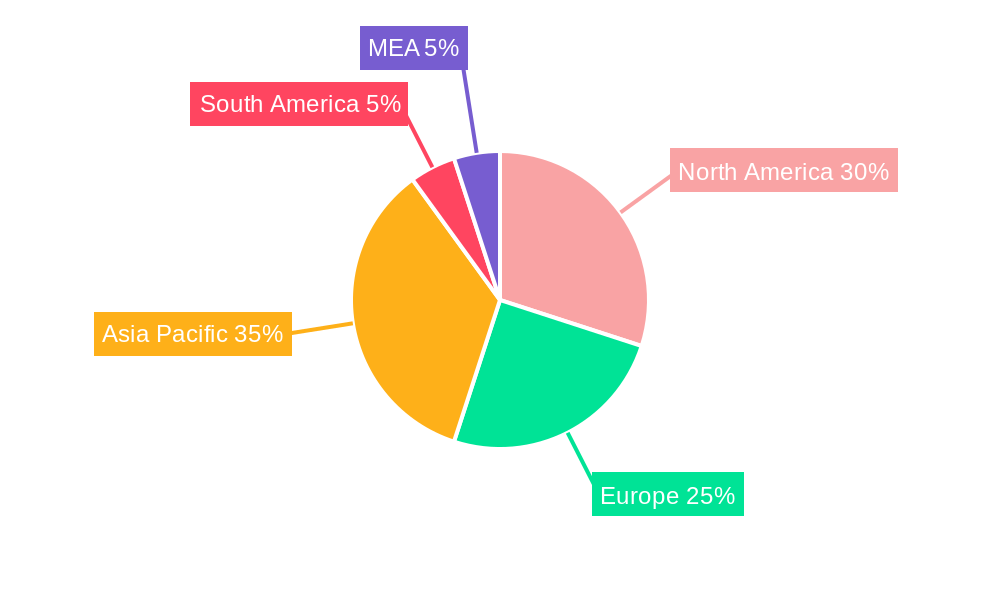
The Asia-Pacific region is currently the dominant market for synthetic diamonds, driven by strong economic growth, expanding industrial sectors, and rising consumer spending. China and India are key contributors to this regional dominance. Within the segments:
- Type: Polished synthetic diamonds represent the largest segment due to high demand in the jewelry industry.
- Other Polished Types: The rough diamond segment contributes significantly to the overall market value and is crucial for the supply chain.
- Manufacturing Process: Both HPHT and CVD methods contribute significantly, with CVD showing a higher growth trajectory due to its ability to produce higher-quality diamonds with specific properties.
Key Drivers for Asia-Pacific Dominance:
- Rapid economic growth and industrialization.
- Significant investments in infrastructure and manufacturing.
- Growing middle class with increasing disposable income.
- Favorable government policies supporting industrial development.
Synthetic Diamond Industry Product Developments
Recent years have witnessed significant innovation in synthetic diamond production, with a focus on enhancing quality, controlling specific properties, and expanding applications. Advances in CVD technology have enabled the creation of diamonds with unique characteristics for specialized uses in electronics and quantum technologies. New applications are constantly emerging, expanding the market potential beyond traditional uses in jewelry and industrial tools. Companies are increasingly focusing on differentiation through unique material properties, superior quality, and sustainable manufacturing practices to gain a competitive edge.
Key Drivers of Synthetic Diamond Industry Growth
The synthetic diamond market's growth is propelled by several key factors:
- Technological Advancements: Improved HPHT and CVD processes yield higher-quality, more cost-effective diamonds.
- Economic Growth: Rising disposable incomes in emerging economies boost demand for luxury goods, including diamond jewelry.
- Ethical Concerns: Growing consumer awareness of ethical sourcing drives demand for conflict-free synthetic diamonds.
- Industrial Applications: Expansion into diverse sectors like electronics, cutting tools, and medical devices broadens market reach.
Challenges in the Synthetic Diamond Industry Market
Despite promising growth, the synthetic diamond market faces certain challenges:
- Price Volatility: Fluctuations in raw material costs and energy prices can impact production costs and profitability.
- Intense Competition: The market is becoming increasingly competitive with new players entering the market.
- Technological Disruptions: Rapid technological change necessitates continuous investment in R&D to remain competitive.
- Supply Chain Disruptions: Global events can impact the availability of raw materials and affect production.
Emerging Opportunities in Synthetic Diamond Industry
The synthetic diamond market offers exciting long-term opportunities. Technological advancements in quantum computing and other high-tech fields are creating new, high-value applications for synthetic diamonds. Strategic partnerships, such as the one between Element Six UK Ltd and II-VI Inc., are fostering innovation and market expansion. Further market penetration in emerging economies and the expansion of industrial applications will drive growth in the coming years.
Leading Players in the Synthetic Diamond Industry Sector
- Element Six UK Ltd
- Zhengzhou Sino-Crystal Diamond Co Ltd
- Zhongnan Diamond Co Ltd
- ILJIN DIAMOND CO LTD
- Swarovski
- New Diamond Technology
- Pure Grown Diamonds (PGD)
- Applied Diamond Inc
- Henan Huanghe Whirlwind Co Ltd
- Sumitomo Electric Industries Ltd
- Adamas One Corp
Key Milestones in Synthetic Diamond Industry Industry
- July 2021: Element Six UK LTD and the University of Warwick partnered to develop next-generation synthetic diamond technologies. This collaboration boosted R&D and accelerated innovation.
- February 2022: Element Six UK Ltd's collaboration with II-VI Inc. to produce high-quality single-crystal diamonds broadened the applications of synthetic diamonds and signaled industry consolidation.
Strategic Outlook for Synthetic Diamond Industry Market
The future of the synthetic diamond industry looks bright, with substantial growth potential driven by technological innovation and expanding applications. Strategic partnerships, investments in R&D, and focus on sustainable manufacturing practices will be crucial for success. Companies that can effectively leverage technological advancements and cater to evolving consumer preferences are poised to capture significant market share in the coming years. The market is expected to continue its robust growth trajectory, driven by strong demand from both the jewelry and industrial sectors.
Synthetic Diamond Industry Segmentation
-
1. Type
-
1.1. Polished
- 1.1.1. Jewelry
- 1.1.2. Electronics
- 1.1.3. Healthcare
- 1.1.4. Other Polished Types
-
1.2. Rough
- 1.2.1. Construction
- 1.2.2. Mining
- 1.2.3. Oil and Gas
- 1.2.4. Other Rough Types
-
1.1. Polished
-
2. Manufacturing Process
- 2.1. High Pressure, High Temperature (HPHT)
- 2.2. Chemical Vapor Deposition (CVD)
Synthetic Diamond Industry Segmentation By Geography
-
1. Asia Pacific
- 1.1. China
- 1.2. India
- 1.3. Japan
- 1.4. ASEAN Countries
- 1.5. Rest of Asia Pacific
-
2. North America
- 2.1. United States
- 2.2. Rest of North America
-
3. Europe
- 3.1. Germany
- 3.2. France
- 3.3. United Kingdom
- 3.4. Italy
- 3.5. Spain
- 3.6. Rest of Europe
-
4. South America
- 4.1. Brazil
- 4.2. Rest of South America
-
5. Middle East and Africa
- 5.1. GCC Countries
- 5.2. South Africa
- 5.3. Rest of Middle East and Africa
Synthetic Diamond Industry Regional Market Share
Geographic Coverage of Synthetic Diamond Industry
Synthetic Diamond Industry REPORT HIGHLIGHTS
| Aspects | Details |
|---|---|
| Study Period | 2020-2034 |
| Base Year | 2025 |
| Estimated Year | 2026 |
| Forecast Period | 2026-2034 |
| Historical Period | 2020-2025 |
| Growth Rate | CAGR of 2.7% from 2020-2034 |
| Segmentation |
|
Table of Contents
- 1. Introduction
- 1.1. Research Scope
- 1.2. Market Segmentation
- 1.3. Research Objective
- 1.4. Definitions and Assumptions
- 2. Executive Summary
- 2.1. Market Snapshot
- 3. Market Dynamics
- 3.1. Market Drivers
- 3.2. Market Restrains
- 3.3. Market Trends
- 3.4. Market Opportunities
- 4. Market Factor Analysis
- 4.1. Porters Five Forces
- 4.1.1. Bargaining Power of Suppliers
- 4.1.2. Bargaining Power of Buyers
- 4.1.3. Threat of New Entrants
- 4.1.4. Threat of Substitutes
- 4.1.5. Competitive Rivalry
- 4.2. PESTEL analysis
- 4.3. BCG Analysis
- 4.3.1. Stars (High Growth, High Market Share)
- 4.3.2. Cash Cows (Low Growth, High Market Share)
- 4.3.3. Question Mark (High Growth, Low Market Share)
- 4.3.4. Dogs (Low Growth, Low Market Share)
- 4.4. Ansoff Matrix Analysis
- 4.5. Supply Chain Analysis
- 4.6. Regulatory Landscape
- 4.7. Current Market Potential and Opportunity Assessment (TAM–SAM–SOM Framework)
- 4.8. MDP Analyst Note
- 4.1. Porters Five Forces
- 5. Market Analysis, Insights and Forecast 2021-2033
- 5.1. Market Analysis, Insights and Forecast - by Type
- 5.1.1. Polished
- 5.1.1.1. Jewelry
- 5.1.1.2. Electronics
- 5.1.1.3. Healthcare
- 5.1.1.4. Other Polished Types
- 5.1.2. Rough
- 5.1.2.1. Construction
- 5.1.2.2. Mining
- 5.1.2.3. Oil and Gas
- 5.1.2.4. Other Rough Types
- 5.1.1. Polished
- 5.2. Market Analysis, Insights and Forecast - by Manufacturing Process
- 5.2.1. High Pressure, High Temperature (HPHT)
- 5.2.2. Chemical Vapor Deposition (CVD)
- 5.3. Market Analysis, Insights and Forecast - by Region
- 5.3.1. Asia Pacific
- 5.3.2. North America
- 5.3.3. Europe
- 5.3.4. South America
- 5.3.5. Middle East and Africa
- 5.1. Market Analysis, Insights and Forecast - by Type
- 6. Global Synthetic Diamond Industry Analysis, Insights and Forecast, 2021-2033
- 6.1. Market Analysis, Insights and Forecast - by Type
- 6.1.1. Polished
- 6.1.1.1. Jewelry
- 6.1.1.2. Electronics
- 6.1.1.3. Healthcare
- 6.1.1.4. Other Polished Types
- 6.1.2. Rough
- 6.1.2.1. Construction
- 6.1.2.2. Mining
- 6.1.2.3. Oil and Gas
- 6.1.2.4. Other Rough Types
- 6.1.1. Polished
- 6.2. Market Analysis, Insights and Forecast - by Manufacturing Process
- 6.2.1. High Pressure, High Temperature (HPHT)
- 6.2.2. Chemical Vapor Deposition (CVD)
- 6.1. Market Analysis, Insights and Forecast - by Type
- 7. Asia Pacific Synthetic Diamond Industry Analysis, Insights and Forecast, 2020-2032
- 7.1. Market Analysis, Insights and Forecast - by Type
- 7.1.1. Polished
- 7.1.1.1. Jewelry
- 7.1.1.2. Electronics
- 7.1.1.3. Healthcare
- 7.1.1.4. Other Polished Types
- 7.1.2. Rough
- 7.1.2.1. Construction
- 7.1.2.2. Mining
- 7.1.2.3. Oil and Gas
- 7.1.2.4. Other Rough Types
- 7.1.1. Polished
- 7.2. Market Analysis, Insights and Forecast - by Manufacturing Process
- 7.2.1. High Pressure, High Temperature (HPHT)
- 7.2.2. Chemical Vapor Deposition (CVD)
- 7.1. Market Analysis, Insights and Forecast - by Type
- 8. North America Synthetic Diamond Industry Analysis, Insights and Forecast, 2020-2032
- 8.1. Market Analysis, Insights and Forecast - by Type
- 8.1.1. Polished
- 8.1.1.1. Jewelry
- 8.1.1.2. Electronics
- 8.1.1.3. Healthcare
- 8.1.1.4. Other Polished Types
- 8.1.2. Rough
- 8.1.2.1. Construction
- 8.1.2.2. Mining
- 8.1.2.3. Oil and Gas
- 8.1.2.4. Other Rough Types
- 8.1.1. Polished
- 8.2. Market Analysis, Insights and Forecast - by Manufacturing Process
- 8.2.1. High Pressure, High Temperature (HPHT)
- 8.2.2. Chemical Vapor Deposition (CVD)
- 8.1. Market Analysis, Insights and Forecast - by Type
- 9. Europe Synthetic Diamond Industry Analysis, Insights and Forecast, 2020-2032
- 9.1. Market Analysis, Insights and Forecast - by Type
- 9.1.1. Polished
- 9.1.1.1. Jewelry
- 9.1.1.2. Electronics
- 9.1.1.3. Healthcare
- 9.1.1.4. Other Polished Types
- 9.1.2. Rough
- 9.1.2.1. Construction
- 9.1.2.2. Mining
- 9.1.2.3. Oil and Gas
- 9.1.2.4. Other Rough Types
- 9.1.1. Polished
- 9.2. Market Analysis, Insights and Forecast - by Manufacturing Process
- 9.2.1. High Pressure, High Temperature (HPHT)
- 9.2.2. Chemical Vapor Deposition (CVD)
- 9.1. Market Analysis, Insights and Forecast - by Type
- 10. South America Synthetic Diamond Industry Analysis, Insights and Forecast, 2020-2032
- 10.1. Market Analysis, Insights and Forecast - by Type
- 10.1.1. Polished
- 10.1.1.1. Jewelry
- 10.1.1.2. Electronics
- 10.1.1.3. Healthcare
- 10.1.1.4. Other Polished Types
- 10.1.2. Rough
- 10.1.2.1. Construction
- 10.1.2.2. Mining
- 10.1.2.3. Oil and Gas
- 10.1.2.4. Other Rough Types
- 10.1.1. Polished
- 10.2. Market Analysis, Insights and Forecast - by Manufacturing Process
- 10.2.1. High Pressure, High Temperature (HPHT)
- 10.2.2. Chemical Vapor Deposition (CVD)
- 10.1. Market Analysis, Insights and Forecast - by Type
- 11. Middle East and Africa Synthetic Diamond Industry Analysis, Insights and Forecast, 2020-2032
- 11.1. Market Analysis, Insights and Forecast - by Type
- 11.1.1. Polished
- 11.1.1.1. Jewelry
- 11.1.1.2. Electronics
- 11.1.1.3. Healthcare
- 11.1.1.4. Other Polished Types
- 11.1.2. Rough
- 11.1.2.1. Construction
- 11.1.2.2. Mining
- 11.1.2.3. Oil and Gas
- 11.1.2.4. Other Rough Types
- 11.1.1. Polished
- 11.2. Market Analysis, Insights and Forecast - by Manufacturing Process
- 11.2.1. High Pressure, High Temperature (HPHT)
- 11.2.2. Chemical Vapor Deposition (CVD)
- 11.1. Market Analysis, Insights and Forecast - by Type
- 12. Competitive Analysis
- 12.1. Company Profiles
- 12.1.1 Element Six UK Ltd
- 12.1.1.1. Company Overview
- 12.1.1.2. Products
- 12.1.1.3. Company Financials
- 12.1.1.4. SWOT Analysis
- 12.1.2 Zhengzhou Sino-Crystal Diamond Co Ltd
- 12.1.2.1. Company Overview
- 12.1.2.2. Products
- 12.1.2.3. Company Financials
- 12.1.2.4. SWOT Analysis
- 12.1.3 Zhongnan Diamond Co Ltd *List Not Exhaustive
- 12.1.3.1. Company Overview
- 12.1.3.2. Products
- 12.1.3.3. Company Financials
- 12.1.3.4. SWOT Analysis
- 12.1.4 ILJIN DIAMOND CO LTD
- 12.1.4.1. Company Overview
- 12.1.4.2. Products
- 12.1.4.3. Company Financials
- 12.1.4.4. SWOT Analysis
- 12.1.5 Swarovski
- 12.1.5.1. Company Overview
- 12.1.5.2. Products
- 12.1.5.3. Company Financials
- 12.1.5.4. SWOT Analysis
- 12.1.6 New Diamond Technology
- 12.1.6.1. Company Overview
- 12.1.6.2. Products
- 12.1.6.3. Company Financials
- 12.1.6.4. SWOT Analysis
- 12.1.7 Pure Grown Diamonds (PGD)
- 12.1.7.1. Company Overview
- 12.1.7.2. Products
- 12.1.7.3. Company Financials
- 12.1.7.4. SWOT Analysis
- 12.1.8 Applied Diamond Inc
- 12.1.8.1. Company Overview
- 12.1.8.2. Products
- 12.1.8.3. Company Financials
- 12.1.8.4. SWOT Analysis
- 12.1.9 Henan Huanghe Whirlwind Co Ltd
- 12.1.9.1. Company Overview
- 12.1.9.2. Products
- 12.1.9.3. Company Financials
- 12.1.9.4. SWOT Analysis
- 12.1.10 Sumitomo Electric Industries Ltd
- 12.1.10.1. Company Overview
- 12.1.10.2. Products
- 12.1.10.3. Company Financials
- 12.1.10.4. SWOT Analysis
- 12.1.11 Adamas One Corp
- 12.1.11.1. Company Overview
- 12.1.11.2. Products
- 12.1.11.3. Company Financials
- 12.1.11.4. SWOT Analysis
- 12.1.1 Element Six UK Ltd
- 12.2. Market Entropy
- 12.2.1 Company's Key Areas Served
- 12.2.2 Recent Developments
- 12.3. Company Market Share Analysis 2025
- 12.3.1 Top 5 Companies Market Share Analysis
- 12.3.2 Top 3 Companies Market Share Analysis
- 12.4. List of Potential Customers
- 13. Research Methodology
List of Figures
- Figure 1: Global Synthetic Diamond Industry Revenue Breakdown (billion, %) by Region 2025 & 2033
- Figure 2: Asia Pacific Synthetic Diamond Industry Revenue (billion), by Type 2025 & 2033
- Figure 3: Asia Pacific Synthetic Diamond Industry Revenue Share (%), by Type 2025 & 2033
- Figure 4: Asia Pacific Synthetic Diamond Industry Revenue (billion), by Manufacturing Process 2025 & 2033
- Figure 5: Asia Pacific Synthetic Diamond Industry Revenue Share (%), by Manufacturing Process 2025 & 2033
- Figure 6: Asia Pacific Synthetic Diamond Industry Revenue (billion), by Country 2025 & 2033
- Figure 7: Asia Pacific Synthetic Diamond Industry Revenue Share (%), by Country 2025 & 2033
- Figure 8: North America Synthetic Diamond Industry Revenue (billion), by Type 2025 & 2033
- Figure 9: North America Synthetic Diamond Industry Revenue Share (%), by Type 2025 & 2033
- Figure 10: North America Synthetic Diamond Industry Revenue (billion), by Manufacturing Process 2025 & 2033
- Figure 11: North America Synthetic Diamond Industry Revenue Share (%), by Manufacturing Process 2025 & 2033
- Figure 12: North America Synthetic Diamond Industry Revenue (billion), by Country 2025 & 2033
- Figure 13: North America Synthetic Diamond Industry Revenue Share (%), by Country 2025 & 2033
- Figure 14: Europe Synthetic Diamond Industry Revenue (billion), by Type 2025 & 2033
- Figure 15: Europe Synthetic Diamond Industry Revenue Share (%), by Type 2025 & 2033
- Figure 16: Europe Synthetic Diamond Industry Revenue (billion), by Manufacturing Process 2025 & 2033
- Figure 17: Europe Synthetic Diamond Industry Revenue Share (%), by Manufacturing Process 2025 & 2033
- Figure 18: Europe Synthetic Diamond Industry Revenue (billion), by Country 2025 & 2033
- Figure 19: Europe Synthetic Diamond Industry Revenue Share (%), by Country 2025 & 2033
- Figure 20: South America Synthetic Diamond Industry Revenue (billion), by Type 2025 & 2033
- Figure 21: South America Synthetic Diamond Industry Revenue Share (%), by Type 2025 & 2033
- Figure 22: South America Synthetic Diamond Industry Revenue (billion), by Manufacturing Process 2025 & 2033
- Figure 23: South America Synthetic Diamond Industry Revenue Share (%), by Manufacturing Process 2025 & 2033
- Figure 24: South America Synthetic Diamond Industry Revenue (billion), by Country 2025 & 2033
- Figure 25: South America Synthetic Diamond Industry Revenue Share (%), by Country 2025 & 2033
- Figure 26: Middle East and Africa Synthetic Diamond Industry Revenue (billion), by Type 2025 & 2033
- Figure 27: Middle East and Africa Synthetic Diamond Industry Revenue Share (%), by Type 2025 & 2033
- Figure 28: Middle East and Africa Synthetic Diamond Industry Revenue (billion), by Manufacturing Process 2025 & 2033
- Figure 29: Middle East and Africa Synthetic Diamond Industry Revenue Share (%), by Manufacturing Process 2025 & 2033
- Figure 30: Middle East and Africa Synthetic Diamond Industry Revenue (billion), by Country 2025 & 2033
- Figure 31: Middle East and Africa Synthetic Diamond Industry Revenue Share (%), by Country 2025 & 2033
List of Tables
- Table 1: Global Synthetic Diamond Industry Revenue billion Forecast, by Type 2020 & 2033
- Table 2: Global Synthetic Diamond Industry Revenue billion Forecast, by Manufacturing Process 2020 & 2033
- Table 3: Global Synthetic Diamond Industry Revenue billion Forecast, by Region 2020 & 2033
- Table 4: Global Synthetic Diamond Industry Revenue billion Forecast, by Type 2020 & 2033
- Table 5: Global Synthetic Diamond Industry Revenue billion Forecast, by Manufacturing Process 2020 & 2033
- Table 6: Global Synthetic Diamond Industry Revenue billion Forecast, by Country 2020 & 2033
- Table 7: China Synthetic Diamond Industry Revenue (billion) Forecast, by Application 2020 & 2033
- Table 8: India Synthetic Diamond Industry Revenue (billion) Forecast, by Application 2020 & 2033
- Table 9: Japan Synthetic Diamond Industry Revenue (billion) Forecast, by Application 2020 & 2033
- Table 10: ASEAN Countries Synthetic Diamond Industry Revenue (billion) Forecast, by Application 2020 & 2033
- Table 11: Rest of Asia Pacific Synthetic Diamond Industry Revenue (billion) Forecast, by Application 2020 & 2033
- Table 12: Global Synthetic Diamond Industry Revenue billion Forecast, by Type 2020 & 2033
- Table 13: Global Synthetic Diamond Industry Revenue billion Forecast, by Manufacturing Process 2020 & 2033
- Table 14: Global Synthetic Diamond Industry Revenue billion Forecast, by Country 2020 & 2033
- Table 15: United States Synthetic Diamond Industry Revenue (billion) Forecast, by Application 2020 & 2033
- Table 16: Rest of North America Synthetic Diamond Industry Revenue (billion) Forecast, by Application 2020 & 2033
- Table 17: Global Synthetic Diamond Industry Revenue billion Forecast, by Type 2020 & 2033
- Table 18: Global Synthetic Diamond Industry Revenue billion Forecast, by Manufacturing Process 2020 & 2033
- Table 19: Global Synthetic Diamond Industry Revenue billion Forecast, by Country 2020 & 2033
- Table 20: Germany Synthetic Diamond Industry Revenue (billion) Forecast, by Application 2020 & 2033
- Table 21: France Synthetic Diamond Industry Revenue (billion) Forecast, by Application 2020 & 2033
- Table 22: United Kingdom Synthetic Diamond Industry Revenue (billion) Forecast, by Application 2020 & 2033
- Table 23: Italy Synthetic Diamond Industry Revenue (billion) Forecast, by Application 2020 & 2033
- Table 24: Spain Synthetic Diamond Industry Revenue (billion) Forecast, by Application 2020 & 2033
- Table 25: Rest of Europe Synthetic Diamond Industry Revenue (billion) Forecast, by Application 2020 & 2033
- Table 26: Global Synthetic Diamond Industry Revenue billion Forecast, by Type 2020 & 2033
- Table 27: Global Synthetic Diamond Industry Revenue billion Forecast, by Manufacturing Process 2020 & 2033
- Table 28: Global Synthetic Diamond Industry Revenue billion Forecast, by Country 2020 & 2033
- Table 29: Brazil Synthetic Diamond Industry Revenue (billion) Forecast, by Application 2020 & 2033
- Table 30: Rest of South America Synthetic Diamond Industry Revenue (billion) Forecast, by Application 2020 & 2033
- Table 31: Global Synthetic Diamond Industry Revenue billion Forecast, by Type 2020 & 2033
- Table 32: Global Synthetic Diamond Industry Revenue billion Forecast, by Manufacturing Process 2020 & 2033
- Table 33: Global Synthetic Diamond Industry Revenue billion Forecast, by Country 2020 & 2033
- Table 34: GCC Countries Synthetic Diamond Industry Revenue (billion) Forecast, by Application 2020 & 2033
- Table 35: South Africa Synthetic Diamond Industry Revenue (billion) Forecast, by Application 2020 & 2033
- Table 36: Rest of Middle East and Africa Synthetic Diamond Industry Revenue (billion) Forecast, by Application 2020 & 2033
Frequently Asked Questions
1. What is the projected Compound Annual Growth Rate (CAGR) of the Synthetic Diamond Industry?
The projected CAGR is approximately 2.7%.
2. Which companies are prominent players in the Synthetic Diamond Industry?
Key companies in the market include Element Six UK Ltd, Zhengzhou Sino-Crystal Diamond Co Ltd, Zhongnan Diamond Co Ltd *List Not Exhaustive, ILJIN DIAMOND CO LTD, Swarovski, New Diamond Technology, Pure Grown Diamonds (PGD), Applied Diamond Inc, Henan Huanghe Whirlwind Co Ltd, Sumitomo Electric Industries Ltd, Adamas One Corp.
3. What are the main segments of the Synthetic Diamond Industry?
The market segments include Type, Manufacturing Process.
4. Can you provide details about the market size?
The market size is estimated to be USD 42.74 billion as of 2022.
5. What are some drivers contributing to market growth?
Increasing Demand from Electronics and Semiconductors Applications; Growing Demand for Super Abrasives.
6. What are the notable trends driving market growth?
Construction Segment to Dominate the Rough Type.
7. Are there any restraints impacting market growth?
Complex Manufacturing Process.
8. Can you provide examples of recent developments in the market?
In February 2022, Element Six UK Ltd collaborated with II-VI Inc. Through this collaboration, II-VI licenses Element Six's intellectual property and necessary equipment would produce high-quality single-crystal diamonds to expand its core competency in diamond technology.
9. What pricing options are available for accessing the report?
Pricing options include single-user, multi-user, and enterprise licenses priced at USD 4750, USD 5250, and USD 8750 respectively.
10. Is the market size provided in terms of value or volume?
The market size is provided in terms of value, measured in billion.
11. Are there any specific market keywords associated with the report?
Yes, the market keyword associated with the report is "Synthetic Diamond Industry," which aids in identifying and referencing the specific market segment covered.
12. How do I determine which pricing option suits my needs best?
The pricing options vary based on user requirements and access needs. Individual users may opt for single-user licenses, while businesses requiring broader access may choose multi-user or enterprise licenses for cost-effective access to the report.
13. Are there any additional resources or data provided in the Synthetic Diamond Industry report?
While the report offers comprehensive insights, it's advisable to review the specific contents or supplementary materials provided to ascertain if additional resources or data are available.
14. How can I stay updated on further developments or reports in the Synthetic Diamond Industry?
To stay informed about further developments, trends, and reports in the Synthetic Diamond Industry, consider subscribing to industry newsletters, following relevant companies and organizations, or regularly checking reputable industry news sources and publications.
Methodology
Step 1 - Identification of Relevant Samples Size from Population Database


Step 2 - Approaches for Defining Global Market Size (Value, Volume* & Price*)

Note*: In applicable scenarios
Step 3 - Data Sources
Primary Research
- Web Analytics
- Survey Reports
- Research Institute
- Latest Research Reports
- Opinion Leaders
Secondary Research
- Annual Reports
- White Paper
- Latest Press Release
- Industry Association
- Paid Database
- Investor Presentations

Step 4 - Data Triangulation
Involves using different sources of information in order to increase the validity of a study
These sources are likely to be stakeholders in a program - participants, other researchers, program staff, other community members, and so on.
Then we put all data in single framework & apply various statistical tools to find out the dynamic on the market.
During the analysis stage, feedback from the stakeholder groups would be compared to determine areas of agreement as well as areas of divergence