

Key Insights
The global specialty oilfield chemicals market, valued at $29861.3 million in the base year 2025, is poised for significant expansion. Projected to grow at a compound annual growth rate (CAGR) of 3.2%, this growth is primarily fueled by escalating global oil and gas exploration and production (E&P) activities. Key market drivers include the increasing adoption of Enhanced Oil Recovery (EOR) techniques, which necessitate advanced chemical solutions for improved operational efficiency. Concurrently, stringent environmental regulations are accelerating the demand for eco-friendly chemicals, fostering innovation within segments like biocides and other sustainable chemical formulations. The market is segmented by chemical type, with polymers, surfactants, and biocides representing substantial shares due to their critical functions in drilling, production, and well stimulation. The application segment is dominated by drilling and cementing chemicals, followed by EOR and production chemicals, underscoring the industry's commitment to maximizing hydrocarbon output and extending asset life. Major industry players, including Clariant, Schlumberger, and Halliburton, are strategically utilizing their technological prowess and extensive service networks to solidify their market positions. Geographically, North America and Asia-Pacific exhibit the strongest market presence, correlating with their extensive E&P operations. However, robust growth is also anticipated in South America, the Middle East, and Africa, driven by ongoing exploration initiatives and technological advancements.
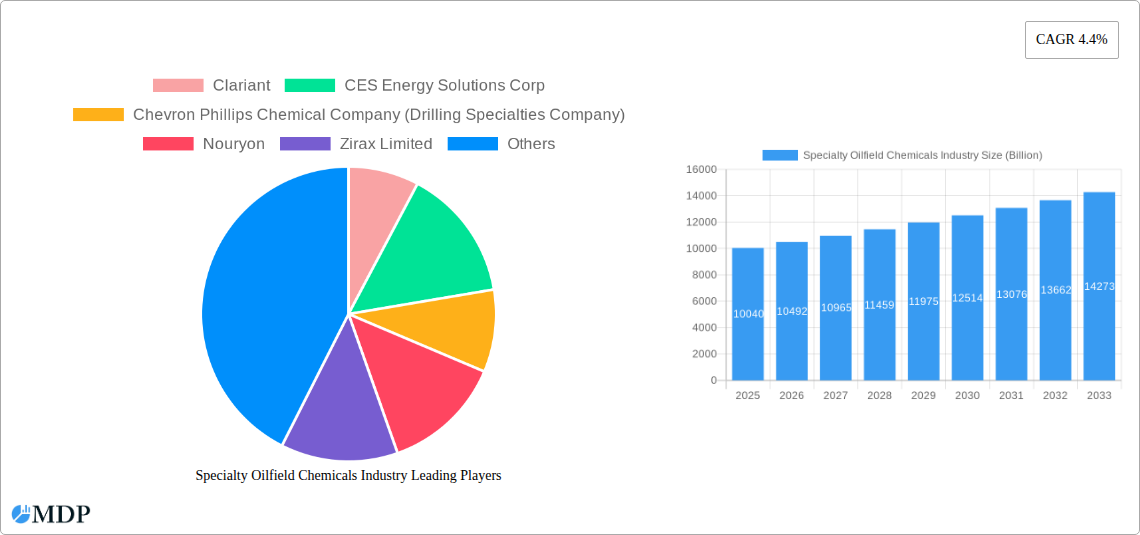
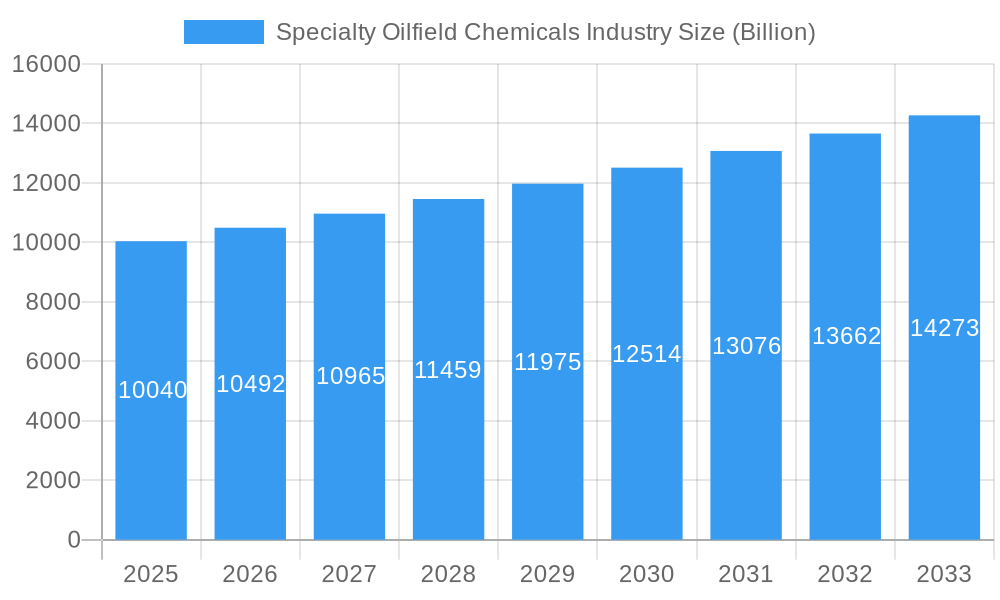
Specialty Oilfield Chemicals Industry Market Size (In Billion)
The competitive environment is a dynamic interplay between established multinational corporations and agile niche players. While large enterprises leverage economies of scale and global infrastructure, smaller firms excel in specialized applications and novel chemical development. Continuous technological advancements in oilfield chemistry, particularly in biodegradable formulations and high-performance additives, will remain pivotal in shaping market trajectories. Future market expansion will be contingent upon factors such as fluctuating global oil prices, ongoing technological innovation, and evolving environmental mandates. The projected CAGR indicates substantial market growth across the forecast period, affirming the persistent demand for specialized chemicals essential for optimizing oil and gas extraction processes.
Specialty Oilfield Chemicals Industry Company Market Share
Specialty Oilfield Chemicals Industry Report: 2019-2033
This comprehensive report provides an in-depth analysis of the global specialty oilfield chemicals market, projecting a valuation of $XX Billion by 2033. Covering the historical period (2019-2024), base year (2025), and forecast period (2025-2033), this report is essential for industry stakeholders, investors, and researchers seeking actionable insights into this dynamic sector. We analyze market trends, leading players like Clariant, Halliburton, and Schlumberger, and key segments to help you navigate the complexities of this Billion-dollar market.
Specialty Oilfield Chemicals Industry Market Dynamics & Concentration
The specialty oilfield chemicals market is characterized by moderate concentration, with a few large multinational corporations holding significant market share. The market share of the top five players is estimated to be around XX%, indicating a competitive yet consolidated landscape. Innovation is a key driver, with companies continuously developing new products to improve efficiency and reduce environmental impact. Stringent regulatory frameworks, particularly concerning environmental protection and worker safety, significantly influence market dynamics. The industry faces pressure from substitute materials and evolving end-user demands for sustainable and high-performance solutions. Mergers and acquisitions (M&A) activities are prevalent, with XX major deals recorded between 2019 and 2024, primarily driven by the desire for market expansion and technological integration.
- Market Concentration: Top 5 players hold approximately XX% market share.
- Innovation Drivers: Development of environmentally friendly and high-performance chemicals.
- Regulatory Frameworks: Stringent environmental and safety regulations shaping product development.
- M&A Activity: XX major deals between 2019 and 2024, driving consolidation and expansion.
- Product Substitutes: Pressure from alternative materials with comparable functionalities.
Specialty Oilfield Chemicals Industry Industry Trends & Analysis
The global specialty oilfield chemicals market is projected to experience robust growth, with a Compound Annual Growth Rate (CAGR) of XX% during the forecast period (2025-2033). This growth is fueled by several key factors, including rising global oil and gas production, increasing demand for enhanced oil recovery techniques, and technological advancements in drilling and production processes. The market penetration of advanced chemical technologies like nanomaterials and bio-based chemicals is steadily increasing, driven by environmental concerns and improved performance characteristics. However, the market is not without its challenges; fluctuating crude oil prices and economic downturns can significantly impact demand. Intense competition among established players and new entrants also contributes to the dynamic nature of the market. Moreover, consumer preferences are shifting towards sustainable and environmentally friendly solutions, forcing companies to adapt their production and product portfolios.
Leading Markets & Segments in Specialty Oilfield Chemicals Industry
The North American region currently dominates the global specialty oilfield chemicals market, driven by robust oil and gas production activities and a well-established infrastructure. However, the Asia-Pacific region is expected to witness significant growth in the coming years due to substantial investments in oil and gas exploration and production.
Dominant Segments:
- By Chemical Type: Corrosion and Scale Inhibitors and Polymers hold the largest market share, driven by their critical role in various oil and gas operations.
- By Application: The Production segment exhibits strong growth, boosted by the increasing demand for efficient oil and gas extraction.
Key Drivers by Region:
- North America: Established oil and gas infrastructure, favorable regulatory environment.
- Asia-Pacific: Rising energy demand, growing investments in oil and gas exploration and production.
- Europe: Focus on environmentally friendly solutions, stringent environmental regulations.
Specialty Oilfield Chemicals Industry Product Developments
Recent product innovations focus on improving performance, reducing environmental impact, and enhancing cost-effectiveness. The development of environmentally friendly biocides, corrosion inhibitors, and demulsifiers is gaining traction. Nanotechnology-based products are also emerging, offering improved performance characteristics and enhanced efficiency. These advancements are creating significant competitive advantages for companies that can successfully develop and commercialize these innovative solutions. The market fit for these new products is strong, driven by the industry's increasing focus on sustainability and improved operational efficiency.
Key Drivers of Specialty Oilfield Chemicals Industry Growth
The growth of the specialty oilfield chemicals industry is driven by a convergence of factors. Increased global energy demand is a primary driver, necessitating enhanced oil and gas extraction technologies. Technological advancements, such as nanotechnology and improved formulations, are leading to the development of more effective and environmentally friendly chemicals. Furthermore, supportive government policies and investments in infrastructure development in key regions are fostering market expansion. The consistent growth in unconventional oil and gas exploration also significantly contributes to the demand for these specialized chemicals.
Challenges in the Specialty Oilfield Chemicals Industry Market
The specialty oilfield chemicals market faces significant challenges. Fluctuating crude oil prices create volatility in demand, impacting profitability. Stringent environmental regulations increase compliance costs and limit the use of certain chemical formulations. Supply chain disruptions, particularly concerning raw materials, can negatively affect production and pricing. Finally, intense competition from both established players and emerging companies creates a challenging market landscape, requiring companies to constantly innovate and optimize their operations to maintain a competitive edge. The projected impact of these challenges on market growth is estimated to be around XX%.
Emerging Opportunities in Specialty Oilfield Chemicals Industry
Significant opportunities exist for growth in the specialty oilfield chemicals market. Technological advancements, particularly in the field of nanotechnology and bio-based chemicals, are opening up new avenues for innovation and improved efficiency. Strategic partnerships and collaborations among companies are becoming increasingly important for accessing new markets and technologies. Furthermore, the expansion into emerging markets with significant oil and gas potential presents lucrative opportunities for growth and market share expansion. The focus on sustainability and environmentally friendly solutions also provides a significant growth catalyst.
Leading Players in the Specialty Oilfield Chemicals Industry Sector
- Clariant
- CES Energy Solutions Corp
- Chevron Phillips Chemical Company (Drilling Specialties Company)
- Nouryon
- Zirax Limited
- Solvay
- Innospec Oilfield Services
- Ecolab (NALCO Champion)
- Elementis PLC
- Croda International PLC
- Ashland
- BASF SE
- Huntsman International LLC
- Kemira
- Dow
- Flotek Industries Inc
- The Lubrizol Corporation
- Baker Hughes Company
- Halliburton
- MPRC
- Schlumberger Limited
- Albemarle Corporation
Key Milestones in Specialty Oilfield Chemicals Industry Industry
- March 2022: Halliburton announced the opening of the Halliburton Chemical Reaction Plant in Saudi Arabia, expanding its manufacturing capacity and market reach in the Middle East. This significantly impacted market dynamics by increasing the supply of oilfield chemicals in the region.
- December 2022: Champion X opened a new oilfield services chemicals lab and distribution facility in Chaguaramas, Trinidad. This strengthens their analytical capabilities and logistics network, enhancing service offerings and competitiveness within the Caribbean region.
Strategic Outlook for Specialty Oilfield Chemicals Industry Market
The future of the specialty oilfield chemicals market appears promising, driven by sustained growth in the oil and gas industry, coupled with ongoing technological advancements. Companies that strategically focus on developing environmentally sustainable solutions, investing in research and development, and forging strategic partnerships are well-positioned to capture significant market share. The expansion into emerging markets and diversification into related sectors, such as renewable energy, will play a pivotal role in shaping the industry's long-term growth trajectory. The market's potential for further expansion is significant, particularly in regions with substantial oil and gas reserves and increasing energy demands.
Specialty Oilfield Chemicals Industry Segmentation
-
1. Chemical Type
- 1.1. Biocides
- 1.2. Corrosion and Scale Inhibitors
- 1.3. Demulsifiers
- 1.4. Polymers
- 1.5. Surfactants
- 1.6. Other Chemical Types
-
2. Application
- 2.1. Drilling and Cementing
- 2.2. Enhanced Oil Recovery
- 2.3. Production
- 2.4. Well Stimulation
- 2.5. Workover and Completion
Specialty Oilfield Chemicals Industry Segmentation By Geography
-
1. Asia Pacific
- 1.1. China
- 1.2. India
- 1.3. Indonesia
- 1.4. Malaysia
- 1.5. Thailand
- 1.6. Australia
-
2. Vietnam
- 2.1. Rest of Asia Pacific
-
3. North America
- 3.1. United States
- 3.2. Canada
- 3.3. Mexico
-
4. Europe
- 4.1. Russia
- 4.2. Norway
- 4.3. UK
- 4.4. Rest of Europe
-
5. South America
- 5.1. Brazil
- 5.2. Argentina
- 5.3. Columbia
- 5.4. Rest of South America
-
6. Middle East and Africa
- 6.1. Algeria
- 6.2. Iran
- 6.3. Iraq
- 6.4. Nigeria
- 6.5. Saudi Arabia
- 6.6. Rest of Middle East and Africa
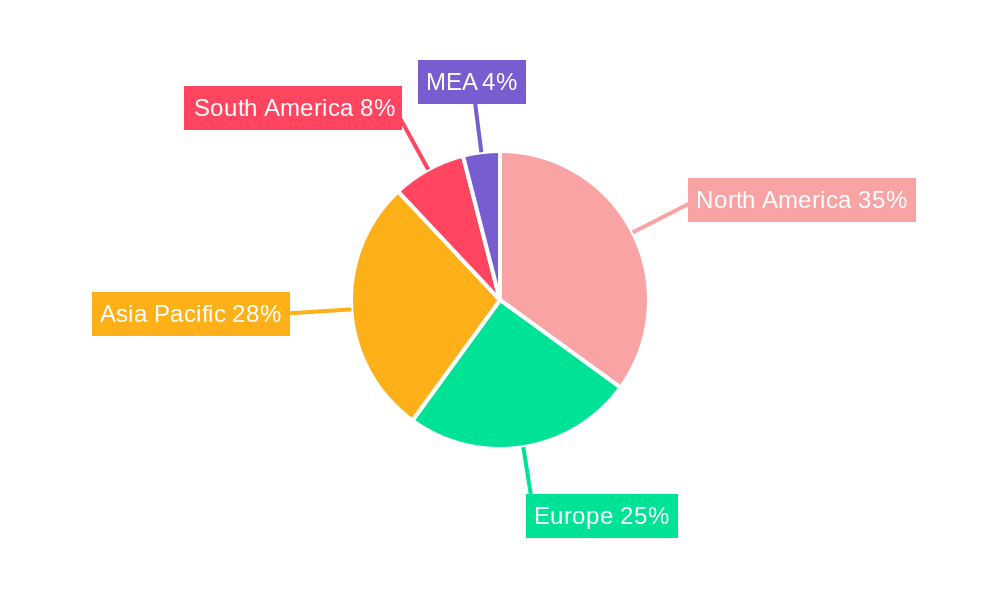
Specialty Oilfield Chemicals Industry Regional Market Share
Geographic Coverage of Specialty Oilfield Chemicals Industry
Specialty Oilfield Chemicals Industry REPORT HIGHLIGHTS
| Aspects | Details |
|---|---|
| Study Period | 2020-2034 |
| Base Year | 2025 |
| Estimated Year | 2026 |
| Forecast Period | 2026-2034 |
| Historical Period | 2020-2025 |
| Growth Rate | CAGR of 3.2% from 2020-2034 |
| Segmentation |
|
Table of Contents
- 1. Introduction
- 1.1. Research Scope
- 1.2. Market Segmentation
- 1.3. Research Objective
- 1.4. Definitions and Assumptions
- 2. Executive Summary
- 2.1. Market Snapshot
- 3. Market Dynamics
- 3.1. Market Drivers
- 3.2. Market Restrains
- 3.3. Market Trends
- 3.4. Market Opportunities
- 4. Market Factor Analysis
- 4.1. Porters Five Forces
- 4.1.1. Bargaining Power of Suppliers
- 4.1.2. Bargaining Power of Buyers
- 4.1.3. Threat of New Entrants
- 4.1.4. Threat of Substitutes
- 4.1.5. Competitive Rivalry
- 4.2. PESTEL analysis
- 4.3. BCG Analysis
- 4.3.1. Stars (High Growth, High Market Share)
- 4.3.2. Cash Cows (Low Growth, High Market Share)
- 4.3.3. Question Mark (High Growth, Low Market Share)
- 4.3.4. Dogs (Low Growth, Low Market Share)
- 4.4. Ansoff Matrix Analysis
- 4.5. Supply Chain Analysis
- 4.6. Regulatory Landscape
- 4.7. Current Market Potential and Opportunity Assessment (TAM–SAM–SOM Framework)
- 4.8. MDP Analyst Note
- 4.1. Porters Five Forces
- 5. Market Analysis, Insights and Forecast 2021-2033
- 5.1. Market Analysis, Insights and Forecast - by Chemical Type
- 5.1.1. Biocides
- 5.1.2. Corrosion and Scale Inhibitors
- 5.1.3. Demulsifiers
- 5.1.4. Polymers
- 5.1.5. Surfactants
- 5.1.6. Other Chemical Types
- 5.2. Market Analysis, Insights and Forecast - by Application
- 5.2.1. Drilling and Cementing
- 5.2.2. Enhanced Oil Recovery
- 5.2.3. Production
- 5.2.4. Well Stimulation
- 5.2.5. Workover and Completion
- 5.3. Market Analysis, Insights and Forecast - by Region
- 5.3.1. Asia Pacific
- 5.3.2. Vietnam
- 5.3.3. North America
- 5.3.4. Europe
- 5.3.5. South America
- 5.3.6. Middle East and Africa
- 5.1. Market Analysis, Insights and Forecast - by Chemical Type
- 6. Global Specialty Oilfield Chemicals Industry Analysis, Insights and Forecast, 2021-2033
- 6.1. Market Analysis, Insights and Forecast - by Chemical Type
- 6.1.1. Biocides
- 6.1.2. Corrosion and Scale Inhibitors
- 6.1.3. Demulsifiers
- 6.1.4. Polymers
- 6.1.5. Surfactants
- 6.1.6. Other Chemical Types
- 6.2. Market Analysis, Insights and Forecast - by Application
- 6.2.1. Drilling and Cementing
- 6.2.2. Enhanced Oil Recovery
- 6.2.3. Production
- 6.2.4. Well Stimulation
- 6.2.5. Workover and Completion
- 6.1. Market Analysis, Insights and Forecast - by Chemical Type
- 7. Asia Pacific Specialty Oilfield Chemicals Industry Analysis, Insights and Forecast, 2020-2032
- 7.1. Market Analysis, Insights and Forecast - by Chemical Type
- 7.1.1. Biocides
- 7.1.2. Corrosion and Scale Inhibitors
- 7.1.3. Demulsifiers
- 7.1.4. Polymers
- 7.1.5. Surfactants
- 7.1.6. Other Chemical Types
- 7.2. Market Analysis, Insights and Forecast - by Application
- 7.2.1. Drilling and Cementing
- 7.2.2. Enhanced Oil Recovery
- 7.2.3. Production
- 7.2.4. Well Stimulation
- 7.2.5. Workover and Completion
- 7.1. Market Analysis, Insights and Forecast - by Chemical Type
- 8. Vietnam Specialty Oilfield Chemicals Industry Analysis, Insights and Forecast, 2020-2032
- 8.1. Market Analysis, Insights and Forecast - by Chemical Type
- 8.1.1. Biocides
- 8.1.2. Corrosion and Scale Inhibitors
- 8.1.3. Demulsifiers
- 8.1.4. Polymers
- 8.1.5. Surfactants
- 8.1.6. Other Chemical Types
- 8.2. Market Analysis, Insights and Forecast - by Application
- 8.2.1. Drilling and Cementing
- 8.2.2. Enhanced Oil Recovery
- 8.2.3. Production
- 8.2.4. Well Stimulation
- 8.2.5. Workover and Completion
- 8.1. Market Analysis, Insights and Forecast - by Chemical Type
- 9. North America Specialty Oilfield Chemicals Industry Analysis, Insights and Forecast, 2020-2032
- 9.1. Market Analysis, Insights and Forecast - by Chemical Type
- 9.1.1. Biocides
- 9.1.2. Corrosion and Scale Inhibitors
- 9.1.3. Demulsifiers
- 9.1.4. Polymers
- 9.1.5. Surfactants
- 9.1.6. Other Chemical Types
- 9.2. Market Analysis, Insights and Forecast - by Application
- 9.2.1. Drilling and Cementing
- 9.2.2. Enhanced Oil Recovery
- 9.2.3. Production
- 9.2.4. Well Stimulation
- 9.2.5. Workover and Completion
- 9.1. Market Analysis, Insights and Forecast - by Chemical Type
- 10. Europe Specialty Oilfield Chemicals Industry Analysis, Insights and Forecast, 2020-2032
- 10.1. Market Analysis, Insights and Forecast - by Chemical Type
- 10.1.1. Biocides
- 10.1.2. Corrosion and Scale Inhibitors
- 10.1.3. Demulsifiers
- 10.1.4. Polymers
- 10.1.5. Surfactants
- 10.1.6. Other Chemical Types
- 10.2. Market Analysis, Insights and Forecast - by Application
- 10.2.1. Drilling and Cementing
- 10.2.2. Enhanced Oil Recovery
- 10.2.3. Production
- 10.2.4. Well Stimulation
- 10.2.5. Workover and Completion
- 10.1. Market Analysis, Insights and Forecast - by Chemical Type
- 11. South America Specialty Oilfield Chemicals Industry Analysis, Insights and Forecast, 2020-2032
- 11.1. Market Analysis, Insights and Forecast - by Chemical Type
- 11.1.1. Biocides
- 11.1.2. Corrosion and Scale Inhibitors
- 11.1.3. Demulsifiers
- 11.1.4. Polymers
- 11.1.5. Surfactants
- 11.1.6. Other Chemical Types
- 11.2. Market Analysis, Insights and Forecast - by Application
- 11.2.1. Drilling and Cementing
- 11.2.2. Enhanced Oil Recovery
- 11.2.3. Production
- 11.2.4. Well Stimulation
- 11.2.5. Workover and Completion
- 11.1. Market Analysis, Insights and Forecast - by Chemical Type
- 12. Middle East and Africa Specialty Oilfield Chemicals Industry Analysis, Insights and Forecast, 2020-2032
- 12.1. Market Analysis, Insights and Forecast - by Chemical Type
- 12.1.1. Biocides
- 12.1.2. Corrosion and Scale Inhibitors
- 12.1.3. Demulsifiers
- 12.1.4. Polymers
- 12.1.5. Surfactants
- 12.1.6. Other Chemical Types
- 12.2. Market Analysis, Insights and Forecast - by Application
- 12.2.1. Drilling and Cementing
- 12.2.2. Enhanced Oil Recovery
- 12.2.3. Production
- 12.2.4. Well Stimulation
- 12.2.5. Workover and Completion
- 12.1. Market Analysis, Insights and Forecast - by Chemical Type
- 13. Competitive Analysis
- 13.1. Company Profiles
- 13.1.1 Clariant
- 13.1.1.1. Company Overview
- 13.1.1.2. Products
- 13.1.1.3. Company Financials
- 13.1.1.4. SWOT Analysis
- 13.1.2 CES Energy Solutions Corp
- 13.1.2.1. Company Overview
- 13.1.2.2. Products
- 13.1.2.3. Company Financials
- 13.1.2.4. SWOT Analysis
- 13.1.3 Chevron Phillips Chemical Company (Drilling Specialties Company)
- 13.1.3.1. Company Overview
- 13.1.3.2. Products
- 13.1.3.3. Company Financials
- 13.1.3.4. SWOT Analysis
- 13.1.4 Nouryon
- 13.1.4.1. Company Overview
- 13.1.4.2. Products
- 13.1.4.3. Company Financials
- 13.1.4.4. SWOT Analysis
- 13.1.5 Zirax Limited
- 13.1.5.1. Company Overview
- 13.1.5.2. Products
- 13.1.5.3. Company Financials
- 13.1.5.4. SWOT Analysis
- 13.1.6 Solvay
- 13.1.6.1. Company Overview
- 13.1.6.2. Products
- 13.1.6.3. Company Financials
- 13.1.6.4. SWOT Analysis
- 13.1.7 Innospec Oilfield Services
- 13.1.7.1. Company Overview
- 13.1.7.2. Products
- 13.1.7.3. Company Financials
- 13.1.7.4. SWOT Analysis
- 13.1.8 Ecolab (NALCO Champion)
- 13.1.8.1. Company Overview
- 13.1.8.2. Products
- 13.1.8.3. Company Financials
- 13.1.8.4. SWOT Analysis
- 13.1.9 Elementis PLC
- 13.1.9.1. Company Overview
- 13.1.9.2. Products
- 13.1.9.3. Company Financials
- 13.1.9.4. SWOT Analysis
- 13.1.10 Croda International PLC
- 13.1.10.1. Company Overview
- 13.1.10.2. Products
- 13.1.10.3. Company Financials
- 13.1.10.4. SWOT Analysis
- 13.1.11 Ashland
- 13.1.11.1. Company Overview
- 13.1.11.2. Products
- 13.1.11.3. Company Financials
- 13.1.11.4. SWOT Analysis
- 13.1.12 BASF SE
- 13.1.12.1. Company Overview
- 13.1.12.2. Products
- 13.1.12.3. Company Financials
- 13.1.12.4. SWOT Analysis
- 13.1.13 Huntsman International LLC
- 13.1.13.1. Company Overview
- 13.1.13.2. Products
- 13.1.13.3. Company Financials
- 13.1.13.4. SWOT Analysis
- 13.1.14 Kemira
- 13.1.14.1. Company Overview
- 13.1.14.2. Products
- 13.1.14.3. Company Financials
- 13.1.14.4. SWOT Analysis
- 13.1.15 Dow
- 13.1.15.1. Company Overview
- 13.1.15.2. Products
- 13.1.15.3. Company Financials
- 13.1.15.4. SWOT Analysis
- 13.1.16 Flotek Industries Inc
- 13.1.16.1. Company Overview
- 13.1.16.2. Products
- 13.1.16.3. Company Financials
- 13.1.16.4. SWOT Analysis
- 13.1.17 The Lubrizol Corporation
- 13.1.17.1. Company Overview
- 13.1.17.2. Products
- 13.1.17.3. Company Financials
- 13.1.17.4. SWOT Analysis
- 13.1.18 Baker Hughes Company
- 13.1.18.1. Company Overview
- 13.1.18.2. Products
- 13.1.18.3. Company Financials
- 13.1.18.4. SWOT Analysis
- 13.1.19 Halliburton
- 13.1.19.1. Company Overview
- 13.1.19.2. Products
- 13.1.19.3. Company Financials
- 13.1.19.4. SWOT Analysis
- 13.1.20 MPRC
- 13.1.20.1. Company Overview
- 13.1.20.2. Products
- 13.1.20.3. Company Financials
- 13.1.20.4. SWOT Analysis
- 13.1.21 Schlumberger Limited
- 13.1.21.1. Company Overview
- 13.1.21.2. Products
- 13.1.21.3. Company Financials
- 13.1.21.4. SWOT Analysis
- 13.1.22 Albemarle Corporation
- 13.1.22.1. Company Overview
- 13.1.22.2. Products
- 13.1.22.3. Company Financials
- 13.1.22.4. SWOT Analysis
- 13.1.1 Clariant
- 13.2. Market Entropy
- 13.2.1 Company's Key Areas Served
- 13.2.2 Recent Developments
- 13.3. Company Market Share Analysis 2025
- 13.3.1 Top 5 Companies Market Share Analysis
- 13.3.2 Top 3 Companies Market Share Analysis
- 13.4. List of Potential Customers
- 14. Research Methodology
List of Figures
- Figure 1: Global Specialty Oilfield Chemicals Industry Revenue Breakdown (million, %) by Region 2025 & 2033
- Figure 2: Global Specialty Oilfield Chemicals Industry Volume Breakdown (K Tons, %) by Region 2025 & 2033
- Figure 3: Asia Pacific Specialty Oilfield Chemicals Industry Revenue (million), by Chemical Type 2025 & 2033
- Figure 4: Asia Pacific Specialty Oilfield Chemicals Industry Volume (K Tons), by Chemical Type 2025 & 2033
- Figure 5: Asia Pacific Specialty Oilfield Chemicals Industry Revenue Share (%), by Chemical Type 2025 & 2033
- Figure 6: Asia Pacific Specialty Oilfield Chemicals Industry Volume Share (%), by Chemical Type 2025 & 2033
- Figure 7: Asia Pacific Specialty Oilfield Chemicals Industry Revenue (million), by Application 2025 & 2033
- Figure 8: Asia Pacific Specialty Oilfield Chemicals Industry Volume (K Tons), by Application 2025 & 2033
- Figure 9: Asia Pacific Specialty Oilfield Chemicals Industry Revenue Share (%), by Application 2025 & 2033
- Figure 10: Asia Pacific Specialty Oilfield Chemicals Industry Volume Share (%), by Application 2025 & 2033
- Figure 11: Asia Pacific Specialty Oilfield Chemicals Industry Revenue (million), by Country 2025 & 2033
- Figure 12: Asia Pacific Specialty Oilfield Chemicals Industry Volume (K Tons), by Country 2025 & 2033
- Figure 13: Asia Pacific Specialty Oilfield Chemicals Industry Revenue Share (%), by Country 2025 & 2033
- Figure 14: Asia Pacific Specialty Oilfield Chemicals Industry Volume Share (%), by Country 2025 & 2033
- Figure 15: Vietnam Specialty Oilfield Chemicals Industry Revenue (million), by Chemical Type 2025 & 2033
- Figure 16: Vietnam Specialty Oilfield Chemicals Industry Volume (K Tons), by Chemical Type 2025 & 2033
- Figure 17: Vietnam Specialty Oilfield Chemicals Industry Revenue Share (%), by Chemical Type 2025 & 2033
- Figure 18: Vietnam Specialty Oilfield Chemicals Industry Volume Share (%), by Chemical Type 2025 & 2033
- Figure 19: Vietnam Specialty Oilfield Chemicals Industry Revenue (million), by Application 2025 & 2033
- Figure 20: Vietnam Specialty Oilfield Chemicals Industry Volume (K Tons), by Application 2025 & 2033
- Figure 21: Vietnam Specialty Oilfield Chemicals Industry Revenue Share (%), by Application 2025 & 2033
- Figure 22: Vietnam Specialty Oilfield Chemicals Industry Volume Share (%), by Application 2025 & 2033
- Figure 23: Vietnam Specialty Oilfield Chemicals Industry Revenue (million), by Country 2025 & 2033
- Figure 24: Vietnam Specialty Oilfield Chemicals Industry Volume (K Tons), by Country 2025 & 2033
- Figure 25: Vietnam Specialty Oilfield Chemicals Industry Revenue Share (%), by Country 2025 & 2033
- Figure 26: Vietnam Specialty Oilfield Chemicals Industry Volume Share (%), by Country 2025 & 2033
- Figure 27: North America Specialty Oilfield Chemicals Industry Revenue (million), by Chemical Type 2025 & 2033
- Figure 28: North America Specialty Oilfield Chemicals Industry Volume (K Tons), by Chemical Type 2025 & 2033
- Figure 29: North America Specialty Oilfield Chemicals Industry Revenue Share (%), by Chemical Type 2025 & 2033
- Figure 30: North America Specialty Oilfield Chemicals Industry Volume Share (%), by Chemical Type 2025 & 2033
- Figure 31: North America Specialty Oilfield Chemicals Industry Revenue (million), by Application 2025 & 2033
- Figure 32: North America Specialty Oilfield Chemicals Industry Volume (K Tons), by Application 2025 & 2033
- Figure 33: North America Specialty Oilfield Chemicals Industry Revenue Share (%), by Application 2025 & 2033
- Figure 34: North America Specialty Oilfield Chemicals Industry Volume Share (%), by Application 2025 & 2033
- Figure 35: North America Specialty Oilfield Chemicals Industry Revenue (million), by Country 2025 & 2033
- Figure 36: North America Specialty Oilfield Chemicals Industry Volume (K Tons), by Country 2025 & 2033
- Figure 37: North America Specialty Oilfield Chemicals Industry Revenue Share (%), by Country 2025 & 2033
- Figure 38: North America Specialty Oilfield Chemicals Industry Volume Share (%), by Country 2025 & 2033
- Figure 39: Europe Specialty Oilfield Chemicals Industry Revenue (million), by Chemical Type 2025 & 2033
- Figure 40: Europe Specialty Oilfield Chemicals Industry Volume (K Tons), by Chemical Type 2025 & 2033
- Figure 41: Europe Specialty Oilfield Chemicals Industry Revenue Share (%), by Chemical Type 2025 & 2033
- Figure 42: Europe Specialty Oilfield Chemicals Industry Volume Share (%), by Chemical Type 2025 & 2033
- Figure 43: Europe Specialty Oilfield Chemicals Industry Revenue (million), by Application 2025 & 2033
- Figure 44: Europe Specialty Oilfield Chemicals Industry Volume (K Tons), by Application 2025 & 2033
- Figure 45: Europe Specialty Oilfield Chemicals Industry Revenue Share (%), by Application 2025 & 2033
- Figure 46: Europe Specialty Oilfield Chemicals Industry Volume Share (%), by Application 2025 & 2033
- Figure 47: Europe Specialty Oilfield Chemicals Industry Revenue (million), by Country 2025 & 2033
- Figure 48: Europe Specialty Oilfield Chemicals Industry Volume (K Tons), by Country 2025 & 2033
- Figure 49: Europe Specialty Oilfield Chemicals Industry Revenue Share (%), by Country 2025 & 2033
- Figure 50: Europe Specialty Oilfield Chemicals Industry Volume Share (%), by Country 2025 & 2033
- Figure 51: South America Specialty Oilfield Chemicals Industry Revenue (million), by Chemical Type 2025 & 2033
- Figure 52: South America Specialty Oilfield Chemicals Industry Volume (K Tons), by Chemical Type 2025 & 2033
- Figure 53: South America Specialty Oilfield Chemicals Industry Revenue Share (%), by Chemical Type 2025 & 2033
- Figure 54: South America Specialty Oilfield Chemicals Industry Volume Share (%), by Chemical Type 2025 & 2033
- Figure 55: South America Specialty Oilfield Chemicals Industry Revenue (million), by Application 2025 & 2033
- Figure 56: South America Specialty Oilfield Chemicals Industry Volume (K Tons), by Application 2025 & 2033
- Figure 57: South America Specialty Oilfield Chemicals Industry Revenue Share (%), by Application 2025 & 2033
- Figure 58: South America Specialty Oilfield Chemicals Industry Volume Share (%), by Application 2025 & 2033
- Figure 59: South America Specialty Oilfield Chemicals Industry Revenue (million), by Country 2025 & 2033
- Figure 60: South America Specialty Oilfield Chemicals Industry Volume (K Tons), by Country 2025 & 2033
- Figure 61: South America Specialty Oilfield Chemicals Industry Revenue Share (%), by Country 2025 & 2033
- Figure 62: South America Specialty Oilfield Chemicals Industry Volume Share (%), by Country 2025 & 2033
- Figure 63: Middle East and Africa Specialty Oilfield Chemicals Industry Revenue (million), by Chemical Type 2025 & 2033
- Figure 64: Middle East and Africa Specialty Oilfield Chemicals Industry Volume (K Tons), by Chemical Type 2025 & 2033
- Figure 65: Middle East and Africa Specialty Oilfield Chemicals Industry Revenue Share (%), by Chemical Type 2025 & 2033
- Figure 66: Middle East and Africa Specialty Oilfield Chemicals Industry Volume Share (%), by Chemical Type 2025 & 2033
- Figure 67: Middle East and Africa Specialty Oilfield Chemicals Industry Revenue (million), by Application 2025 & 2033
- Figure 68: Middle East and Africa Specialty Oilfield Chemicals Industry Volume (K Tons), by Application 2025 & 2033
- Figure 69: Middle East and Africa Specialty Oilfield Chemicals Industry Revenue Share (%), by Application 2025 & 2033
- Figure 70: Middle East and Africa Specialty Oilfield Chemicals Industry Volume Share (%), by Application 2025 & 2033
- Figure 71: Middle East and Africa Specialty Oilfield Chemicals Industry Revenue (million), by Country 2025 & 2033
- Figure 72: Middle East and Africa Specialty Oilfield Chemicals Industry Volume (K Tons), by Country 2025 & 2033
- Figure 73: Middle East and Africa Specialty Oilfield Chemicals Industry Revenue Share (%), by Country 2025 & 2033
- Figure 74: Middle East and Africa Specialty Oilfield Chemicals Industry Volume Share (%), by Country 2025 & 2033
List of Tables
- Table 1: Global Specialty Oilfield Chemicals Industry Revenue million Forecast, by Chemical Type 2020 & 2033
- Table 2: Global Specialty Oilfield Chemicals Industry Volume K Tons Forecast, by Chemical Type 2020 & 2033
- Table 3: Global Specialty Oilfield Chemicals Industry Revenue million Forecast, by Application 2020 & 2033
- Table 4: Global Specialty Oilfield Chemicals Industry Volume K Tons Forecast, by Application 2020 & 2033
- Table 5: Global Specialty Oilfield Chemicals Industry Revenue million Forecast, by Region 2020 & 2033
- Table 6: Global Specialty Oilfield Chemicals Industry Volume K Tons Forecast, by Region 2020 & 2033
- Table 7: Global Specialty Oilfield Chemicals Industry Revenue million Forecast, by Chemical Type 2020 & 2033
- Table 8: Global Specialty Oilfield Chemicals Industry Volume K Tons Forecast, by Chemical Type 2020 & 2033
- Table 9: Global Specialty Oilfield Chemicals Industry Revenue million Forecast, by Application 2020 & 2033
- Table 10: Global Specialty Oilfield Chemicals Industry Volume K Tons Forecast, by Application 2020 & 2033
- Table 11: Global Specialty Oilfield Chemicals Industry Revenue million Forecast, by Country 2020 & 2033
- Table 12: Global Specialty Oilfield Chemicals Industry Volume K Tons Forecast, by Country 2020 & 2033
- Table 13: China Specialty Oilfield Chemicals Industry Revenue (million) Forecast, by Application 2020 & 2033
- Table 14: China Specialty Oilfield Chemicals Industry Volume (K Tons) Forecast, by Application 2020 & 2033
- Table 15: India Specialty Oilfield Chemicals Industry Revenue (million) Forecast, by Application 2020 & 2033
- Table 16: India Specialty Oilfield Chemicals Industry Volume (K Tons) Forecast, by Application 2020 & 2033
- Table 17: Indonesia Specialty Oilfield Chemicals Industry Revenue (million) Forecast, by Application 2020 & 2033
- Table 18: Indonesia Specialty Oilfield Chemicals Industry Volume (K Tons) Forecast, by Application 2020 & 2033
- Table 19: Malaysia Specialty Oilfield Chemicals Industry Revenue (million) Forecast, by Application 2020 & 2033
- Table 20: Malaysia Specialty Oilfield Chemicals Industry Volume (K Tons) Forecast, by Application 2020 & 2033
- Table 21: Thailand Specialty Oilfield Chemicals Industry Revenue (million) Forecast, by Application 2020 & 2033
- Table 22: Thailand Specialty Oilfield Chemicals Industry Volume (K Tons) Forecast, by Application 2020 & 2033
- Table 23: Australia Specialty Oilfield Chemicals Industry Revenue (million) Forecast, by Application 2020 & 2033
- Table 24: Australia Specialty Oilfield Chemicals Industry Volume (K Tons) Forecast, by Application 2020 & 2033
- Table 25: Global Specialty Oilfield Chemicals Industry Revenue million Forecast, by Chemical Type 2020 & 2033
- Table 26: Global Specialty Oilfield Chemicals Industry Volume K Tons Forecast, by Chemical Type 2020 & 2033
- Table 27: Global Specialty Oilfield Chemicals Industry Revenue million Forecast, by Application 2020 & 2033
- Table 28: Global Specialty Oilfield Chemicals Industry Volume K Tons Forecast, by Application 2020 & 2033
- Table 29: Global Specialty Oilfield Chemicals Industry Revenue million Forecast, by Country 2020 & 2033
- Table 30: Global Specialty Oilfield Chemicals Industry Volume K Tons Forecast, by Country 2020 & 2033
- Table 31: Rest of Asia Pacific Specialty Oilfield Chemicals Industry Revenue (million) Forecast, by Application 2020 & 2033
- Table 32: Rest of Asia Pacific Specialty Oilfield Chemicals Industry Volume (K Tons) Forecast, by Application 2020 & 2033
- Table 33: Global Specialty Oilfield Chemicals Industry Revenue million Forecast, by Chemical Type 2020 & 2033
- Table 34: Global Specialty Oilfield Chemicals Industry Volume K Tons Forecast, by Chemical Type 2020 & 2033
- Table 35: Global Specialty Oilfield Chemicals Industry Revenue million Forecast, by Application 2020 & 2033
- Table 36: Global Specialty Oilfield Chemicals Industry Volume K Tons Forecast, by Application 2020 & 2033
- Table 37: Global Specialty Oilfield Chemicals Industry Revenue million Forecast, by Country 2020 & 2033
- Table 38: Global Specialty Oilfield Chemicals Industry Volume K Tons Forecast, by Country 2020 & 2033
- Table 39: United States Specialty Oilfield Chemicals Industry Revenue (million) Forecast, by Application 2020 & 2033
- Table 40: United States Specialty Oilfield Chemicals Industry Volume (K Tons) Forecast, by Application 2020 & 2033
- Table 41: Canada Specialty Oilfield Chemicals Industry Revenue (million) Forecast, by Application 2020 & 2033
- Table 42: Canada Specialty Oilfield Chemicals Industry Volume (K Tons) Forecast, by Application 2020 & 2033
- Table 43: Mexico Specialty Oilfield Chemicals Industry Revenue (million) Forecast, by Application 2020 & 2033
- Table 44: Mexico Specialty Oilfield Chemicals Industry Volume (K Tons) Forecast, by Application 2020 & 2033
- Table 45: Global Specialty Oilfield Chemicals Industry Revenue million Forecast, by Chemical Type 2020 & 2033
- Table 46: Global Specialty Oilfield Chemicals Industry Volume K Tons Forecast, by Chemical Type 2020 & 2033
- Table 47: Global Specialty Oilfield Chemicals Industry Revenue million Forecast, by Application 2020 & 2033
- Table 48: Global Specialty Oilfield Chemicals Industry Volume K Tons Forecast, by Application 2020 & 2033
- Table 49: Global Specialty Oilfield Chemicals Industry Revenue million Forecast, by Country 2020 & 2033
- Table 50: Global Specialty Oilfield Chemicals Industry Volume K Tons Forecast, by Country 2020 & 2033
- Table 51: Russia Specialty Oilfield Chemicals Industry Revenue (million) Forecast, by Application 2020 & 2033
- Table 52: Russia Specialty Oilfield Chemicals Industry Volume (K Tons) Forecast, by Application 2020 & 2033
- Table 53: Norway Specialty Oilfield Chemicals Industry Revenue (million) Forecast, by Application 2020 & 2033
- Table 54: Norway Specialty Oilfield Chemicals Industry Volume (K Tons) Forecast, by Application 2020 & 2033
- Table 55: UK Specialty Oilfield Chemicals Industry Revenue (million) Forecast, by Application 2020 & 2033
- Table 56: UK Specialty Oilfield Chemicals Industry Volume (K Tons) Forecast, by Application 2020 & 2033
- Table 57: Rest of Europe Specialty Oilfield Chemicals Industry Revenue (million) Forecast, by Application 2020 & 2033
- Table 58: Rest of Europe Specialty Oilfield Chemicals Industry Volume (K Tons) Forecast, by Application 2020 & 2033
- Table 59: Global Specialty Oilfield Chemicals Industry Revenue million Forecast, by Chemical Type 2020 & 2033
- Table 60: Global Specialty Oilfield Chemicals Industry Volume K Tons Forecast, by Chemical Type 2020 & 2033
- Table 61: Global Specialty Oilfield Chemicals Industry Revenue million Forecast, by Application 2020 & 2033
- Table 62: Global Specialty Oilfield Chemicals Industry Volume K Tons Forecast, by Application 2020 & 2033
- Table 63: Global Specialty Oilfield Chemicals Industry Revenue million Forecast, by Country 2020 & 2033
- Table 64: Global Specialty Oilfield Chemicals Industry Volume K Tons Forecast, by Country 2020 & 2033
- Table 65: Brazil Specialty Oilfield Chemicals Industry Revenue (million) Forecast, by Application 2020 & 2033
- Table 66: Brazil Specialty Oilfield Chemicals Industry Volume (K Tons) Forecast, by Application 2020 & 2033
- Table 67: Argentina Specialty Oilfield Chemicals Industry Revenue (million) Forecast, by Application 2020 & 2033
- Table 68: Argentina Specialty Oilfield Chemicals Industry Volume (K Tons) Forecast, by Application 2020 & 2033
- Table 69: Columbia Specialty Oilfield Chemicals Industry Revenue (million) Forecast, by Application 2020 & 2033
- Table 70: Columbia Specialty Oilfield Chemicals Industry Volume (K Tons) Forecast, by Application 2020 & 2033
- Table 71: Rest of South America Specialty Oilfield Chemicals Industry Revenue (million) Forecast, by Application 2020 & 2033
- Table 72: Rest of South America Specialty Oilfield Chemicals Industry Volume (K Tons) Forecast, by Application 2020 & 2033
- Table 73: Global Specialty Oilfield Chemicals Industry Revenue million Forecast, by Chemical Type 2020 & 2033
- Table 74: Global Specialty Oilfield Chemicals Industry Volume K Tons Forecast, by Chemical Type 2020 & 2033
- Table 75: Global Specialty Oilfield Chemicals Industry Revenue million Forecast, by Application 2020 & 2033
- Table 76: Global Specialty Oilfield Chemicals Industry Volume K Tons Forecast, by Application 2020 & 2033
- Table 77: Global Specialty Oilfield Chemicals Industry Revenue million Forecast, by Country 2020 & 2033
- Table 78: Global Specialty Oilfield Chemicals Industry Volume K Tons Forecast, by Country 2020 & 2033
- Table 79: Algeria Specialty Oilfield Chemicals Industry Revenue (million) Forecast, by Application 2020 & 2033
- Table 80: Algeria Specialty Oilfield Chemicals Industry Volume (K Tons) Forecast, by Application 2020 & 2033
- Table 81: Iran Specialty Oilfield Chemicals Industry Revenue (million) Forecast, by Application 2020 & 2033
- Table 82: Iran Specialty Oilfield Chemicals Industry Volume (K Tons) Forecast, by Application 2020 & 2033
- Table 83: Iraq Specialty Oilfield Chemicals Industry Revenue (million) Forecast, by Application 2020 & 2033
- Table 84: Iraq Specialty Oilfield Chemicals Industry Volume (K Tons) Forecast, by Application 2020 & 2033
- Table 85: Nigeria Specialty Oilfield Chemicals Industry Revenue (million) Forecast, by Application 2020 & 2033
- Table 86: Nigeria Specialty Oilfield Chemicals Industry Volume (K Tons) Forecast, by Application 2020 & 2033
- Table 87: Saudi Arabia Specialty Oilfield Chemicals Industry Revenue (million) Forecast, by Application 2020 & 2033
- Table 88: Saudi Arabia Specialty Oilfield Chemicals Industry Volume (K Tons) Forecast, by Application 2020 & 2033
- Table 89: Rest of Middle East and Africa Specialty Oilfield Chemicals Industry Revenue (million) Forecast, by Application 2020 & 2033
- Table 90: Rest of Middle East and Africa Specialty Oilfield Chemicals Industry Volume (K Tons) Forecast, by Application 2020 & 2033
Frequently Asked Questions
1. What is the projected Compound Annual Growth Rate (CAGR) of the Specialty Oilfield Chemicals Industry?
The projected CAGR is approximately 3.2%.
2. Which companies are prominent players in the Specialty Oilfield Chemicals Industry?
Key companies in the market include Clariant, CES Energy Solutions Corp, Chevron Phillips Chemical Company (Drilling Specialties Company), Nouryon, Zirax Limited, Solvay, Innospec Oilfield Services, Ecolab (NALCO Champion), Elementis PLC, Croda International PLC, Ashland, BASF SE, Huntsman International LLC, Kemira, Dow, Flotek Industries Inc, The Lubrizol Corporation, Baker Hughes Company, Halliburton, MPRC, Schlumberger Limited, Albemarle Corporation.
3. What are the main segments of the Specialty Oilfield Chemicals Industry?
The market segments include Chemical Type, Application.
4. Can you provide details about the market size?
The market size is estimated to be USD 29861.3 million as of 2022.
5. What are some drivers contributing to market growth?
Increased Shale Gas Exploration and Production; Rising Demand for Petroleum-based Fuel from the Transportation Industry.
6. What are the notable trends driving market growth?
Drilling and Cementing Application to Dominate the Market.
7. Are there any restraints impacting market growth?
Clean Energy Initiatives.
8. Can you provide examples of recent developments in the market?
December 2022: Champion X announced the opening of a new oilfield services chemicals lab and distribution facility in Chaguaramas, Trinidad. This lab facility will perform various analysis tests such as corrosion coupon analysis, chemical compatibility testing, and bacteria level determination in produced water.
9. What pricing options are available for accessing the report?
Pricing options include single-user, multi-user, and enterprise licenses priced at USD 3,950, USD 4,950, and USD 6,950 respectively.
10. Is the market size provided in terms of value or volume?
The market size is provided in terms of value, measured in million and volume, measured in K Tons.
11. Are there any specific market keywords associated with the report?
Yes, the market keyword associated with the report is "Specialty Oilfield Chemicals Industry," which aids in identifying and referencing the specific market segment covered.
12. How do I determine which pricing option suits my needs best?
The pricing options vary based on user requirements and access needs. Individual users may opt for single-user licenses, while businesses requiring broader access may choose multi-user or enterprise licenses for cost-effective access to the report.
13. Are there any additional resources or data provided in the Specialty Oilfield Chemicals Industry report?
While the report offers comprehensive insights, it's advisable to review the specific contents or supplementary materials provided to ascertain if additional resources or data are available.
14. How can I stay updated on further developments or reports in the Specialty Oilfield Chemicals Industry?
To stay informed about further developments, trends, and reports in the Specialty Oilfield Chemicals Industry, consider subscribing to industry newsletters, following relevant companies and organizations, or regularly checking reputable industry news sources and publications.
Methodology
Step 1 - Identification of Relevant Samples Size from Population Database


Step 2 - Approaches for Defining Global Market Size (Value, Volume* & Price*)

Note*: In applicable scenarios
Step 3 - Data Sources
Primary Research
- Web Analytics
- Survey Reports
- Research Institute
- Latest Research Reports
- Opinion Leaders
Secondary Research
- Annual Reports
- White Paper
- Latest Press Release
- Industry Association
- Paid Database
- Investor Presentations

Step 4 - Data Triangulation
Involves using different sources of information in order to increase the validity of a study
These sources are likely to be stakeholders in a program - participants, other researchers, program staff, other community members, and so on.
Then we put all data in single framework & apply various statistical tools to find out the dynamic on the market.
During the analysis stage, feedback from the stakeholder groups would be compared to determine areas of agreement as well as areas of divergence