

Key Insights
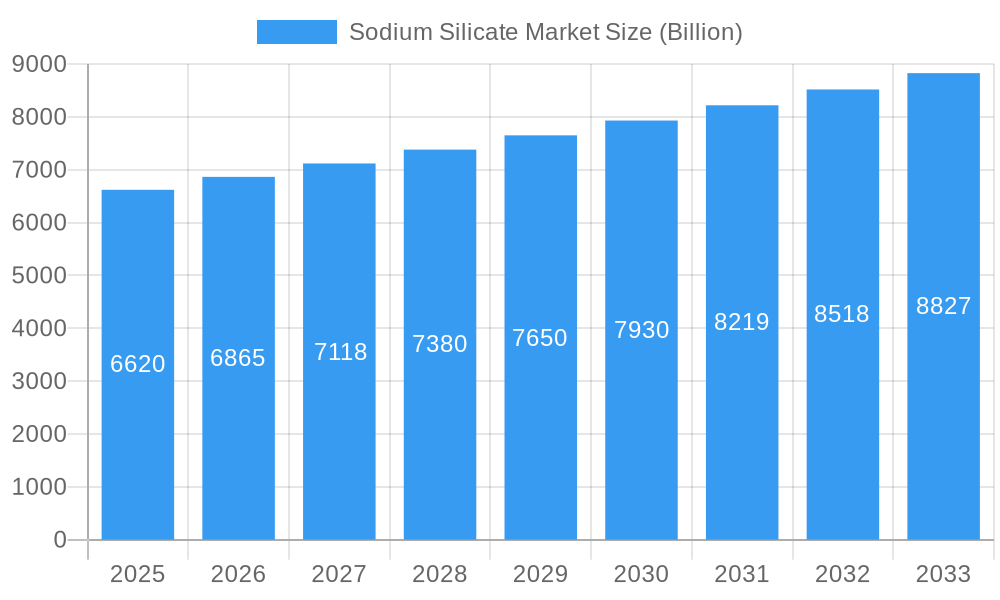
The global sodium silicate market, valued at $6.62 billion in 2025, is projected to experience steady growth, driven by its diverse applications across various industries. A compound annual growth rate (CAGR) of 3.6% from 2025 to 2033 indicates a robust and sustained market expansion. Key drivers include the increasing demand for construction materials, particularly in developing economies experiencing rapid urbanization and infrastructure development. The rising popularity of eco-friendly and sustainable building products further fuels this demand, as sodium silicate offers a viable, environmentally benign alternative in applications like adhesives and binders. The detergents and water treatment sectors also contribute significantly to market growth, relying on sodium silicate's excellent cleaning and water purification properties. Furthermore, the food preservation industry utilizes sodium silicate as a food additive and preservative, underpinning consistent demand. While potential restraints like price fluctuations in raw materials and the emergence of substitute chemicals exist, the overall market outlook remains positive, propelled by the continuous expansion of key application sectors and the inherent advantages of sodium silicate in terms of cost-effectiveness and environmental friendliness. Segmentation within the market reveals significant opportunities in both solid and liquid forms, with applications across adhesives and paints, detergents, food preservation, precipitated silica production, paper manufacturing, and water treatment dominating market share. Geographic analysis reveals strong growth potential in Asia-Pacific, driven by the rapid industrialization and infrastructure development in countries like China and India.
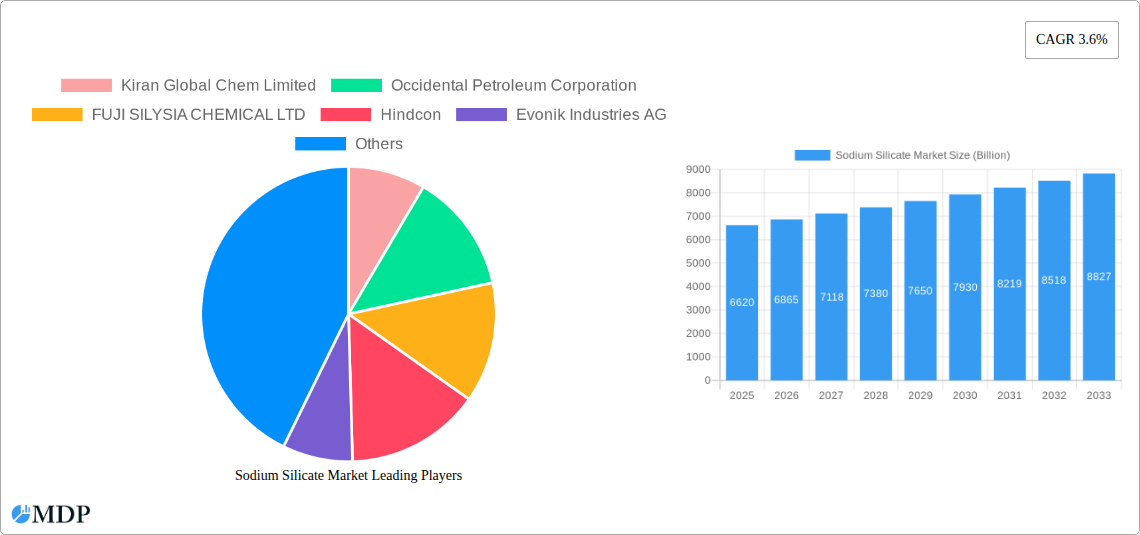
Sodium Silicate Market Market Size (In Billion)
The competitive landscape features a mix of established global players like BASF SE, Evonik Industries AG, and PQ Corporation, alongside regional players catering to specific market segments. These companies are engaged in continuous product development and innovation, focusing on enhancing performance characteristics and expanding into new application areas. Strategic partnerships and mergers and acquisitions are anticipated to shape the competitive dynamics in the coming years, driving further consolidation within the industry. The market’s future growth will depend on continued technological advancements, sustainable manufacturing practices, and addressing regulatory challenges related to environmental impact and safety. This balanced view of drivers, restraints, and opportunities underscores the sodium silicate market's long-term viability and continued growth trajectory.
Sodium Silicate Market Company Market Share
Sodium Silicate Market Report: A Comprehensive Analysis (2019-2033)
This comprehensive report provides an in-depth analysis of the global Sodium Silicate market, offering invaluable insights for stakeholders across the value chain. With a study period spanning 2019-2033, a base year of 2025, and a forecast period of 2025-2033, this report utilizes rigorous data analysis and expert forecasting to paint a complete picture of market dynamics, trends, and future potential. The market is expected to reach a value of xx Billion by 2033, presenting substantial opportunities for growth and investment. High-impact keywords such as "Sodium Silicate Market," "Market Size," "Market Share," "Market Growth," "Industry Analysis," and "Competitive Landscape" are strategically woven throughout to enhance search engine optimization (SEO).
Sodium Silicate Market Market Dynamics & Concentration
The global Sodium Silicate market exhibits a moderately concentrated landscape, with key players holding significant market share. Market concentration is influenced by factors such as economies of scale, technological advancements, and established brand recognition. The market share of the top five players is estimated to be approximately xx%, with the remaining share distributed among numerous regional and smaller players.
Market Dynamics:
- Innovation Drivers: Continuous R&D efforts focused on developing eco-friendly and high-performance sodium silicate variants are driving market growth. This includes advancements in production techniques, leading to improved purity and cost-effectiveness.
- Regulatory Frameworks: Stringent environmental regulations related to chemical usage and disposal are influencing the adoption of sustainable sodium silicate solutions.
- Product Substitutes: The presence of alternative binders and adhesives creates competitive pressure, though sodium silicate retains a competitive edge due to its cost-effectiveness and versatile applications.
- End-User Trends: Growing demand from key end-use industries such as construction, detergents, and water treatment fuels market expansion. Shifting consumer preferences towards sustainable products are also influencing demand.
- M&A Activities: The market has witnessed xx M&A deals in the past five years, demonstrating strategic consolidation among key players to expand market share and product portfolios.
Sodium Silicate Market Industry Trends & Analysis
The Sodium Silicate market is experiencing robust growth, driven by a CAGR of xx% during the forecast period (2025-2033). This expansion is primarily attributed to the increasing demand across diverse application sectors. The market penetration of sodium silicate in emerging economies is also accelerating, contributing significantly to overall growth. Technological advancements, such as the development of specialized grades with enhanced properties, are further boosting market expansion. However, fluctuating raw material prices and intense competition among producers pose challenges to sustained high growth. Consumer preferences are shifting towards sustainable and environmentally friendly products which is driving innovation in the manufacturing process.
Leading Markets & Segments in Sodium Silicate Market
The Asia-Pacific region is currently the dominant market for sodium silicate, driven by rapid industrialization, expanding construction activities, and the burgeoning detergent industry. Within the application segments, Adhesives & Paints, and Detergents account for the largest shares, exhibiting substantial growth potential over the forecast period.
Key Drivers by Segment:
- Adhesives & Paints: Increasing demand for construction materials and growth in the coatings industry.
- Detergents: Rising household disposable income and increased demand for effective and economical cleaning products.
- Food Preservation: Stringent food safety regulations and increasing demand for extending shelf life of food products.
- Paper Production: Growth in the packaging industry and rising demand for high-quality paper products.
- Water Treatment: Increasing awareness of water pollution and the need for efficient water purification solutions.
Regional Dominance Analysis: The Asia-Pacific region's dominance is fueled by robust economic growth, expanding infrastructure projects, and a growing middle class, all driving strong demand for sodium silicate.
Sodium Silicate Market Product Developments
Recent product developments focus on enhancing the performance characteristics of sodium silicate, including improved viscosity, enhanced bonding strength, and enhanced water solubility. This is achieved through innovative production techniques and the use of advanced additives. These improvements cater to the diverse needs of end-use industries and enhance the competitive edge of sodium silicate in the market.
Key Drivers of Sodium Silicate Market Growth
The Sodium Silicate market's growth is propelled by several factors:
- Technological advancements: Development of high-performance sodium silicate grades with superior properties.
- Economic growth: Expansion of construction and industrial sectors in developing economies.
- Stringent environmental regulations: Demand for eco-friendly alternatives in various industries.
Challenges in the Sodium Silicate Market Market
The Sodium Silicate market faces several challenges:
- Fluctuating raw material prices: Impacting production costs and profitability.
- Intense competition: Pressure from existing and new market entrants.
- Supply chain disruptions: Potential delays and cost increases due to geopolitical instability.
Emerging Opportunities in Sodium Silicate Market
The Sodium Silicate market presents significant long-term growth opportunities through:
- Strategic partnerships: Collaborations between producers and end-users to develop tailored solutions.
- Technological breakthroughs: Innovations in production processes and new applications will drive further growth.
- Market expansion: Increased penetration into emerging economies with high growth potential.
Leading Players in the Sodium Silicate Market Sector
- Kiran Global Chem Limited
- Occidental Petroleum Corporation
- FUJI SILYSIA CHEMICAL LTD
- Hindcon
- Evonik Industries AG
- Silmaco
- BASF SE
- PQ Corporation
- Z Ch Rudniki S A
- C THAI GROUP
- Alumina doo Zvornik
- W R Grace & Co -Conn
- CIECH Group
Key Milestones in Sodium Silicate Market Industry
- September 2022: Evonik's strategic cooperation with Porner Group and Phichit Bio Power Co., Ltd. for supplying sustainable ULTRASIL precipitated silica to tire manufacturers signifies a significant shift towards sustainable production and highlights the growing demand for eco-friendly materials within the industry. This strategic move is expected to increase market share for Evonik in the precipitated silica segment.
Strategic Outlook for Sodium Silicate Market Market
The Sodium Silicate market exhibits strong growth potential, driven by increasing demand from key end-use sectors, particularly construction, detergents, and water treatment. Strategic investments in R&D, focusing on sustainable production methods and enhanced product performance, will be crucial for sustained growth. Expansion into new geographical markets and strategic partnerships will be key to capturing increased market share and maximizing long-term profitability.
Sodium Silicate Market Segmentation
-
1. Type
- 1.1. Solid
- 1.2. Liquid
-
2. Application
- 2.1. Adhesives and Paints
- 2.2. Detergents
- 2.3. Food Preservation
- 2.4. Precipitated Silica
- 2.5. Paper Production
- 2.6. Water Treatment
- 2.7. Other Applications (Construction, Metal Casting)
Sodium Silicate Market Segmentation By Geography
-
1. Asia Pacific
- 1.1. China
- 1.2. India
- 1.3. Japan
- 1.4. South Korea
- 1.5. Rest of Asia Pacific
-
2. North America
- 2.1. United States
- 2.2. Canada
- 2.3. Mexico
-
3. Europe
- 3.1. Germany
- 3.2. United Kingdom
- 3.3. Italy
- 3.4. France
- 3.5. Rest of Europe
-
4. South America
- 4.1. Brazil
- 4.2. Argentina
- 4.3. Rest of South America
-
5. Middle East and Africa
- 5.1. Saudi Arabia
- 5.2. South Africa
- 5.3. Rest of Middle East and Africa
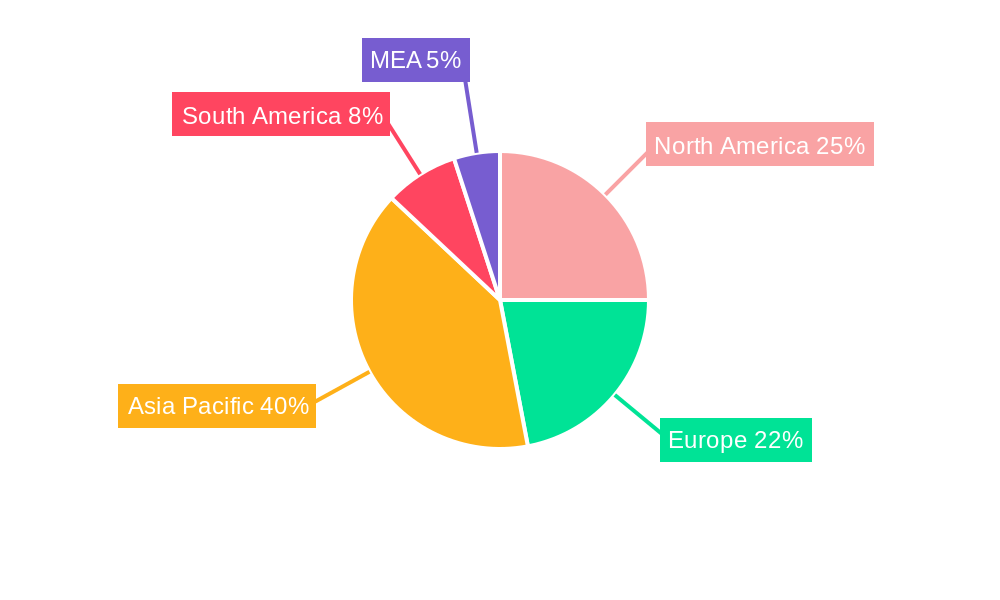
Sodium Silicate Market Regional Market Share
Geographic Coverage of Sodium Silicate Market
Sodium Silicate Market REPORT HIGHLIGHTS
| Aspects | Details |
|---|---|
| Study Period | 2020-2034 |
| Base Year | 2025 |
| Estimated Year | 2026 |
| Forecast Period | 2026-2034 |
| Historical Period | 2020-2025 |
| Growth Rate | CAGR of 3.6% from 2020-2034 |
| Segmentation |
|
Table of Contents
- 1. Introduction
- 1.1. Research Scope
- 1.2. Market Segmentation
- 1.3. Research Objective
- 1.4. Definitions and Assumptions
- 2. Executive Summary
- 2.1. Market Snapshot
- 3. Market Dynamics
- 3.1. Market Drivers
- 3.2. Market Restrains
- 3.3. Market Trends
- 3.4. Market Opportunities
- 4. Market Factor Analysis
- 4.1. Porters Five Forces
- 4.1.1. Bargaining Power of Suppliers
- 4.1.2. Bargaining Power of Buyers
- 4.1.3. Threat of New Entrants
- 4.1.4. Threat of Substitutes
- 4.1.5. Competitive Rivalry
- 4.2. PESTEL analysis
- 4.3. BCG Analysis
- 4.3.1. Stars (High Growth, High Market Share)
- 4.3.2. Cash Cows (Low Growth, High Market Share)
- 4.3.3. Question Mark (High Growth, Low Market Share)
- 4.3.4. Dogs (Low Growth, Low Market Share)
- 4.4. Ansoff Matrix Analysis
- 4.5. Supply Chain Analysis
- 4.6. Regulatory Landscape
- 4.7. Current Market Potential and Opportunity Assessment (TAM–SAM–SOM Framework)
- 4.8. MDP Analyst Note
- 4.1. Porters Five Forces
- 5. Market Analysis, Insights and Forecast 2021-2033
- 5.1. Market Analysis, Insights and Forecast - by Type
- 5.1.1. Solid
- 5.1.2. Liquid
- 5.2. Market Analysis, Insights and Forecast - by Application
- 5.2.1. Adhesives and Paints
- 5.2.2. Detergents
- 5.2.3. Food Preservation
- 5.2.4. Precipitated Silica
- 5.2.5. Paper Production
- 5.2.6. Water Treatment
- 5.2.7. Other Applications (Construction, Metal Casting)
- 5.3. Market Analysis, Insights and Forecast - by Region
- 5.3.1. Asia Pacific
- 5.3.2. North America
- 5.3.3. Europe
- 5.3.4. South America
- 5.3.5. Middle East and Africa
- 5.1. Market Analysis, Insights and Forecast - by Type
- 6. Global Sodium Silicate Market Analysis, Insights and Forecast, 2021-2033
- 6.1. Market Analysis, Insights and Forecast - by Type
- 6.1.1. Solid
- 6.1.2. Liquid
- 6.2. Market Analysis, Insights and Forecast - by Application
- 6.2.1. Adhesives and Paints
- 6.2.2. Detergents
- 6.2.3. Food Preservation
- 6.2.4. Precipitated Silica
- 6.2.5. Paper Production
- 6.2.6. Water Treatment
- 6.2.7. Other Applications (Construction, Metal Casting)
- 6.1. Market Analysis, Insights and Forecast - by Type
- 7. Asia Pacific Sodium Silicate Market Analysis, Insights and Forecast, 2020-2032
- 7.1. Market Analysis, Insights and Forecast - by Type
- 7.1.1. Solid
- 7.1.2. Liquid
- 7.2. Market Analysis, Insights and Forecast - by Application
- 7.2.1. Adhesives and Paints
- 7.2.2. Detergents
- 7.2.3. Food Preservation
- 7.2.4. Precipitated Silica
- 7.2.5. Paper Production
- 7.2.6. Water Treatment
- 7.2.7. Other Applications (Construction, Metal Casting)
- 7.1. Market Analysis, Insights and Forecast - by Type
- 8. North America Sodium Silicate Market Analysis, Insights and Forecast, 2020-2032
- 8.1. Market Analysis, Insights and Forecast - by Type
- 8.1.1. Solid
- 8.1.2. Liquid
- 8.2. Market Analysis, Insights and Forecast - by Application
- 8.2.1. Adhesives and Paints
- 8.2.2. Detergents
- 8.2.3. Food Preservation
- 8.2.4. Precipitated Silica
- 8.2.5. Paper Production
- 8.2.6. Water Treatment
- 8.2.7. Other Applications (Construction, Metal Casting)
- 8.1. Market Analysis, Insights and Forecast - by Type
- 9. Europe Sodium Silicate Market Analysis, Insights and Forecast, 2020-2032
- 9.1. Market Analysis, Insights and Forecast - by Type
- 9.1.1. Solid
- 9.1.2. Liquid
- 9.2. Market Analysis, Insights and Forecast - by Application
- 9.2.1. Adhesives and Paints
- 9.2.2. Detergents
- 9.2.3. Food Preservation
- 9.2.4. Precipitated Silica
- 9.2.5. Paper Production
- 9.2.6. Water Treatment
- 9.2.7. Other Applications (Construction, Metal Casting)
- 9.1. Market Analysis, Insights and Forecast - by Type
- 10. South America Sodium Silicate Market Analysis, Insights and Forecast, 2020-2032
- 10.1. Market Analysis, Insights and Forecast - by Type
- 10.1.1. Solid
- 10.1.2. Liquid
- 10.2. Market Analysis, Insights and Forecast - by Application
- 10.2.1. Adhesives and Paints
- 10.2.2. Detergents
- 10.2.3. Food Preservation
- 10.2.4. Precipitated Silica
- 10.2.5. Paper Production
- 10.2.6. Water Treatment
- 10.2.7. Other Applications (Construction, Metal Casting)
- 10.1. Market Analysis, Insights and Forecast - by Type
- 11. Middle East and Africa Sodium Silicate Market Analysis, Insights and Forecast, 2020-2032
- 11.1. Market Analysis, Insights and Forecast - by Type
- 11.1.1. Solid
- 11.1.2. Liquid
- 11.2. Market Analysis, Insights and Forecast - by Application
- 11.2.1. Adhesives and Paints
- 11.2.2. Detergents
- 11.2.3. Food Preservation
- 11.2.4. Precipitated Silica
- 11.2.5. Paper Production
- 11.2.6. Water Treatment
- 11.2.7. Other Applications (Construction, Metal Casting)
- 11.1. Market Analysis, Insights and Forecast - by Type
- 12. Competitive Analysis
- 12.1. Company Profiles
- 12.1.1 Kiran Global Chem Limited
- 12.1.1.1. Company Overview
- 12.1.1.2. Products
- 12.1.1.3. Company Financials
- 12.1.1.4. SWOT Analysis
- 12.1.2 Occidental Petroleum Corporation
- 12.1.2.1. Company Overview
- 12.1.2.2. Products
- 12.1.2.3. Company Financials
- 12.1.2.4. SWOT Analysis
- 12.1.3 FUJI SILYSIA CHEMICAL LTD
- 12.1.3.1. Company Overview
- 12.1.3.2. Products
- 12.1.3.3. Company Financials
- 12.1.3.4. SWOT Analysis
- 12.1.4 Hindcon
- 12.1.4.1. Company Overview
- 12.1.4.2. Products
- 12.1.4.3. Company Financials
- 12.1.4.4. SWOT Analysis
- 12.1.5 Evonik Industries AG
- 12.1.5.1. Company Overview
- 12.1.5.2. Products
- 12.1.5.3. Company Financials
- 12.1.5.4. SWOT Analysis
- 12.1.6 Silmaco
- 12.1.6.1. Company Overview
- 12.1.6.2. Products
- 12.1.6.3. Company Financials
- 12.1.6.4. SWOT Analysis
- 12.1.7 BASF SE
- 12.1.7.1. Company Overview
- 12.1.7.2. Products
- 12.1.7.3. Company Financials
- 12.1.7.4. SWOT Analysis
- 12.1.8 PQ Corporation
- 12.1.8.1. Company Overview
- 12.1.8.2. Products
- 12.1.8.3. Company Financials
- 12.1.8.4. SWOT Analysis
- 12.1.9 Z Ch Rudniki S A
- 12.1.9.1. Company Overview
- 12.1.9.2. Products
- 12.1.9.3. Company Financials
- 12.1.9.4. SWOT Analysis
- 12.1.10 C THAI GROUP
- 12.1.10.1. Company Overview
- 12.1.10.2. Products
- 12.1.10.3. Company Financials
- 12.1.10.4. SWOT Analysis
- 12.1.11 Alumina doo Zvornik
- 12.1.11.1. Company Overview
- 12.1.11.2. Products
- 12.1.11.3. Company Financials
- 12.1.11.4. SWOT Analysis
- 12.1.12 W R Grace & Co -Conn
- 12.1.12.1. Company Overview
- 12.1.12.2. Products
- 12.1.12.3. Company Financials
- 12.1.12.4. SWOT Analysis
- 12.1.13 CIECH Group
- 12.1.13.1. Company Overview
- 12.1.13.2. Products
- 12.1.13.3. Company Financials
- 12.1.13.4. SWOT Analysis
- 12.1.1 Kiran Global Chem Limited
- 12.2. Market Entropy
- 12.2.1 Company's Key Areas Served
- 12.2.2 Recent Developments
- 12.3. Company Market Share Analysis 2025
- 12.3.1 Top 5 Companies Market Share Analysis
- 12.3.2 Top 3 Companies Market Share Analysis
- 12.4. List of Potential Customers
- 13. Research Methodology
List of Figures
- Figure 1: Global Sodium Silicate Market Revenue Breakdown (Billion, %) by Region 2025 & 2033
- Figure 2: Global Sodium Silicate Market Volume Breakdown (K Tons, %) by Region 2025 & 2033
- Figure 3: Asia Pacific Sodium Silicate Market Revenue (Billion), by Type 2025 & 2033
- Figure 4: Asia Pacific Sodium Silicate Market Volume (K Tons), by Type 2025 & 2033
- Figure 5: Asia Pacific Sodium Silicate Market Revenue Share (%), by Type 2025 & 2033
- Figure 6: Asia Pacific Sodium Silicate Market Volume Share (%), by Type 2025 & 2033
- Figure 7: Asia Pacific Sodium Silicate Market Revenue (Billion), by Application 2025 & 2033
- Figure 8: Asia Pacific Sodium Silicate Market Volume (K Tons), by Application 2025 & 2033
- Figure 9: Asia Pacific Sodium Silicate Market Revenue Share (%), by Application 2025 & 2033
- Figure 10: Asia Pacific Sodium Silicate Market Volume Share (%), by Application 2025 & 2033
- Figure 11: Asia Pacific Sodium Silicate Market Revenue (Billion), by Country 2025 & 2033
- Figure 12: Asia Pacific Sodium Silicate Market Volume (K Tons), by Country 2025 & 2033
- Figure 13: Asia Pacific Sodium Silicate Market Revenue Share (%), by Country 2025 & 2033
- Figure 14: Asia Pacific Sodium Silicate Market Volume Share (%), by Country 2025 & 2033
- Figure 15: North America Sodium Silicate Market Revenue (Billion), by Type 2025 & 2033
- Figure 16: North America Sodium Silicate Market Volume (K Tons), by Type 2025 & 2033
- Figure 17: North America Sodium Silicate Market Revenue Share (%), by Type 2025 & 2033
- Figure 18: North America Sodium Silicate Market Volume Share (%), by Type 2025 & 2033
- Figure 19: North America Sodium Silicate Market Revenue (Billion), by Application 2025 & 2033
- Figure 20: North America Sodium Silicate Market Volume (K Tons), by Application 2025 & 2033
- Figure 21: North America Sodium Silicate Market Revenue Share (%), by Application 2025 & 2033
- Figure 22: North America Sodium Silicate Market Volume Share (%), by Application 2025 & 2033
- Figure 23: North America Sodium Silicate Market Revenue (Billion), by Country 2025 & 2033
- Figure 24: North America Sodium Silicate Market Volume (K Tons), by Country 2025 & 2033
- Figure 25: North America Sodium Silicate Market Revenue Share (%), by Country 2025 & 2033
- Figure 26: North America Sodium Silicate Market Volume Share (%), by Country 2025 & 2033
- Figure 27: Europe Sodium Silicate Market Revenue (Billion), by Type 2025 & 2033
- Figure 28: Europe Sodium Silicate Market Volume (K Tons), by Type 2025 & 2033
- Figure 29: Europe Sodium Silicate Market Revenue Share (%), by Type 2025 & 2033
- Figure 30: Europe Sodium Silicate Market Volume Share (%), by Type 2025 & 2033
- Figure 31: Europe Sodium Silicate Market Revenue (Billion), by Application 2025 & 2033
- Figure 32: Europe Sodium Silicate Market Volume (K Tons), by Application 2025 & 2033
- Figure 33: Europe Sodium Silicate Market Revenue Share (%), by Application 2025 & 2033
- Figure 34: Europe Sodium Silicate Market Volume Share (%), by Application 2025 & 2033
- Figure 35: Europe Sodium Silicate Market Revenue (Billion), by Country 2025 & 2033
- Figure 36: Europe Sodium Silicate Market Volume (K Tons), by Country 2025 & 2033
- Figure 37: Europe Sodium Silicate Market Revenue Share (%), by Country 2025 & 2033
- Figure 38: Europe Sodium Silicate Market Volume Share (%), by Country 2025 & 2033
- Figure 39: South America Sodium Silicate Market Revenue (Billion), by Type 2025 & 2033
- Figure 40: South America Sodium Silicate Market Volume (K Tons), by Type 2025 & 2033
- Figure 41: South America Sodium Silicate Market Revenue Share (%), by Type 2025 & 2033
- Figure 42: South America Sodium Silicate Market Volume Share (%), by Type 2025 & 2033
- Figure 43: South America Sodium Silicate Market Revenue (Billion), by Application 2025 & 2033
- Figure 44: South America Sodium Silicate Market Volume (K Tons), by Application 2025 & 2033
- Figure 45: South America Sodium Silicate Market Revenue Share (%), by Application 2025 & 2033
- Figure 46: South America Sodium Silicate Market Volume Share (%), by Application 2025 & 2033
- Figure 47: South America Sodium Silicate Market Revenue (Billion), by Country 2025 & 2033
- Figure 48: South America Sodium Silicate Market Volume (K Tons), by Country 2025 & 2033
- Figure 49: South America Sodium Silicate Market Revenue Share (%), by Country 2025 & 2033
- Figure 50: South America Sodium Silicate Market Volume Share (%), by Country 2025 & 2033
- Figure 51: Middle East and Africa Sodium Silicate Market Revenue (Billion), by Type 2025 & 2033
- Figure 52: Middle East and Africa Sodium Silicate Market Volume (K Tons), by Type 2025 & 2033
- Figure 53: Middle East and Africa Sodium Silicate Market Revenue Share (%), by Type 2025 & 2033
- Figure 54: Middle East and Africa Sodium Silicate Market Volume Share (%), by Type 2025 & 2033
- Figure 55: Middle East and Africa Sodium Silicate Market Revenue (Billion), by Application 2025 & 2033
- Figure 56: Middle East and Africa Sodium Silicate Market Volume (K Tons), by Application 2025 & 2033
- Figure 57: Middle East and Africa Sodium Silicate Market Revenue Share (%), by Application 2025 & 2033
- Figure 58: Middle East and Africa Sodium Silicate Market Volume Share (%), by Application 2025 & 2033
- Figure 59: Middle East and Africa Sodium Silicate Market Revenue (Billion), by Country 2025 & 2033
- Figure 60: Middle East and Africa Sodium Silicate Market Volume (K Tons), by Country 2025 & 2033
- Figure 61: Middle East and Africa Sodium Silicate Market Revenue Share (%), by Country 2025 & 2033
- Figure 62: Middle East and Africa Sodium Silicate Market Volume Share (%), by Country 2025 & 2033
List of Tables
- Table 1: Global Sodium Silicate Market Revenue Billion Forecast, by Type 2020 & 2033
- Table 2: Global Sodium Silicate Market Volume K Tons Forecast, by Type 2020 & 2033
- Table 3: Global Sodium Silicate Market Revenue Billion Forecast, by Application 2020 & 2033
- Table 4: Global Sodium Silicate Market Volume K Tons Forecast, by Application 2020 & 2033
- Table 5: Global Sodium Silicate Market Revenue Billion Forecast, by Region 2020 & 2033
- Table 6: Global Sodium Silicate Market Volume K Tons Forecast, by Region 2020 & 2033
- Table 7: Global Sodium Silicate Market Revenue Billion Forecast, by Type 2020 & 2033
- Table 8: Global Sodium Silicate Market Volume K Tons Forecast, by Type 2020 & 2033
- Table 9: Global Sodium Silicate Market Revenue Billion Forecast, by Application 2020 & 2033
- Table 10: Global Sodium Silicate Market Volume K Tons Forecast, by Application 2020 & 2033
- Table 11: Global Sodium Silicate Market Revenue Billion Forecast, by Country 2020 & 2033
- Table 12: Global Sodium Silicate Market Volume K Tons Forecast, by Country 2020 & 2033
- Table 13: China Sodium Silicate Market Revenue (Billion) Forecast, by Application 2020 & 2033
- Table 14: China Sodium Silicate Market Volume (K Tons) Forecast, by Application 2020 & 2033
- Table 15: India Sodium Silicate Market Revenue (Billion) Forecast, by Application 2020 & 2033
- Table 16: India Sodium Silicate Market Volume (K Tons) Forecast, by Application 2020 & 2033
- Table 17: Japan Sodium Silicate Market Revenue (Billion) Forecast, by Application 2020 & 2033
- Table 18: Japan Sodium Silicate Market Volume (K Tons) Forecast, by Application 2020 & 2033
- Table 19: South Korea Sodium Silicate Market Revenue (Billion) Forecast, by Application 2020 & 2033
- Table 20: South Korea Sodium Silicate Market Volume (K Tons) Forecast, by Application 2020 & 2033
- Table 21: Rest of Asia Pacific Sodium Silicate Market Revenue (Billion) Forecast, by Application 2020 & 2033
- Table 22: Rest of Asia Pacific Sodium Silicate Market Volume (K Tons) Forecast, by Application 2020 & 2033
- Table 23: Global Sodium Silicate Market Revenue Billion Forecast, by Type 2020 & 2033
- Table 24: Global Sodium Silicate Market Volume K Tons Forecast, by Type 2020 & 2033
- Table 25: Global Sodium Silicate Market Revenue Billion Forecast, by Application 2020 & 2033
- Table 26: Global Sodium Silicate Market Volume K Tons Forecast, by Application 2020 & 2033
- Table 27: Global Sodium Silicate Market Revenue Billion Forecast, by Country 2020 & 2033
- Table 28: Global Sodium Silicate Market Volume K Tons Forecast, by Country 2020 & 2033
- Table 29: United States Sodium Silicate Market Revenue (Billion) Forecast, by Application 2020 & 2033
- Table 30: United States Sodium Silicate Market Volume (K Tons) Forecast, by Application 2020 & 2033
- Table 31: Canada Sodium Silicate Market Revenue (Billion) Forecast, by Application 2020 & 2033
- Table 32: Canada Sodium Silicate Market Volume (K Tons) Forecast, by Application 2020 & 2033
- Table 33: Mexico Sodium Silicate Market Revenue (Billion) Forecast, by Application 2020 & 2033
- Table 34: Mexico Sodium Silicate Market Volume (K Tons) Forecast, by Application 2020 & 2033
- Table 35: Global Sodium Silicate Market Revenue Billion Forecast, by Type 2020 & 2033
- Table 36: Global Sodium Silicate Market Volume K Tons Forecast, by Type 2020 & 2033
- Table 37: Global Sodium Silicate Market Revenue Billion Forecast, by Application 2020 & 2033
- Table 38: Global Sodium Silicate Market Volume K Tons Forecast, by Application 2020 & 2033
- Table 39: Global Sodium Silicate Market Revenue Billion Forecast, by Country 2020 & 2033
- Table 40: Global Sodium Silicate Market Volume K Tons Forecast, by Country 2020 & 2033
- Table 41: Germany Sodium Silicate Market Revenue (Billion) Forecast, by Application 2020 & 2033
- Table 42: Germany Sodium Silicate Market Volume (K Tons) Forecast, by Application 2020 & 2033
- Table 43: United Kingdom Sodium Silicate Market Revenue (Billion) Forecast, by Application 2020 & 2033
- Table 44: United Kingdom Sodium Silicate Market Volume (K Tons) Forecast, by Application 2020 & 2033
- Table 45: Italy Sodium Silicate Market Revenue (Billion) Forecast, by Application 2020 & 2033
- Table 46: Italy Sodium Silicate Market Volume (K Tons) Forecast, by Application 2020 & 2033
- Table 47: France Sodium Silicate Market Revenue (Billion) Forecast, by Application 2020 & 2033
- Table 48: France Sodium Silicate Market Volume (K Tons) Forecast, by Application 2020 & 2033
- Table 49: Rest of Europe Sodium Silicate Market Revenue (Billion) Forecast, by Application 2020 & 2033
- Table 50: Rest of Europe Sodium Silicate Market Volume (K Tons) Forecast, by Application 2020 & 2033
- Table 51: Global Sodium Silicate Market Revenue Billion Forecast, by Type 2020 & 2033
- Table 52: Global Sodium Silicate Market Volume K Tons Forecast, by Type 2020 & 2033
- Table 53: Global Sodium Silicate Market Revenue Billion Forecast, by Application 2020 & 2033
- Table 54: Global Sodium Silicate Market Volume K Tons Forecast, by Application 2020 & 2033
- Table 55: Global Sodium Silicate Market Revenue Billion Forecast, by Country 2020 & 2033
- Table 56: Global Sodium Silicate Market Volume K Tons Forecast, by Country 2020 & 2033
- Table 57: Brazil Sodium Silicate Market Revenue (Billion) Forecast, by Application 2020 & 2033
- Table 58: Brazil Sodium Silicate Market Volume (K Tons) Forecast, by Application 2020 & 2033
- Table 59: Argentina Sodium Silicate Market Revenue (Billion) Forecast, by Application 2020 & 2033
- Table 60: Argentina Sodium Silicate Market Volume (K Tons) Forecast, by Application 2020 & 2033
- Table 61: Rest of South America Sodium Silicate Market Revenue (Billion) Forecast, by Application 2020 & 2033
- Table 62: Rest of South America Sodium Silicate Market Volume (K Tons) Forecast, by Application 2020 & 2033
- Table 63: Global Sodium Silicate Market Revenue Billion Forecast, by Type 2020 & 2033
- Table 64: Global Sodium Silicate Market Volume K Tons Forecast, by Type 2020 & 2033
- Table 65: Global Sodium Silicate Market Revenue Billion Forecast, by Application 2020 & 2033
- Table 66: Global Sodium Silicate Market Volume K Tons Forecast, by Application 2020 & 2033
- Table 67: Global Sodium Silicate Market Revenue Billion Forecast, by Country 2020 & 2033
- Table 68: Global Sodium Silicate Market Volume K Tons Forecast, by Country 2020 & 2033
- Table 69: Saudi Arabia Sodium Silicate Market Revenue (Billion) Forecast, by Application 2020 & 2033
- Table 70: Saudi Arabia Sodium Silicate Market Volume (K Tons) Forecast, by Application 2020 & 2033
- Table 71: South Africa Sodium Silicate Market Revenue (Billion) Forecast, by Application 2020 & 2033
- Table 72: South Africa Sodium Silicate Market Volume (K Tons) Forecast, by Application 2020 & 2033
- Table 73: Rest of Middle East and Africa Sodium Silicate Market Revenue (Billion) Forecast, by Application 2020 & 2033
- Table 74: Rest of Middle East and Africa Sodium Silicate Market Volume (K Tons) Forecast, by Application 2020 & 2033
Frequently Asked Questions
1. What is the projected Compound Annual Growth Rate (CAGR) of the Sodium Silicate Market?
The projected CAGR is approximately 3.6%.
2. Which companies are prominent players in the Sodium Silicate Market?
Key companies in the market include Kiran Global Chem Limited, Occidental Petroleum Corporation, FUJI SILYSIA CHEMICAL LTD, Hindcon, Evonik Industries AG, Silmaco, BASF SE, PQ Corporation, Z Ch Rudniki S A, C THAI GROUP, Alumina doo Zvornik, W R Grace & Co -Conn, CIECH Group.
3. What are the main segments of the Sodium Silicate Market?
The market segments include Type, Application.
4. Can you provide details about the market size?
The market size is estimated to be USD 6.62 Billion as of 2022.
5. What are some drivers contributing to market growth?
Increasing Demand for Waste Paper Recycling; Rising Demand for Precipitated Silica from the Rubber and Tyre Industry; Other Drivers.
6. What are the notable trends driving market growth?
Detergents Segment to Witness Healthy Demand.
7. Are there any restraints impacting market growth?
Hazardous Effects of Sodium Silicate; Other Restraints.
8. Can you provide examples of recent developments in the market?
September 2022: Evonik, one of the world's leading silica producers, has entered a strategic cooperation with the Porner Group, Austria and Phichit Bio Power Co., Ltd., Thailand, to supply sustainable ULTRASIL precipitated silica to tire manufacturers.
9. What pricing options are available for accessing the report?
Pricing options include single-user, multi-user, and enterprise licenses priced at USD 4750, USD 5250, and USD 8750 respectively.
10. Is the market size provided in terms of value or volume?
The market size is provided in terms of value, measured in Billion and volume, measured in K Tons.
11. Are there any specific market keywords associated with the report?
Yes, the market keyword associated with the report is "Sodium Silicate Market," which aids in identifying and referencing the specific market segment covered.
12. How do I determine which pricing option suits my needs best?
The pricing options vary based on user requirements and access needs. Individual users may opt for single-user licenses, while businesses requiring broader access may choose multi-user or enterprise licenses for cost-effective access to the report.
13. Are there any additional resources or data provided in the Sodium Silicate Market report?
While the report offers comprehensive insights, it's advisable to review the specific contents or supplementary materials provided to ascertain if additional resources or data are available.
14. How can I stay updated on further developments or reports in the Sodium Silicate Market?
To stay informed about further developments, trends, and reports in the Sodium Silicate Market, consider subscribing to industry newsletters, following relevant companies and organizations, or regularly checking reputable industry news sources and publications.
Methodology
Step 1 - Identification of Relevant Samples Size from Population Database


Step 2 - Approaches for Defining Global Market Size (Value, Volume* & Price*)

Note*: In applicable scenarios
Step 3 - Data Sources
Primary Research
- Web Analytics
- Survey Reports
- Research Institute
- Latest Research Reports
- Opinion Leaders
Secondary Research
- Annual Reports
- White Paper
- Latest Press Release
- Industry Association
- Paid Database
- Investor Presentations

Step 4 - Data Triangulation
Involves using different sources of information in order to increase the validity of a study
These sources are likely to be stakeholders in a program - participants, other researchers, program staff, other community members, and so on.
Then we put all data in single framework & apply various statistical tools to find out the dynamic on the market.
During the analysis stage, feedback from the stakeholder groups would be compared to determine areas of agreement as well as areas of divergence