

Key Insights
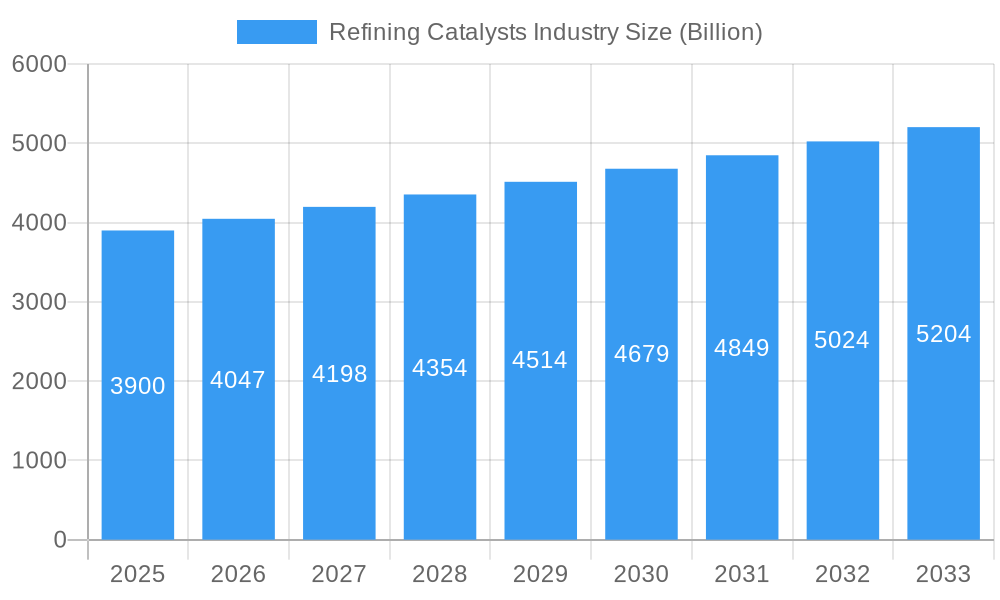
The refining catalysts market, valued at $3.9 billion in 2025, is projected to experience steady growth, driven by increasing demand for cleaner fuels and stricter environmental regulations globally. The Compound Annual Growth Rate (CAGR) of 3.69% from 2025 to 2033 indicates a consistent expansion, fueled by several key factors. Growth in the hydrotreating process segment, crucial for removing sulfur and other contaminants from petroleum products, is a significant contributor. The rising adoption of advanced catalysts like zeolites, known for their high efficiency and selectivity, further propels market growth. Furthermore, the expanding petrochemical industry and the need for upgrading heavy oil feedstocks such as residue fluid catalytic cracking (RFCC) are key market drivers. Geographic expansion, particularly in rapidly developing economies of Asia-Pacific and the Middle East, presents significant opportunities for market players. Competition among established players like Axens, Topsoe, and ExxonMobil, alongside emerging regional players, is intense, leading to continuous innovation and technological advancements in catalyst formulations.
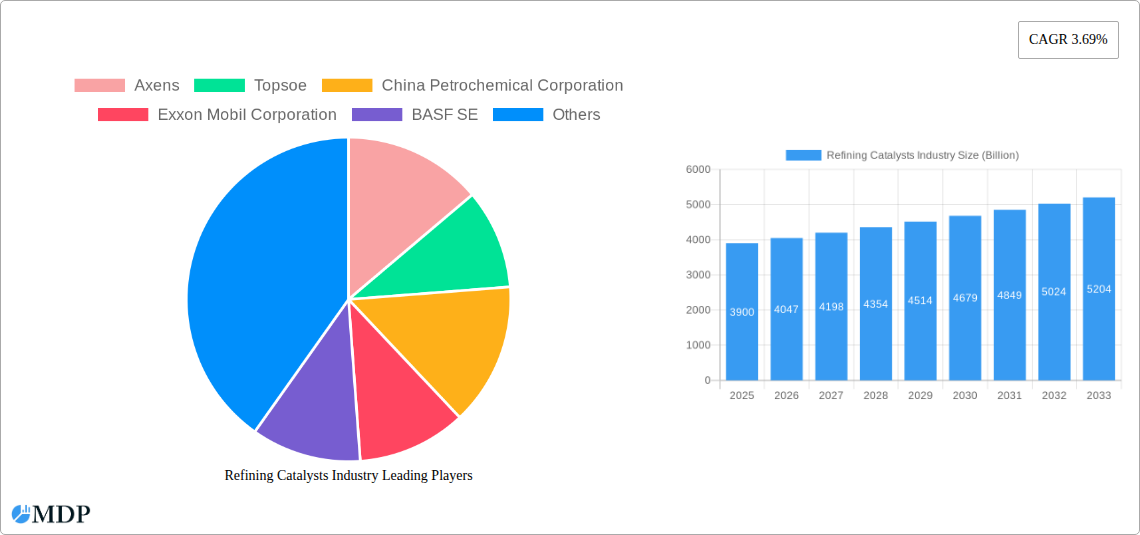
Refining Catalysts Industry Market Size (In Billion)
However, the market faces certain restraints. Fluctuations in crude oil prices directly impact the profitability of refineries, consequently affecting demand for catalysts. The stringent regulatory landscape regarding catalyst manufacturing and disposal, coupled with the potential for technological disruptions, poses challenges for market participants. Despite these headwinds, the long-term outlook for the refining catalysts market remains positive, driven by the continuing need for efficient and environmentally friendly refining processes. The ongoing shift towards cleaner fuels and the increasing focus on optimizing refinery operations will sustain demand for high-performance catalysts in the coming years. The market segmentation by product (CoMo, NiMo, Alumina-based Noble Metal, NiW, Zeolites, Other Products) and process (Hydrotreating, Fluid Catalytic Cracking (FCC), Residue Fluid Catalytic Cracking (RFCC), Hydrocracking) will continue to shape the market's evolution, with specific catalyst types finding application in various refining processes.
Refining Catalysts Industry Company Market Share
Refining Catalysts Market: A Comprehensive Report (2019-2033)
This in-depth report provides a comprehensive analysis of the global refining catalysts market, projecting a market valuation of $XX Billion by 2033. It covers key market dynamics, leading players, technological advancements, and future growth opportunities. Ideal for industry stakeholders, investors, and researchers seeking actionable insights into this dynamic sector. The report covers the period 2019-2033, with a focus on the 2025-2033 forecast period.
Refining Catalysts Industry Market Dynamics & Concentration
The refining catalysts market is characterized by a moderately concentrated landscape, with a few major players holding significant market share. Axens, Topsoe, and China Petrochemical Corporation are among the leading players, collectively controlling an estimated xx% of the global market in 2025. Market concentration is influenced by factors such as economies of scale, technological expertise, and extensive distribution networks. Innovation plays a crucial role, with companies investing heavily in R&D to develop advanced catalysts that improve efficiency, selectivity, and environmental performance. Stringent environmental regulations globally are driving demand for cleaner and more efficient catalysts, while the availability of substitute products and materials, such as alternative process technologies, poses a challenge. End-user trends, particularly in the petrochemical and refining sectors, greatly influence market demand. The last five years have witnessed a significant number of M&A activities, with an estimated xx M&A deals recorded between 2019 and 2024. These deals further consolidated market share among existing players and facilitated the integration of technologies and expansion into new geographical markets.
- Market Leaders (2025): Axens, Topsoe, China Petrochemical Corporation (estimated xx% combined market share)
- Key Innovation Drivers: Stringent environmental regulations, demand for improved catalyst efficiency, and development of sustainable technologies.
- M&A Activity (2019-2024): xx deals, leading to increased market consolidation.
- Substitute Products: Alternative process technologies pose a moderate threat.
Refining Catalysts Industry Industry Trends & Analysis
The refining catalysts market is projected to experience a Compound Annual Growth Rate (CAGR) of xx% during the forecast period (2025-2033). Growth is primarily driven by the increasing demand for refined petroleum products globally, particularly in developing economies. Technological advancements, such as the development of novel catalyst formulations and improved manufacturing processes, are contributing to enhanced catalyst performance and cost-effectiveness. Consumer preference for cleaner fuels and stricter environmental regulations are pushing the market towards more sustainable and environmentally friendly catalysts. Competitive dynamics are intensifying, with major players engaging in strategic partnerships, acquisitions, and technology licensing agreements to gain a competitive edge. Market penetration of advanced catalyst technologies, such as those based on zeolites and alumina-based noble metals, is steadily increasing, driven by their superior performance characteristics.
Leading Markets & Segments in Refining Catalysts Industry
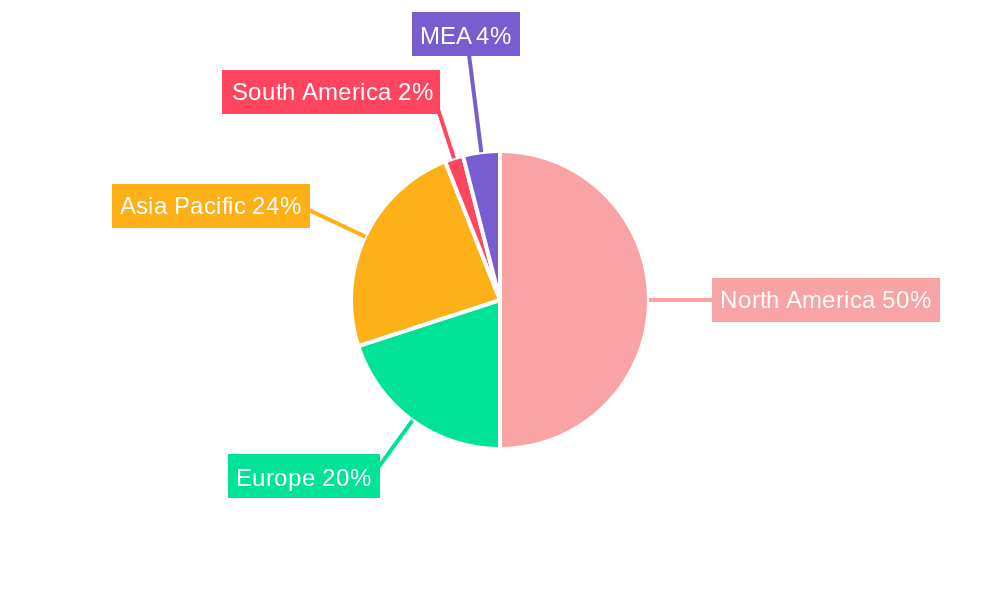
The Asia-Pacific region is projected to dominate the refining catalysts market throughout the forecast period, driven by rapid industrialization and significant investments in refinery expansions and upgrades. Within product segments, Hydrotreating catalysts (CoMo, NiMo, NiW) hold the largest market share due to their wide application in petroleum refining. Among residual feedstock processes, Fluid Catalytic Cracking (FCC) and Residue Fluid Catalytic Cracking (RFCC) segments are the most significant, reflecting the prevalence of these processes in the industry.
- Dominant Region: Asia-Pacific (driven by strong refinery expansions and economic growth)
- Dominant Product Segment: Hydrotreating catalysts (CoMo, NiMo, NiW) due to their widespread use.
- Dominant Residual Feedstock Process: Fluid Catalytic Cracking (FCC) and Residue Fluid Catalytic Cracking (RFCC)
- Key Drivers (Asia-Pacific): Rapid industrialization, expanding petrochemical sector, supportive government policies, and increasing investments in refinery modernization.
Refining Catalysts Industry Product Developments
Recent years have witnessed significant advancements in refining catalyst technology, focusing on improved activity, selectivity, and stability. The development of novel catalyst formulations incorporating advanced materials and optimized design features has led to improved efficiency and reduced environmental impact. For instance, BASF's launch of Fourtitude, an FCC catalyst, highlights the focus on maximizing valuable byproducts, such as butylenes. This trend reflects a market driven by the need for increased process efficiency and the production of higher-value products. The ongoing integration of advanced characterization techniques and computational modeling is further accelerating product innovation in the sector.
Key Drivers of Refining Catalysts Industry Growth
The growth of the refining catalysts market is fueled by a convergence of factors. Firstly, the increasing global demand for refined petroleum products, especially in rapidly developing economies, creates a substantial demand for efficient and high-performing catalysts. Secondly, technological advancements are driving improvements in catalyst performance, leading to greater efficiency and reduced operating costs. Finally, stringent environmental regulations are driving the adoption of catalysts designed to minimize emissions and pollution, further boosting market growth.
Challenges in the Refining Catalysts Industry Market
The refining catalysts market faces challenges such as volatile crude oil prices impacting refinery profitability and investment decisions. Supply chain disruptions can also negatively impact catalyst availability and lead times. Furthermore, intense competition among established players and emerging entrants puts pressure on pricing and margins. Stringent environmental regulations, while driving innovation, also necessitate significant R&D investments to meet compliance standards, posing a challenge for smaller players.
Emerging Opportunities in Refining Catalysts Industry
Significant long-term growth opportunities lie in developing advanced catalysts tailored for specific refinery operations, like those utilizing unconventional feedstocks. Strategic partnerships between catalyst manufacturers and refinery operators are becoming increasingly important to optimize catalyst performance and reduce operating costs. The adoption of digital technologies in catalyst design and manufacturing, as well as the development of sustainable and environmentally friendly catalysts, present further significant opportunities. Expansion into emerging markets with growing refining capacities also offers substantial growth potential.
Leading Players in the Refining Catalysts Industry Sector
- Axens
- Topsoe
- China Petrochemical Corporation
- Exxon Mobil Corporation
- BASF SE
- Honeywell International
- Chevron Lummus Global (CLG)
- JGC C & C
- Royal Dutch Shell PLC
- Johnson Matthey
- KNT Group
- W R Grace & Co -Conn
- Albemarle Corporation
Key Milestones in Refining Catalysts Industry Industry
- March 2022: BASF launched Fourtitude, a new Fluid Catalytic Cracking (FCC) catalyst designed to maximize butylenes from resid feedstocks, enhancing the value proposition of FCC processes and highlighting innovation within the sector.
Strategic Outlook for Refining Catalysts Industry Market
The refining catalysts market is poised for continued growth, driven by increasing demand, technological advancements, and evolving environmental regulations. Strategic partnerships, technological innovation in catalyst design, and expansion into new markets will be key to achieving sustainable growth. Focusing on developing advanced catalysts tailored for specific refinery processes and feedstocks will unlock further market potential and ensure the long-term success of key players in this dynamic and critical sector.
Refining Catalysts Industry Segmentation
-
1. Product
- 1.1. CoMo
- 1.2. NiMo
- 1.3. Alumina-based Noble Metal
- 1.4. NiW
- 1.5. Zeolites
- 1.6. Other Products
-
2. Process
-
2.1. Hydrotreating
- 2.1.1. Gasoline
- 2.1.2. Kerosene
- 2.1.3. Diesel
- 2.1.4. Vacuum Gas Oil
- 2.1.5. Catalytic Cracking Gasoline
- 2.1.6. Residual Feed
- 2.2. Fluid Catalytic Cracking (FCC)
- 2.3. Residue Fluid Catalytic Cracking (RFCC)
- 2.4. Hydrocracking
-
2.1. Hydrotreating
Refining Catalysts Industry Segmentation By Geography
-
1. Asia Pacific
- 1.1. China
- 1.2. India
- 1.3. Japan
- 1.4. South Korea
- 1.5. ASEAN Countries
- 1.6. Rest of Asia Pacific
-
2. North America
- 2.1. United States
- 2.2. Canada
- 2.3. Mexico
-
3. Europe
- 3.1. Germany
- 3.2. United Kingdom
- 3.3. Italy
- 3.4. France
- 3.5. Spain
- 3.6. Russia
- 3.7. Rest of Europe
-
4. South America
- 4.1. Brazil
- 4.2. Argentina
- 4.3. Rest of South America
-
5. Middle East and Africa
- 5.1. Saudi Arabia
- 5.2. South Africa
- 5.3. Rest of Middle East and Africa
Refining Catalysts Industry Regional Market Share
Geographic Coverage of Refining Catalysts Industry
Refining Catalysts Industry REPORT HIGHLIGHTS
| Aspects | Details |
|---|---|
| Study Period | 2020-2034 |
| Base Year | 2025 |
| Estimated Year | 2026 |
| Forecast Period | 2026-2034 |
| Historical Period | 2020-2025 |
| Growth Rate | CAGR of 3.69% from 2020-2034 |
| Segmentation |
|
Table of Contents
- 1. Introduction
- 1.1. Research Scope
- 1.2. Market Segmentation
- 1.3. Research Objective
- 1.4. Definitions and Assumptions
- 2. Executive Summary
- 2.1. Market Snapshot
- 3. Market Dynamics
- 3.1. Market Drivers
- 3.2. Market Restrains
- 3.3. Market Trends
- 3.4. Market Opportunities
- 4. Market Factor Analysis
- 4.1. Porters Five Forces
- 4.1.1. Bargaining Power of Suppliers
- 4.1.2. Bargaining Power of Buyers
- 4.1.3. Threat of New Entrants
- 4.1.4. Threat of Substitutes
- 4.1.5. Competitive Rivalry
- 4.2. PESTEL analysis
- 4.3. BCG Analysis
- 4.3.1. Stars (High Growth, High Market Share)
- 4.3.2. Cash Cows (Low Growth, High Market Share)
- 4.3.3. Question Mark (High Growth, Low Market Share)
- 4.3.4. Dogs (Low Growth, Low Market Share)
- 4.4. Ansoff Matrix Analysis
- 4.5. Supply Chain Analysis
- 4.6. Regulatory Landscape
- 4.7. Current Market Potential and Opportunity Assessment (TAM–SAM–SOM Framework)
- 4.8. MDP Analyst Note
- 4.1. Porters Five Forces
- 5. Market Analysis, Insights and Forecast 2021-2033
- 5.1. Market Analysis, Insights and Forecast - by Product
- 5.1.1. CoMo
- 5.1.2. NiMo
- 5.1.3. Alumina-based Noble Metal
- 5.1.4. NiW
- 5.1.5. Zeolites
- 5.1.6. Other Products
- 5.2. Market Analysis, Insights and Forecast - by Process
- 5.2.1. Hydrotreating
- 5.2.1.1. Gasoline
- 5.2.1.2. Kerosene
- 5.2.1.3. Diesel
- 5.2.1.4. Vacuum Gas Oil
- 5.2.1.5. Catalytic Cracking Gasoline
- 5.2.1.6. Residual Feed
- 5.2.2. Fluid Catalytic Cracking (FCC)
- 5.2.3. Residue Fluid Catalytic Cracking (RFCC)
- 5.2.4. Hydrocracking
- 5.2.1. Hydrotreating
- 5.3. Market Analysis, Insights and Forecast - by Region
- 5.3.1. Asia Pacific
- 5.3.2. North America
- 5.3.3. Europe
- 5.3.4. South America
- 5.3.5. Middle East and Africa
- 5.1. Market Analysis, Insights and Forecast - by Product
- 6. Global Refining Catalysts Industry Analysis, Insights and Forecast, 2021-2033
- 6.1. Market Analysis, Insights and Forecast - by Product
- 6.1.1. CoMo
- 6.1.2. NiMo
- 6.1.3. Alumina-based Noble Metal
- 6.1.4. NiW
- 6.1.5. Zeolites
- 6.1.6. Other Products
- 6.2. Market Analysis, Insights and Forecast - by Process
- 6.2.1. Hydrotreating
- 6.2.1.1. Gasoline
- 6.2.1.2. Kerosene
- 6.2.1.3. Diesel
- 6.2.1.4. Vacuum Gas Oil
- 6.2.1.5. Catalytic Cracking Gasoline
- 6.2.1.6. Residual Feed
- 6.2.2. Fluid Catalytic Cracking (FCC)
- 6.2.3. Residue Fluid Catalytic Cracking (RFCC)
- 6.2.4. Hydrocracking
- 6.2.1. Hydrotreating
- 6.1. Market Analysis, Insights and Forecast - by Product
- 7. Asia Pacific Refining Catalysts Industry Analysis, Insights and Forecast, 2020-2032
- 7.1. Market Analysis, Insights and Forecast - by Product
- 7.1.1. CoMo
- 7.1.2. NiMo
- 7.1.3. Alumina-based Noble Metal
- 7.1.4. NiW
- 7.1.5. Zeolites
- 7.1.6. Other Products
- 7.2. Market Analysis, Insights and Forecast - by Process
- 7.2.1. Hydrotreating
- 7.2.1.1. Gasoline
- 7.2.1.2. Kerosene
- 7.2.1.3. Diesel
- 7.2.1.4. Vacuum Gas Oil
- 7.2.1.5. Catalytic Cracking Gasoline
- 7.2.1.6. Residual Feed
- 7.2.2. Fluid Catalytic Cracking (FCC)
- 7.2.3. Residue Fluid Catalytic Cracking (RFCC)
- 7.2.4. Hydrocracking
- 7.2.1. Hydrotreating
- 7.1. Market Analysis, Insights and Forecast - by Product
- 8. North America Refining Catalysts Industry Analysis, Insights and Forecast, 2020-2032
- 8.1. Market Analysis, Insights and Forecast - by Product
- 8.1.1. CoMo
- 8.1.2. NiMo
- 8.1.3. Alumina-based Noble Metal
- 8.1.4. NiW
- 8.1.5. Zeolites
- 8.1.6. Other Products
- 8.2. Market Analysis, Insights and Forecast - by Process
- 8.2.1. Hydrotreating
- 8.2.1.1. Gasoline
- 8.2.1.2. Kerosene
- 8.2.1.3. Diesel
- 8.2.1.4. Vacuum Gas Oil
- 8.2.1.5. Catalytic Cracking Gasoline
- 8.2.1.6. Residual Feed
- 8.2.2. Fluid Catalytic Cracking (FCC)
- 8.2.3. Residue Fluid Catalytic Cracking (RFCC)
- 8.2.4. Hydrocracking
- 8.2.1. Hydrotreating
- 8.1. Market Analysis, Insights and Forecast - by Product
- 9. Europe Refining Catalysts Industry Analysis, Insights and Forecast, 2020-2032
- 9.1. Market Analysis, Insights and Forecast - by Product
- 9.1.1. CoMo
- 9.1.2. NiMo
- 9.1.3. Alumina-based Noble Metal
- 9.1.4. NiW
- 9.1.5. Zeolites
- 9.1.6. Other Products
- 9.2. Market Analysis, Insights and Forecast - by Process
- 9.2.1. Hydrotreating
- 9.2.1.1. Gasoline
- 9.2.1.2. Kerosene
- 9.2.1.3. Diesel
- 9.2.1.4. Vacuum Gas Oil
- 9.2.1.5. Catalytic Cracking Gasoline
- 9.2.1.6. Residual Feed
- 9.2.2. Fluid Catalytic Cracking (FCC)
- 9.2.3. Residue Fluid Catalytic Cracking (RFCC)
- 9.2.4. Hydrocracking
- 9.2.1. Hydrotreating
- 9.1. Market Analysis, Insights and Forecast - by Product
- 10. South America Refining Catalysts Industry Analysis, Insights and Forecast, 2020-2032
- 10.1. Market Analysis, Insights and Forecast - by Product
- 10.1.1. CoMo
- 10.1.2. NiMo
- 10.1.3. Alumina-based Noble Metal
- 10.1.4. NiW
- 10.1.5. Zeolites
- 10.1.6. Other Products
- 10.2. Market Analysis, Insights and Forecast - by Process
- 10.2.1. Hydrotreating
- 10.2.1.1. Gasoline
- 10.2.1.2. Kerosene
- 10.2.1.3. Diesel
- 10.2.1.4. Vacuum Gas Oil
- 10.2.1.5. Catalytic Cracking Gasoline
- 10.2.1.6. Residual Feed
- 10.2.2. Fluid Catalytic Cracking (FCC)
- 10.2.3. Residue Fluid Catalytic Cracking (RFCC)
- 10.2.4. Hydrocracking
- 10.2.1. Hydrotreating
- 10.1. Market Analysis, Insights and Forecast - by Product
- 11. Middle East and Africa Refining Catalysts Industry Analysis, Insights and Forecast, 2020-2032
- 11.1. Market Analysis, Insights and Forecast - by Product
- 11.1.1. CoMo
- 11.1.2. NiMo
- 11.1.3. Alumina-based Noble Metal
- 11.1.4. NiW
- 11.1.5. Zeolites
- 11.1.6. Other Products
- 11.2. Market Analysis, Insights and Forecast - by Process
- 11.2.1. Hydrotreating
- 11.2.1.1. Gasoline
- 11.2.1.2. Kerosene
- 11.2.1.3. Diesel
- 11.2.1.4. Vacuum Gas Oil
- 11.2.1.5. Catalytic Cracking Gasoline
- 11.2.1.6. Residual Feed
- 11.2.2. Fluid Catalytic Cracking (FCC)
- 11.2.3. Residue Fluid Catalytic Cracking (RFCC)
- 11.2.4. Hydrocracking
- 11.2.1. Hydrotreating
- 11.1. Market Analysis, Insights and Forecast - by Product
- 12. Competitive Analysis
- 12.1. Company Profiles
- 12.1.1 Axens
- 12.1.1.1. Company Overview
- 12.1.1.2. Products
- 12.1.1.3. Company Financials
- 12.1.1.4. SWOT Analysis
- 12.1.2 Topsoe
- 12.1.2.1. Company Overview
- 12.1.2.2. Products
- 12.1.2.3. Company Financials
- 12.1.2.4. SWOT Analysis
- 12.1.3 China Petrochemical Corporation
- 12.1.3.1. Company Overview
- 12.1.3.2. Products
- 12.1.3.3. Company Financials
- 12.1.3.4. SWOT Analysis
- 12.1.4 Exxon Mobil Corporation
- 12.1.4.1. Company Overview
- 12.1.4.2. Products
- 12.1.4.3. Company Financials
- 12.1.4.4. SWOT Analysis
- 12.1.5 BASF SE
- 12.1.5.1. Company Overview
- 12.1.5.2. Products
- 12.1.5.3. Company Financials
- 12.1.5.4. SWOT Analysis
- 12.1.6 Honeywell International
- 12.1.6.1. Company Overview
- 12.1.6.2. Products
- 12.1.6.3. Company Financials
- 12.1.6.4. SWOT Analysis
- 12.1.7 Chevron Lummus Global (CLG)
- 12.1.7.1. Company Overview
- 12.1.7.2. Products
- 12.1.7.3. Company Financials
- 12.1.7.4. SWOT Analysis
- 12.1.8 JGC C & C
- 12.1.8.1. Company Overview
- 12.1.8.2. Products
- 12.1.8.3. Company Financials
- 12.1.8.4. SWOT Analysis
- 12.1.9 Royal Dutch Shell PLC
- 12.1.9.1. Company Overview
- 12.1.9.2. Products
- 12.1.9.3. Company Financials
- 12.1.9.4. SWOT Analysis
- 12.1.10 Johnson Matthey
- 12.1.10.1. Company Overview
- 12.1.10.2. Products
- 12.1.10.3. Company Financials
- 12.1.10.4. SWOT Analysis
- 12.1.11 KNT Group
- 12.1.11.1. Company Overview
- 12.1.11.2. Products
- 12.1.11.3. Company Financials
- 12.1.11.4. SWOT Analysis
- 12.1.12 W R Grace & Co -Conn
- 12.1.12.1. Company Overview
- 12.1.12.2. Products
- 12.1.12.3. Company Financials
- 12.1.12.4. SWOT Analysis
- 12.1.13 Albemarle Corporation
- 12.1.13.1. Company Overview
- 12.1.13.2. Products
- 12.1.13.3. Company Financials
- 12.1.13.4. SWOT Analysis
- 12.1.1 Axens
- 12.2. Market Entropy
- 12.2.1 Company's Key Areas Served
- 12.2.2 Recent Developments
- 12.3. Company Market Share Analysis 2025
- 12.3.1 Top 5 Companies Market Share Analysis
- 12.3.2 Top 3 Companies Market Share Analysis
- 12.4. List of Potential Customers
- 13. Research Methodology
List of Figures
- Figure 1: Global Refining Catalysts Industry Revenue Breakdown (Billion, %) by Region 2025 & 2033
- Figure 2: Global Refining Catalysts Industry Volume Breakdown (K Tons, %) by Region 2025 & 2033
- Figure 3: Asia Pacific Refining Catalysts Industry Revenue (Billion), by Product 2025 & 2033
- Figure 4: Asia Pacific Refining Catalysts Industry Volume (K Tons), by Product 2025 & 2033
- Figure 5: Asia Pacific Refining Catalysts Industry Revenue Share (%), by Product 2025 & 2033
- Figure 6: Asia Pacific Refining Catalysts Industry Volume Share (%), by Product 2025 & 2033
- Figure 7: Asia Pacific Refining Catalysts Industry Revenue (Billion), by Process 2025 & 2033
- Figure 8: Asia Pacific Refining Catalysts Industry Volume (K Tons), by Process 2025 & 2033
- Figure 9: Asia Pacific Refining Catalysts Industry Revenue Share (%), by Process 2025 & 2033
- Figure 10: Asia Pacific Refining Catalysts Industry Volume Share (%), by Process 2025 & 2033
- Figure 11: Asia Pacific Refining Catalysts Industry Revenue (Billion), by Country 2025 & 2033
- Figure 12: Asia Pacific Refining Catalysts Industry Volume (K Tons), by Country 2025 & 2033
- Figure 13: Asia Pacific Refining Catalysts Industry Revenue Share (%), by Country 2025 & 2033
- Figure 14: Asia Pacific Refining Catalysts Industry Volume Share (%), by Country 2025 & 2033
- Figure 15: North America Refining Catalysts Industry Revenue (Billion), by Product 2025 & 2033
- Figure 16: North America Refining Catalysts Industry Volume (K Tons), by Product 2025 & 2033
- Figure 17: North America Refining Catalysts Industry Revenue Share (%), by Product 2025 & 2033
- Figure 18: North America Refining Catalysts Industry Volume Share (%), by Product 2025 & 2033
- Figure 19: North America Refining Catalysts Industry Revenue (Billion), by Process 2025 & 2033
- Figure 20: North America Refining Catalysts Industry Volume (K Tons), by Process 2025 & 2033
- Figure 21: North America Refining Catalysts Industry Revenue Share (%), by Process 2025 & 2033
- Figure 22: North America Refining Catalysts Industry Volume Share (%), by Process 2025 & 2033
- Figure 23: North America Refining Catalysts Industry Revenue (Billion), by Country 2025 & 2033
- Figure 24: North America Refining Catalysts Industry Volume (K Tons), by Country 2025 & 2033
- Figure 25: North America Refining Catalysts Industry Revenue Share (%), by Country 2025 & 2033
- Figure 26: North America Refining Catalysts Industry Volume Share (%), by Country 2025 & 2033
- Figure 27: Europe Refining Catalysts Industry Revenue (Billion), by Product 2025 & 2033
- Figure 28: Europe Refining Catalysts Industry Volume (K Tons), by Product 2025 & 2033
- Figure 29: Europe Refining Catalysts Industry Revenue Share (%), by Product 2025 & 2033
- Figure 30: Europe Refining Catalysts Industry Volume Share (%), by Product 2025 & 2033
- Figure 31: Europe Refining Catalysts Industry Revenue (Billion), by Process 2025 & 2033
- Figure 32: Europe Refining Catalysts Industry Volume (K Tons), by Process 2025 & 2033
- Figure 33: Europe Refining Catalysts Industry Revenue Share (%), by Process 2025 & 2033
- Figure 34: Europe Refining Catalysts Industry Volume Share (%), by Process 2025 & 2033
- Figure 35: Europe Refining Catalysts Industry Revenue (Billion), by Country 2025 & 2033
- Figure 36: Europe Refining Catalysts Industry Volume (K Tons), by Country 2025 & 2033
- Figure 37: Europe Refining Catalysts Industry Revenue Share (%), by Country 2025 & 2033
- Figure 38: Europe Refining Catalysts Industry Volume Share (%), by Country 2025 & 2033
- Figure 39: South America Refining Catalysts Industry Revenue (Billion), by Product 2025 & 2033
- Figure 40: South America Refining Catalysts Industry Volume (K Tons), by Product 2025 & 2033
- Figure 41: South America Refining Catalysts Industry Revenue Share (%), by Product 2025 & 2033
- Figure 42: South America Refining Catalysts Industry Volume Share (%), by Product 2025 & 2033
- Figure 43: South America Refining Catalysts Industry Revenue (Billion), by Process 2025 & 2033
- Figure 44: South America Refining Catalysts Industry Volume (K Tons), by Process 2025 & 2033
- Figure 45: South America Refining Catalysts Industry Revenue Share (%), by Process 2025 & 2033
- Figure 46: South America Refining Catalysts Industry Volume Share (%), by Process 2025 & 2033
- Figure 47: South America Refining Catalysts Industry Revenue (Billion), by Country 2025 & 2033
- Figure 48: South America Refining Catalysts Industry Volume (K Tons), by Country 2025 & 2033
- Figure 49: South America Refining Catalysts Industry Revenue Share (%), by Country 2025 & 2033
- Figure 50: South America Refining Catalysts Industry Volume Share (%), by Country 2025 & 2033
- Figure 51: Middle East and Africa Refining Catalysts Industry Revenue (Billion), by Product 2025 & 2033
- Figure 52: Middle East and Africa Refining Catalysts Industry Volume (K Tons), by Product 2025 & 2033
- Figure 53: Middle East and Africa Refining Catalysts Industry Revenue Share (%), by Product 2025 & 2033
- Figure 54: Middle East and Africa Refining Catalysts Industry Volume Share (%), by Product 2025 & 2033
- Figure 55: Middle East and Africa Refining Catalysts Industry Revenue (Billion), by Process 2025 & 2033
- Figure 56: Middle East and Africa Refining Catalysts Industry Volume (K Tons), by Process 2025 & 2033
- Figure 57: Middle East and Africa Refining Catalysts Industry Revenue Share (%), by Process 2025 & 2033
- Figure 58: Middle East and Africa Refining Catalysts Industry Volume Share (%), by Process 2025 & 2033
- Figure 59: Middle East and Africa Refining Catalysts Industry Revenue (Billion), by Country 2025 & 2033
- Figure 60: Middle East and Africa Refining Catalysts Industry Volume (K Tons), by Country 2025 & 2033
- Figure 61: Middle East and Africa Refining Catalysts Industry Revenue Share (%), by Country 2025 & 2033
- Figure 62: Middle East and Africa Refining Catalysts Industry Volume Share (%), by Country 2025 & 2033
List of Tables
- Table 1: Global Refining Catalysts Industry Revenue Billion Forecast, by Product 2020 & 2033
- Table 2: Global Refining Catalysts Industry Volume K Tons Forecast, by Product 2020 & 2033
- Table 3: Global Refining Catalysts Industry Revenue Billion Forecast, by Process 2020 & 2033
- Table 4: Global Refining Catalysts Industry Volume K Tons Forecast, by Process 2020 & 2033
- Table 5: Global Refining Catalysts Industry Revenue Billion Forecast, by Region 2020 & 2033
- Table 6: Global Refining Catalysts Industry Volume K Tons Forecast, by Region 2020 & 2033
- Table 7: Global Refining Catalysts Industry Revenue Billion Forecast, by Product 2020 & 2033
- Table 8: Global Refining Catalysts Industry Volume K Tons Forecast, by Product 2020 & 2033
- Table 9: Global Refining Catalysts Industry Revenue Billion Forecast, by Process 2020 & 2033
- Table 10: Global Refining Catalysts Industry Volume K Tons Forecast, by Process 2020 & 2033
- Table 11: Global Refining Catalysts Industry Revenue Billion Forecast, by Country 2020 & 2033
- Table 12: Global Refining Catalysts Industry Volume K Tons Forecast, by Country 2020 & 2033
- Table 13: China Refining Catalysts Industry Revenue (Billion) Forecast, by Application 2020 & 2033
- Table 14: China Refining Catalysts Industry Volume (K Tons) Forecast, by Application 2020 & 2033
- Table 15: India Refining Catalysts Industry Revenue (Billion) Forecast, by Application 2020 & 2033
- Table 16: India Refining Catalysts Industry Volume (K Tons) Forecast, by Application 2020 & 2033
- Table 17: Japan Refining Catalysts Industry Revenue (Billion) Forecast, by Application 2020 & 2033
- Table 18: Japan Refining Catalysts Industry Volume (K Tons) Forecast, by Application 2020 & 2033
- Table 19: South Korea Refining Catalysts Industry Revenue (Billion) Forecast, by Application 2020 & 2033
- Table 20: South Korea Refining Catalysts Industry Volume (K Tons) Forecast, by Application 2020 & 2033
- Table 21: ASEAN Countries Refining Catalysts Industry Revenue (Billion) Forecast, by Application 2020 & 2033
- Table 22: ASEAN Countries Refining Catalysts Industry Volume (K Tons) Forecast, by Application 2020 & 2033
- Table 23: Rest of Asia Pacific Refining Catalysts Industry Revenue (Billion) Forecast, by Application 2020 & 2033
- Table 24: Rest of Asia Pacific Refining Catalysts Industry Volume (K Tons) Forecast, by Application 2020 & 2033
- Table 25: Global Refining Catalysts Industry Revenue Billion Forecast, by Product 2020 & 2033
- Table 26: Global Refining Catalysts Industry Volume K Tons Forecast, by Product 2020 & 2033
- Table 27: Global Refining Catalysts Industry Revenue Billion Forecast, by Process 2020 & 2033
- Table 28: Global Refining Catalysts Industry Volume K Tons Forecast, by Process 2020 & 2033
- Table 29: Global Refining Catalysts Industry Revenue Billion Forecast, by Country 2020 & 2033
- Table 30: Global Refining Catalysts Industry Volume K Tons Forecast, by Country 2020 & 2033
- Table 31: United States Refining Catalysts Industry Revenue (Billion) Forecast, by Application 2020 & 2033
- Table 32: United States Refining Catalysts Industry Volume (K Tons) Forecast, by Application 2020 & 2033
- Table 33: Canada Refining Catalysts Industry Revenue (Billion) Forecast, by Application 2020 & 2033
- Table 34: Canada Refining Catalysts Industry Volume (K Tons) Forecast, by Application 2020 & 2033
- Table 35: Mexico Refining Catalysts Industry Revenue (Billion) Forecast, by Application 2020 & 2033
- Table 36: Mexico Refining Catalysts Industry Volume (K Tons) Forecast, by Application 2020 & 2033
- Table 37: Global Refining Catalysts Industry Revenue Billion Forecast, by Product 2020 & 2033
- Table 38: Global Refining Catalysts Industry Volume K Tons Forecast, by Product 2020 & 2033
- Table 39: Global Refining Catalysts Industry Revenue Billion Forecast, by Process 2020 & 2033
- Table 40: Global Refining Catalysts Industry Volume K Tons Forecast, by Process 2020 & 2033
- Table 41: Global Refining Catalysts Industry Revenue Billion Forecast, by Country 2020 & 2033
- Table 42: Global Refining Catalysts Industry Volume K Tons Forecast, by Country 2020 & 2033
- Table 43: Germany Refining Catalysts Industry Revenue (Billion) Forecast, by Application 2020 & 2033
- Table 44: Germany Refining Catalysts Industry Volume (K Tons) Forecast, by Application 2020 & 2033
- Table 45: United Kingdom Refining Catalysts Industry Revenue (Billion) Forecast, by Application 2020 & 2033
- Table 46: United Kingdom Refining Catalysts Industry Volume (K Tons) Forecast, by Application 2020 & 2033
- Table 47: Italy Refining Catalysts Industry Revenue (Billion) Forecast, by Application 2020 & 2033
- Table 48: Italy Refining Catalysts Industry Volume (K Tons) Forecast, by Application 2020 & 2033
- Table 49: France Refining Catalysts Industry Revenue (Billion) Forecast, by Application 2020 & 2033
- Table 50: France Refining Catalysts Industry Volume (K Tons) Forecast, by Application 2020 & 2033
- Table 51: Spain Refining Catalysts Industry Revenue (Billion) Forecast, by Application 2020 & 2033
- Table 52: Spain Refining Catalysts Industry Volume (K Tons) Forecast, by Application 2020 & 2033
- Table 53: Russia Refining Catalysts Industry Revenue (Billion) Forecast, by Application 2020 & 2033
- Table 54: Russia Refining Catalysts Industry Volume (K Tons) Forecast, by Application 2020 & 2033
- Table 55: Rest of Europe Refining Catalysts Industry Revenue (Billion) Forecast, by Application 2020 & 2033
- Table 56: Rest of Europe Refining Catalysts Industry Volume (K Tons) Forecast, by Application 2020 & 2033
- Table 57: Global Refining Catalysts Industry Revenue Billion Forecast, by Product 2020 & 2033
- Table 58: Global Refining Catalysts Industry Volume K Tons Forecast, by Product 2020 & 2033
- Table 59: Global Refining Catalysts Industry Revenue Billion Forecast, by Process 2020 & 2033
- Table 60: Global Refining Catalysts Industry Volume K Tons Forecast, by Process 2020 & 2033
- Table 61: Global Refining Catalysts Industry Revenue Billion Forecast, by Country 2020 & 2033
- Table 62: Global Refining Catalysts Industry Volume K Tons Forecast, by Country 2020 & 2033
- Table 63: Brazil Refining Catalysts Industry Revenue (Billion) Forecast, by Application 2020 & 2033
- Table 64: Brazil Refining Catalysts Industry Volume (K Tons) Forecast, by Application 2020 & 2033
- Table 65: Argentina Refining Catalysts Industry Revenue (Billion) Forecast, by Application 2020 & 2033
- Table 66: Argentina Refining Catalysts Industry Volume (K Tons) Forecast, by Application 2020 & 2033
- Table 67: Rest of South America Refining Catalysts Industry Revenue (Billion) Forecast, by Application 2020 & 2033
- Table 68: Rest of South America Refining Catalysts Industry Volume (K Tons) Forecast, by Application 2020 & 2033
- Table 69: Global Refining Catalysts Industry Revenue Billion Forecast, by Product 2020 & 2033
- Table 70: Global Refining Catalysts Industry Volume K Tons Forecast, by Product 2020 & 2033
- Table 71: Global Refining Catalysts Industry Revenue Billion Forecast, by Process 2020 & 2033
- Table 72: Global Refining Catalysts Industry Volume K Tons Forecast, by Process 2020 & 2033
- Table 73: Global Refining Catalysts Industry Revenue Billion Forecast, by Country 2020 & 2033
- Table 74: Global Refining Catalysts Industry Volume K Tons Forecast, by Country 2020 & 2033
- Table 75: Saudi Arabia Refining Catalysts Industry Revenue (Billion) Forecast, by Application 2020 & 2033
- Table 76: Saudi Arabia Refining Catalysts Industry Volume (K Tons) Forecast, by Application 2020 & 2033
- Table 77: South Africa Refining Catalysts Industry Revenue (Billion) Forecast, by Application 2020 & 2033
- Table 78: South Africa Refining Catalysts Industry Volume (K Tons) Forecast, by Application 2020 & 2033
- Table 79: Rest of Middle East and Africa Refining Catalysts Industry Revenue (Billion) Forecast, by Application 2020 & 2033
- Table 80: Rest of Middle East and Africa Refining Catalysts Industry Volume (K Tons) Forecast, by Application 2020 & 2033
Frequently Asked Questions
1. What is the projected Compound Annual Growth Rate (CAGR) of the Refining Catalysts Industry?
The projected CAGR is approximately 3.69%.
2. Which companies are prominent players in the Refining Catalysts Industry?
Key companies in the market include Axens, Topsoe, China Petrochemical Corporation, Exxon Mobil Corporation, BASF SE, Honeywell International, Chevron Lummus Global (CLG), JGC C & C, Royal Dutch Shell PLC, Johnson Matthey, KNT Group, W R Grace & Co -Conn, Albemarle Corporation.
3. What are the main segments of the Refining Catalysts Industry?
The market segments include Product, Process.
4. Can you provide details about the market size?
The market size is estimated to be USD 3.9 Billion as of 2022.
5. What are some drivers contributing to market growth?
Accelerating Demand for Higher-Octane Fuel; Expansion of Oil and Gas Activities; Other Drivers.
6. What are the notable trends driving market growth?
Fluid Catalytic Cracking (FCC) Catalysts to Dominate the Market.
7. Are there any restraints impacting market growth?
Volatility in Precious Metal Prices; Other Restraints.
8. Can you provide examples of recent developments in the market?
March 2022: BASF launched Fourtitude, a new Fluid Catalytic Cracking (FCC) catalyst designed to maximize butylenes from resid feedstocks.
9. What pricing options are available for accessing the report?
Pricing options include single-user, multi-user, and enterprise licenses priced at USD 3,950, USD 4,950, and USD 6,950 respectively.
10. Is the market size provided in terms of value or volume?
The market size is provided in terms of value, measured in Billion and volume, measured in K Tons.
11. Are there any specific market keywords associated with the report?
Yes, the market keyword associated with the report is "Refining Catalysts Industry," which aids in identifying and referencing the specific market segment covered.
12. How do I determine which pricing option suits my needs best?
The pricing options vary based on user requirements and access needs. Individual users may opt for single-user licenses, while businesses requiring broader access may choose multi-user or enterprise licenses for cost-effective access to the report.
13. Are there any additional resources or data provided in the Refining Catalysts Industry report?
While the report offers comprehensive insights, it's advisable to review the specific contents or supplementary materials provided to ascertain if additional resources or data are available.
14. How can I stay updated on further developments or reports in the Refining Catalysts Industry?
To stay informed about further developments, trends, and reports in the Refining Catalysts Industry, consider subscribing to industry newsletters, following relevant companies and organizations, or regularly checking reputable industry news sources and publications.
Methodology
Step 1 - Identification of Relevant Samples Size from Population Database


Step 2 - Approaches for Defining Global Market Size (Value, Volume* & Price*)

Note*: In applicable scenarios
Step 3 - Data Sources
Primary Research
- Web Analytics
- Survey Reports
- Research Institute
- Latest Research Reports
- Opinion Leaders
Secondary Research
- Annual Reports
- White Paper
- Latest Press Release
- Industry Association
- Paid Database
- Investor Presentations

Step 4 - Data Triangulation
Involves using different sources of information in order to increase the validity of a study
These sources are likely to be stakeholders in a program - participants, other researchers, program staff, other community members, and so on.
Then we put all data in single framework & apply various statistical tools to find out the dynamic on the market.
During the analysis stage, feedback from the stakeholder groups would be compared to determine areas of agreement as well as areas of divergence