

Key Insights
The Recovered Carbon Black (RCB) market is experiencing robust expansion, propelled by escalating environmental consciousness and stringent waste tire management regulations. Forecasted to reach $14.5 billion by 2025, the market is projected to achieve a Compound Annual Growth Rate (CAGR) of 4.8%, indicating substantial growth potential through 2033. Primary growth catalysts include the escalating demand for sustainable materials across key industries such as tires, plastics, and inks. The automotive sector, a significant carbon black consumer, is a key contributor, particularly with the rise of electric vehicles necessitating rubber and plastic components. Innovations in RCB production technology are enhancing product quality and cost-effectiveness, further accelerating market adoption.
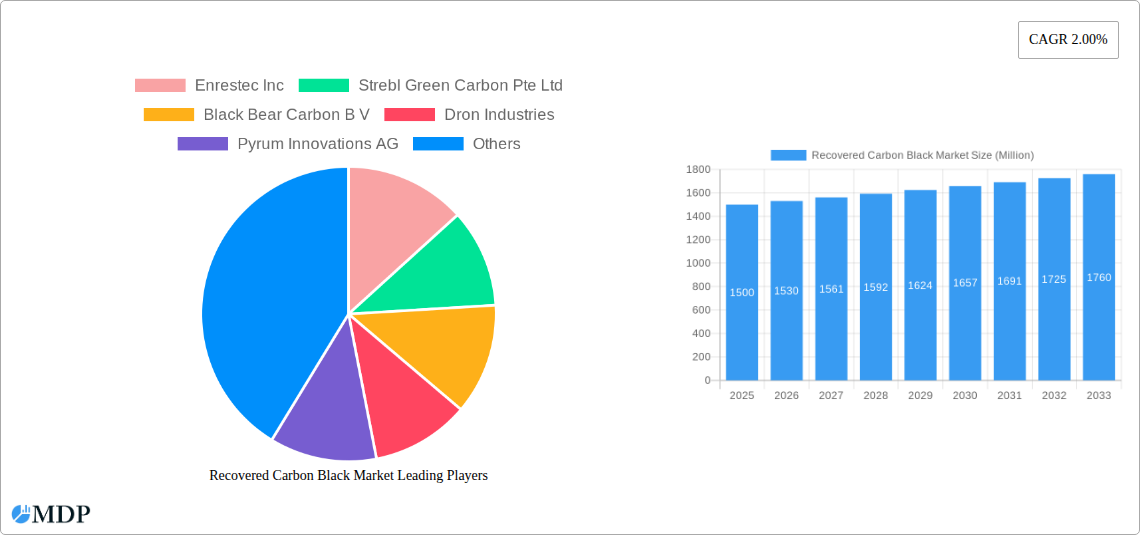
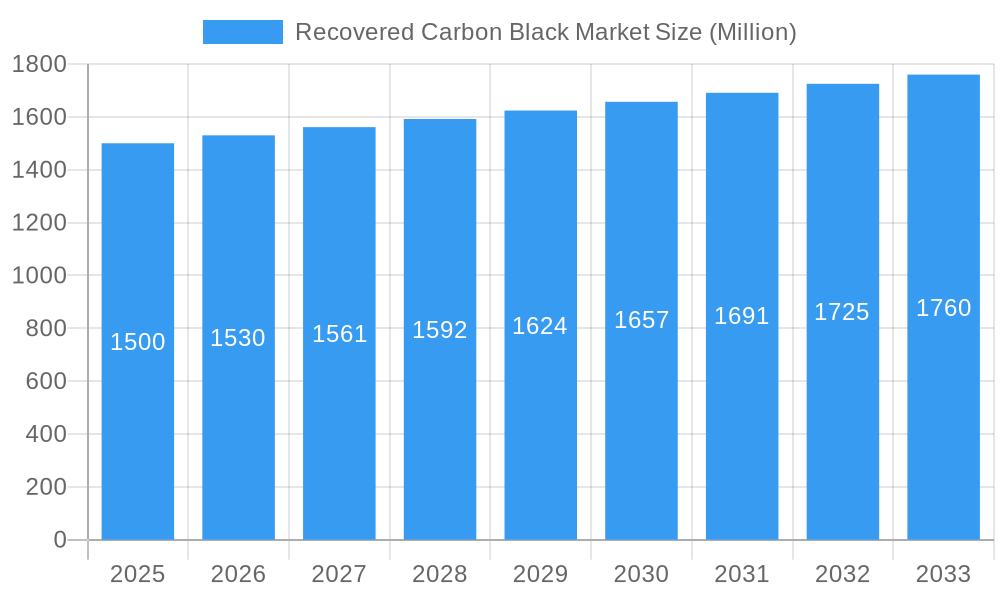
Recovered Carbon Black Market Market Size (In Billion)
Market segmentation highlights diverse applications, with tires, plastics, and batteries emerging as major RCB consumers. The Asia-Pacific region, led by China and India, is anticipated to lead market share due to extensive tire manufacturing and a strong commitment to recycling initiatives. North America and Europe are also expected to see significant growth, supported by governmental policies promoting sustainability and the circular economy. Key challenges include high upfront investment for RCB production facilities and the necessity for technological advancements to ensure consistent product quality. Despite these hurdles, the long-term outlook for the RCB market is optimistic, driven by a global emphasis on sustainability and resource efficiency. Prominent players like Enrestec Inc and Strebl Green Carbon Pte Ltd are actively shaping market dynamics through innovation and strategic market expansion.
Recovered Carbon Black Market Company Market Share
Recovered Carbon Black Market: A Comprehensive Analysis (2019-2033)
This comprehensive report provides an in-depth analysis of the Recovered Carbon Black (rCB) market, offering invaluable insights for industry stakeholders, investors, and strategic decision-makers. With a detailed examination of market dynamics, leading players, and future trends, this report is your essential guide to navigating this rapidly evolving sector. The study period covers 2019-2033, with 2025 as the base and estimated year, and a forecast period of 2025-2033. The historical period analyzed is 2019-2024. The market is segmented by application (Tires, Batteries, Plastics, Non-Tire Rubber, Dyes and Pigments) and end-user industry (Printing and Packaging, Industrial, Building and Construction, Electronics, Automotive, Other End-user Industries). Key players profiled include Enrestec Inc, Strebl Green Carbon Pte Ltd, Black Bear Carbon B V, Dron Industries, Pyrum Innovations AG, Carbon Recovery GmbH, DVA Renewable Energy JSC, SR2O Holdings LLC, Klean Industries Inc, Polimix, Delta Energy LLC, Reoil Sp z o o, Bolder Industries, Scandinavian Enviro Systems AB, and Alpha Carbone. The report projects a market value exceeding xx Million by 2033.
Recovered Carbon Black Market Market Dynamics & Concentration
The rCB market is characterized by a moderate level of concentration, with a few major players holding significant market share. However, the market is also witnessing the emergence of several innovative companies, particularly in the development of advanced pyrolysis technologies. The market share of the top 5 players is estimated at xx%, indicating a relatively fragmented landscape with opportunities for both established and new entrants. Innovation in pyrolysis technologies and the increasing demand for sustainable materials are key drivers. Stringent environmental regulations globally are pushing the adoption of rCB as a more sustainable alternative to virgin carbon black. The presence of substitute materials, such as bio-based carbon black, poses a challenge, but the superior performance and cost-effectiveness of rCB in several applications maintain its market relevance. M&A activities in the sector have been relatively moderate, with approximately xx deals recorded in the last five years. This indicates consolidation and strategic expansion among key players. End-user trends point towards increased demand from the automotive and tire industries, driven by stricter regulations and a growing focus on sustainability.
- Market Concentration: xx% held by top 5 players
- M&A Deal Count (2019-2024): xx
- Key Innovation Drivers: Pyrolysis technology advancements, sustainable material demand.
- Regulatory Framework: Increasingly stringent environmental regulations.
- Product Substitutes: Bio-based carbon black.
Recovered Carbon Black Market Industry Trends & Analysis
The rCB market is experiencing robust growth, driven by several factors. The rising global demand for sustainable materials, coupled with stringent environmental regulations promoting recycled content, is a primary catalyst. Technological advancements in pyrolysis technology have significantly improved the quality and cost-effectiveness of rCB, making it a more viable alternative to virgin carbon black. Consumer preferences are shifting towards environmentally friendly products, further boosting the adoption of rCB across various applications. The competitive dynamics are characterized by both intense competition and collaborative partnerships. Major players are investing heavily in R&D and strategic collaborations to enhance their market position. The market is estimated to witness a CAGR of xx% during the forecast period (2025-2033), with market penetration increasing from xx% in 2025 to xx% in 2033. This growth is primarily fueled by increasing awareness of sustainability issues and growing government support for the recycling industry.
Leading Markets & Segments in Recovered Carbon Black Market
The automotive industry is the leading end-user segment, driven by stringent regulations related to tire and automotive component recycling. The tire application segment dominates the rCB market owing to its significant volume and established recycling infrastructure. Geographically, Europe and North America are currently the leading markets, benefiting from advanced recycling technologies and strong environmental regulations.
- Dominant Region: Europe
- Dominant Application: Tires
- Dominant End-User Industry: Automotive
- Key Drivers (Europe): Stringent environmental policies, well-established recycling infrastructure, high consumer awareness.
- Key Drivers (North America): Growing focus on sustainability, increasing government support for recycling initiatives, presence of major automotive manufacturers.
Recovered Carbon Black Market Product Developments
Significant advancements have been made in rCB production technology, primarily through optimization of pyrolysis processes. This has led to the development of high-quality rCB with improved properties comparable to virgin carbon black, expanding its application range. The production of pelletized rCB, as demonstrated by Pyrum Innovations AG, significantly improves its handling and transportability, enhancing its market competitiveness. The ongoing focus is on improving the consistency and quality of rCB to further expand its applications beyond tires to other segments like plastics and batteries.
Key Drivers of Recovered Carbon Black Market Growth
The rCB market's growth is fueled by a confluence of factors. Stringent environmental regulations worldwide are incentivizing the adoption of recycled materials. The increasing cost of virgin carbon black and its environmental footprint makes rCB a cost-effective and sustainable alternative. Advancements in pyrolysis technologies are producing higher-quality rCB with enhanced properties, expanding its applications. Growing consumer awareness of sustainability and environmentally friendly products also contributes significantly to its increasing demand.
Challenges in the Recovered Carbon Black Market Market
Despite the positive outlook, several challenges hinder market growth. The inconsistent quality of rCB from different sources remains a concern, impacting its broader adoption. The establishment of efficient collection and recycling infrastructure for end-of-life materials is crucial but often faces logistical and financial hurdles. Competition from virgin carbon black and other substitutes, including bio-based alternatives, continues to put pressure on pricing and market share.
Emerging Opportunities in Recovered Carbon Black Market
The rCB market presents significant long-term growth opportunities. Further technological advancements in pyrolysis and other recycling technologies will enhance the quality and consistency of rCB, enabling its penetration into new applications. Strategic partnerships between rCB producers, material manufacturers, and end-users are creating streamlined supply chains and expanding market access. Government policies and incentives supporting the development and adoption of recycled materials are driving innovation and market expansion.
Leading Players in the Recovered Carbon Black Market Sector
- Enrestec Inc
- Strebl Green Carbon Pte Ltd
- Black Bear Carbon B V
- Dron Industries
- Pyrum Innovations AG
- Carbon Recovery GmbH
- DVA Renewable Energy JSC
- SR2O Holdings LLC
- Klean Industries Inc
- Polimix
- Delta Energy LLC
- Reoil Sp z o o
- Bolder Industries
- Scandinavian Enviro Systems AB
- Alpha Carbone
Key Milestones in Recovered Carbon Black Market Industry
- April 2020: Scandinavian Enviro Systems AB and Michelin partnered to develop innovative rCB technology for used tires.
- March 2022: Continental AG expanded its partnership with Pyrum Innovations AG to optimize tire recycling and rCB production for tire manufacturing.
- May 2022: Pyrum Innovations AG started test operations of a new pelletizer, improving rCB transportability and processing.
Strategic Outlook for Recovered Carbon Black Market Market
The rCB market shows immense potential for growth driven by increasing environmental awareness and supportive government regulations. Strategic partnerships, technological advancements, and expansion into new applications are key to unlocking this potential. Companies focusing on quality improvement, cost reduction, and efficient supply chains will be best positioned for success in this dynamic and rapidly expanding market.
Recovered Carbon Black Market Segmentation
-
1. Application
- 1.1. Tires
- 1.2. Batteries
- 1.3. Plastics
- 1.4. Non-Tire Rubber
- 1.5. Dyes and Pigments
-
2. End-user Industry
- 2.1. Printing and Packaging
- 2.2. Industrial
- 2.3. Building and Construction
- 2.4. Electronics
- 2.5. Automotive
- 2.6. Other End-user Industries
Recovered Carbon Black Market Segmentation By Geography
-
1. Asia Pacific
- 1.1. China
- 1.2. India
- 1.3. Japan
- 1.4. South Korea
- 1.5. Rest of Asia Pacific
-
2. North America
- 2.1. United States
- 2.2. Canada
- 2.3. Mexico
-
3. Europe
- 3.1. Germany
- 3.2. United Kingdom
- 3.3. Italy
- 3.4. France
- 3.5. Rest of Europe
-
4. South America
- 4.1. Brazil
- 4.2. Argentina
- 4.3. Rest of South America
-
5. Middle East and Africa
- 5.1. Saudi Arabia
- 5.2. South Africa
- 5.3. Rest of Middle East and Africa
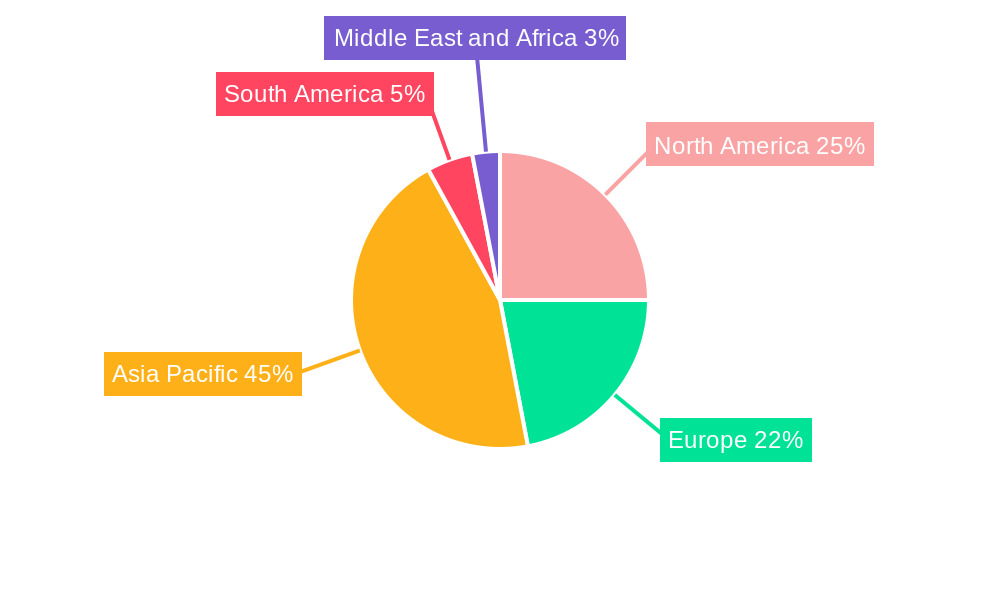
Recovered Carbon Black Market Regional Market Share
Geographic Coverage of Recovered Carbon Black Market
Recovered Carbon Black Market REPORT HIGHLIGHTS
| Aspects | Details |
|---|---|
| Study Period | 2020-2034 |
| Base Year | 2025 |
| Estimated Year | 2026 |
| Forecast Period | 2026-2034 |
| Historical Period | 2020-2025 |
| Growth Rate | CAGR of 4.8% from 2020-2034 |
| Segmentation |
|
Table of Contents
- 1. Introduction
- 1.1. Research Scope
- 1.2. Market Segmentation
- 1.3. Research Objective
- 1.4. Definitions and Assumptions
- 2. Executive Summary
- 2.1. Market Snapshot
- 3. Market Dynamics
- 3.1. Market Drivers
- 3.2. Market Restrains
- 3.3. Market Trends
- 3.4. Market Opportunities
- 4. Market Factor Analysis
- 4.1. Porters Five Forces
- 4.1.1. Bargaining Power of Suppliers
- 4.1.2. Bargaining Power of Buyers
- 4.1.3. Threat of New Entrants
- 4.1.4. Threat of Substitutes
- 4.1.5. Competitive Rivalry
- 4.2. PESTEL analysis
- 4.3. BCG Analysis
- 4.3.1. Stars (High Growth, High Market Share)
- 4.3.2. Cash Cows (Low Growth, High Market Share)
- 4.3.3. Question Mark (High Growth, Low Market Share)
- 4.3.4. Dogs (Low Growth, Low Market Share)
- 4.4. Ansoff Matrix Analysis
- 4.5. Supply Chain Analysis
- 4.6. Regulatory Landscape
- 4.7. Current Market Potential and Opportunity Assessment (TAM–SAM–SOM Framework)
- 4.8. MDP Analyst Note
- 4.1. Porters Five Forces
- 5. Market Analysis, Insights and Forecast 2021-2033
- 5.1. Market Analysis, Insights and Forecast - by Application
- 5.1.1. Tires
- 5.1.2. Batteries
- 5.1.3. Plastics
- 5.1.4. Non-Tire Rubber
- 5.1.5. Dyes and Pigments
- 5.2. Market Analysis, Insights and Forecast - by End-user Industry
- 5.2.1. Printing and Packaging
- 5.2.2. Industrial
- 5.2.3. Building and Construction
- 5.2.4. Electronics
- 5.2.5. Automotive
- 5.2.6. Other End-user Industries
- 5.3. Market Analysis, Insights and Forecast - by Region
- 5.3.1. Asia Pacific
- 5.3.2. North America
- 5.3.3. Europe
- 5.3.4. South America
- 5.3.5. Middle East and Africa
- 5.1. Market Analysis, Insights and Forecast - by Application
- 6. Global Recovered Carbon Black Market Analysis, Insights and Forecast, 2021-2033
- 6.1. Market Analysis, Insights and Forecast - by Application
- 6.1.1. Tires
- 6.1.2. Batteries
- 6.1.3. Plastics
- 6.1.4. Non-Tire Rubber
- 6.1.5. Dyes and Pigments
- 6.2. Market Analysis, Insights and Forecast - by End-user Industry
- 6.2.1. Printing and Packaging
- 6.2.2. Industrial
- 6.2.3. Building and Construction
- 6.2.4. Electronics
- 6.2.5. Automotive
- 6.2.6. Other End-user Industries
- 6.1. Market Analysis, Insights and Forecast - by Application
- 7. Asia Pacific Recovered Carbon Black Market Analysis, Insights and Forecast, 2020-2032
- 7.1. Market Analysis, Insights and Forecast - by Application
- 7.1.1. Tires
- 7.1.2. Batteries
- 7.1.3. Plastics
- 7.1.4. Non-Tire Rubber
- 7.1.5. Dyes and Pigments
- 7.2. Market Analysis, Insights and Forecast - by End-user Industry
- 7.2.1. Printing and Packaging
- 7.2.2. Industrial
- 7.2.3. Building and Construction
- 7.2.4. Electronics
- 7.2.5. Automotive
- 7.2.6. Other End-user Industries
- 7.1. Market Analysis, Insights and Forecast - by Application
- 8. North America Recovered Carbon Black Market Analysis, Insights and Forecast, 2020-2032
- 8.1. Market Analysis, Insights and Forecast - by Application
- 8.1.1. Tires
- 8.1.2. Batteries
- 8.1.3. Plastics
- 8.1.4. Non-Tire Rubber
- 8.1.5. Dyes and Pigments
- 8.2. Market Analysis, Insights and Forecast - by End-user Industry
- 8.2.1. Printing and Packaging
- 8.2.2. Industrial
- 8.2.3. Building and Construction
- 8.2.4. Electronics
- 8.2.5. Automotive
- 8.2.6. Other End-user Industries
- 8.1. Market Analysis, Insights and Forecast - by Application
- 9. Europe Recovered Carbon Black Market Analysis, Insights and Forecast, 2020-2032
- 9.1. Market Analysis, Insights and Forecast - by Application
- 9.1.1. Tires
- 9.1.2. Batteries
- 9.1.3. Plastics
- 9.1.4. Non-Tire Rubber
- 9.1.5. Dyes and Pigments
- 9.2. Market Analysis, Insights and Forecast - by End-user Industry
- 9.2.1. Printing and Packaging
- 9.2.2. Industrial
- 9.2.3. Building and Construction
- 9.2.4. Electronics
- 9.2.5. Automotive
- 9.2.6. Other End-user Industries
- 9.1. Market Analysis, Insights and Forecast - by Application
- 10. South America Recovered Carbon Black Market Analysis, Insights and Forecast, 2020-2032
- 10.1. Market Analysis, Insights and Forecast - by Application
- 10.1.1. Tires
- 10.1.2. Batteries
- 10.1.3. Plastics
- 10.1.4. Non-Tire Rubber
- 10.1.5. Dyes and Pigments
- 10.2. Market Analysis, Insights and Forecast - by End-user Industry
- 10.2.1. Printing and Packaging
- 10.2.2. Industrial
- 10.2.3. Building and Construction
- 10.2.4. Electronics
- 10.2.5. Automotive
- 10.2.6. Other End-user Industries
- 10.1. Market Analysis, Insights and Forecast - by Application
- 11. Middle East and Africa Recovered Carbon Black Market Analysis, Insights and Forecast, 2020-2032
- 11.1. Market Analysis, Insights and Forecast - by Application
- 11.1.1. Tires
- 11.1.2. Batteries
- 11.1.3. Plastics
- 11.1.4. Non-Tire Rubber
- 11.1.5. Dyes and Pigments
- 11.2. Market Analysis, Insights and Forecast - by End-user Industry
- 11.2.1. Printing and Packaging
- 11.2.2. Industrial
- 11.2.3. Building and Construction
- 11.2.4. Electronics
- 11.2.5. Automotive
- 11.2.6. Other End-user Industries
- 11.1. Market Analysis, Insights and Forecast - by Application
- 12. Competitive Analysis
- 12.1. Company Profiles
- 12.1.1 Enrestec Inc
- 12.1.1.1. Company Overview
- 12.1.1.2. Products
- 12.1.1.3. Company Financials
- 12.1.1.4. SWOT Analysis
- 12.1.2 Strebl Green Carbon Pte Ltd
- 12.1.2.1. Company Overview
- 12.1.2.2. Products
- 12.1.2.3. Company Financials
- 12.1.2.4. SWOT Analysis
- 12.1.3 Black Bear Carbon B V
- 12.1.3.1. Company Overview
- 12.1.3.2. Products
- 12.1.3.3. Company Financials
- 12.1.3.4. SWOT Analysis
- 12.1.4 Dron Industries
- 12.1.4.1. Company Overview
- 12.1.4.2. Products
- 12.1.4.3. Company Financials
- 12.1.4.4. SWOT Analysis
- 12.1.5 Pyrum Innovations AG
- 12.1.5.1. Company Overview
- 12.1.5.2. Products
- 12.1.5.3. Company Financials
- 12.1.5.4. SWOT Analysis
- 12.1.6 Carbon Recovery GmbH
- 12.1.6.1. Company Overview
- 12.1.6.2. Products
- 12.1.6.3. Company Financials
- 12.1.6.4. SWOT Analysis
- 12.1.7 DVA Renewable Energy JSC
- 12.1.7.1. Company Overview
- 12.1.7.2. Products
- 12.1.7.3. Company Financials
- 12.1.7.4. SWOT Analysis
- 12.1.8 SR2O Holdings LLC
- 12.1.8.1. Company Overview
- 12.1.8.2. Products
- 12.1.8.3. Company Financials
- 12.1.8.4. SWOT Analysis
- 12.1.9 Klean Industries Inc
- 12.1.9.1. Company Overview
- 12.1.9.2. Products
- 12.1.9.3. Company Financials
- 12.1.9.4. SWOT Analysis
- 12.1.10 Polimix
- 12.1.10.1. Company Overview
- 12.1.10.2. Products
- 12.1.10.3. Company Financials
- 12.1.10.4. SWOT Analysis
- 12.1.11 Delta Energy LLC
- 12.1.11.1. Company Overview
- 12.1.11.2. Products
- 12.1.11.3. Company Financials
- 12.1.11.4. SWOT Analysis
- 12.1.12 Reoil Sp z o o
- 12.1.12.1. Company Overview
- 12.1.12.2. Products
- 12.1.12.3. Company Financials
- 12.1.12.4. SWOT Analysis
- 12.1.13 Bolder Industries
- 12.1.13.1. Company Overview
- 12.1.13.2. Products
- 12.1.13.3. Company Financials
- 12.1.13.4. SWOT Analysis
- 12.1.14 Scandinavian Enviro Systems AB
- 12.1.14.1. Company Overview
- 12.1.14.2. Products
- 12.1.14.3. Company Financials
- 12.1.14.4. SWOT Analysis
- 12.1.15 Alpha Carbone
- 12.1.15.1. Company Overview
- 12.1.15.2. Products
- 12.1.15.3. Company Financials
- 12.1.15.4. SWOT Analysis
- 12.1.1 Enrestec Inc
- 12.2. Market Entropy
- 12.2.1 Company's Key Areas Served
- 12.2.2 Recent Developments
- 12.3. Company Market Share Analysis 2025
- 12.3.1 Top 5 Companies Market Share Analysis
- 12.3.2 Top 3 Companies Market Share Analysis
- 12.4. List of Potential Customers
- 13. Research Methodology
List of Figures
- Figure 1: Global Recovered Carbon Black Market Revenue Breakdown (billion, %) by Region 2025 & 2033
- Figure 2: Global Recovered Carbon Black Market Volume Breakdown (K Tons, %) by Region 2025 & 2033
- Figure 3: Asia Pacific Recovered Carbon Black Market Revenue (billion), by Application 2025 & 2033
- Figure 4: Asia Pacific Recovered Carbon Black Market Volume (K Tons), by Application 2025 & 2033
- Figure 5: Asia Pacific Recovered Carbon Black Market Revenue Share (%), by Application 2025 & 2033
- Figure 6: Asia Pacific Recovered Carbon Black Market Volume Share (%), by Application 2025 & 2033
- Figure 7: Asia Pacific Recovered Carbon Black Market Revenue (billion), by End-user Industry 2025 & 2033
- Figure 8: Asia Pacific Recovered Carbon Black Market Volume (K Tons), by End-user Industry 2025 & 2033
- Figure 9: Asia Pacific Recovered Carbon Black Market Revenue Share (%), by End-user Industry 2025 & 2033
- Figure 10: Asia Pacific Recovered Carbon Black Market Volume Share (%), by End-user Industry 2025 & 2033
- Figure 11: Asia Pacific Recovered Carbon Black Market Revenue (billion), by Country 2025 & 2033
- Figure 12: Asia Pacific Recovered Carbon Black Market Volume (K Tons), by Country 2025 & 2033
- Figure 13: Asia Pacific Recovered Carbon Black Market Revenue Share (%), by Country 2025 & 2033
- Figure 14: Asia Pacific Recovered Carbon Black Market Volume Share (%), by Country 2025 & 2033
- Figure 15: North America Recovered Carbon Black Market Revenue (billion), by Application 2025 & 2033
- Figure 16: North America Recovered Carbon Black Market Volume (K Tons), by Application 2025 & 2033
- Figure 17: North America Recovered Carbon Black Market Revenue Share (%), by Application 2025 & 2033
- Figure 18: North America Recovered Carbon Black Market Volume Share (%), by Application 2025 & 2033
- Figure 19: North America Recovered Carbon Black Market Revenue (billion), by End-user Industry 2025 & 2033
- Figure 20: North America Recovered Carbon Black Market Volume (K Tons), by End-user Industry 2025 & 2033
- Figure 21: North America Recovered Carbon Black Market Revenue Share (%), by End-user Industry 2025 & 2033
- Figure 22: North America Recovered Carbon Black Market Volume Share (%), by End-user Industry 2025 & 2033
- Figure 23: North America Recovered Carbon Black Market Revenue (billion), by Country 2025 & 2033
- Figure 24: North America Recovered Carbon Black Market Volume (K Tons), by Country 2025 & 2033
- Figure 25: North America Recovered Carbon Black Market Revenue Share (%), by Country 2025 & 2033
- Figure 26: North America Recovered Carbon Black Market Volume Share (%), by Country 2025 & 2033
- Figure 27: Europe Recovered Carbon Black Market Revenue (billion), by Application 2025 & 2033
- Figure 28: Europe Recovered Carbon Black Market Volume (K Tons), by Application 2025 & 2033
- Figure 29: Europe Recovered Carbon Black Market Revenue Share (%), by Application 2025 & 2033
- Figure 30: Europe Recovered Carbon Black Market Volume Share (%), by Application 2025 & 2033
- Figure 31: Europe Recovered Carbon Black Market Revenue (billion), by End-user Industry 2025 & 2033
- Figure 32: Europe Recovered Carbon Black Market Volume (K Tons), by End-user Industry 2025 & 2033
- Figure 33: Europe Recovered Carbon Black Market Revenue Share (%), by End-user Industry 2025 & 2033
- Figure 34: Europe Recovered Carbon Black Market Volume Share (%), by End-user Industry 2025 & 2033
- Figure 35: Europe Recovered Carbon Black Market Revenue (billion), by Country 2025 & 2033
- Figure 36: Europe Recovered Carbon Black Market Volume (K Tons), by Country 2025 & 2033
- Figure 37: Europe Recovered Carbon Black Market Revenue Share (%), by Country 2025 & 2033
- Figure 38: Europe Recovered Carbon Black Market Volume Share (%), by Country 2025 & 2033
- Figure 39: South America Recovered Carbon Black Market Revenue (billion), by Application 2025 & 2033
- Figure 40: South America Recovered Carbon Black Market Volume (K Tons), by Application 2025 & 2033
- Figure 41: South America Recovered Carbon Black Market Revenue Share (%), by Application 2025 & 2033
- Figure 42: South America Recovered Carbon Black Market Volume Share (%), by Application 2025 & 2033
- Figure 43: South America Recovered Carbon Black Market Revenue (billion), by End-user Industry 2025 & 2033
- Figure 44: South America Recovered Carbon Black Market Volume (K Tons), by End-user Industry 2025 & 2033
- Figure 45: South America Recovered Carbon Black Market Revenue Share (%), by End-user Industry 2025 & 2033
- Figure 46: South America Recovered Carbon Black Market Volume Share (%), by End-user Industry 2025 & 2033
- Figure 47: South America Recovered Carbon Black Market Revenue (billion), by Country 2025 & 2033
- Figure 48: South America Recovered Carbon Black Market Volume (K Tons), by Country 2025 & 2033
- Figure 49: South America Recovered Carbon Black Market Revenue Share (%), by Country 2025 & 2033
- Figure 50: South America Recovered Carbon Black Market Volume Share (%), by Country 2025 & 2033
- Figure 51: Middle East and Africa Recovered Carbon Black Market Revenue (billion), by Application 2025 & 2033
- Figure 52: Middle East and Africa Recovered Carbon Black Market Volume (K Tons), by Application 2025 & 2033
- Figure 53: Middle East and Africa Recovered Carbon Black Market Revenue Share (%), by Application 2025 & 2033
- Figure 54: Middle East and Africa Recovered Carbon Black Market Volume Share (%), by Application 2025 & 2033
- Figure 55: Middle East and Africa Recovered Carbon Black Market Revenue (billion), by End-user Industry 2025 & 2033
- Figure 56: Middle East and Africa Recovered Carbon Black Market Volume (K Tons), by End-user Industry 2025 & 2033
- Figure 57: Middle East and Africa Recovered Carbon Black Market Revenue Share (%), by End-user Industry 2025 & 2033
- Figure 58: Middle East and Africa Recovered Carbon Black Market Volume Share (%), by End-user Industry 2025 & 2033
- Figure 59: Middle East and Africa Recovered Carbon Black Market Revenue (billion), by Country 2025 & 2033
- Figure 60: Middle East and Africa Recovered Carbon Black Market Volume (K Tons), by Country 2025 & 2033
- Figure 61: Middle East and Africa Recovered Carbon Black Market Revenue Share (%), by Country 2025 & 2033
- Figure 62: Middle East and Africa Recovered Carbon Black Market Volume Share (%), by Country 2025 & 2033
List of Tables
- Table 1: Global Recovered Carbon Black Market Revenue billion Forecast, by Application 2020 & 2033
- Table 2: Global Recovered Carbon Black Market Volume K Tons Forecast, by Application 2020 & 2033
- Table 3: Global Recovered Carbon Black Market Revenue billion Forecast, by End-user Industry 2020 & 2033
- Table 4: Global Recovered Carbon Black Market Volume K Tons Forecast, by End-user Industry 2020 & 2033
- Table 5: Global Recovered Carbon Black Market Revenue billion Forecast, by Region 2020 & 2033
- Table 6: Global Recovered Carbon Black Market Volume K Tons Forecast, by Region 2020 & 2033
- Table 7: Global Recovered Carbon Black Market Revenue billion Forecast, by Application 2020 & 2033
- Table 8: Global Recovered Carbon Black Market Volume K Tons Forecast, by Application 2020 & 2033
- Table 9: Global Recovered Carbon Black Market Revenue billion Forecast, by End-user Industry 2020 & 2033
- Table 10: Global Recovered Carbon Black Market Volume K Tons Forecast, by End-user Industry 2020 & 2033
- Table 11: Global Recovered Carbon Black Market Revenue billion Forecast, by Country 2020 & 2033
- Table 12: Global Recovered Carbon Black Market Volume K Tons Forecast, by Country 2020 & 2033
- Table 13: China Recovered Carbon Black Market Revenue (billion) Forecast, by Application 2020 & 2033
- Table 14: China Recovered Carbon Black Market Volume (K Tons) Forecast, by Application 2020 & 2033
- Table 15: India Recovered Carbon Black Market Revenue (billion) Forecast, by Application 2020 & 2033
- Table 16: India Recovered Carbon Black Market Volume (K Tons) Forecast, by Application 2020 & 2033
- Table 17: Japan Recovered Carbon Black Market Revenue (billion) Forecast, by Application 2020 & 2033
- Table 18: Japan Recovered Carbon Black Market Volume (K Tons) Forecast, by Application 2020 & 2033
- Table 19: South Korea Recovered Carbon Black Market Revenue (billion) Forecast, by Application 2020 & 2033
- Table 20: South Korea Recovered Carbon Black Market Volume (K Tons) Forecast, by Application 2020 & 2033
- Table 21: Rest of Asia Pacific Recovered Carbon Black Market Revenue (billion) Forecast, by Application 2020 & 2033
- Table 22: Rest of Asia Pacific Recovered Carbon Black Market Volume (K Tons) Forecast, by Application 2020 & 2033
- Table 23: Global Recovered Carbon Black Market Revenue billion Forecast, by Application 2020 & 2033
- Table 24: Global Recovered Carbon Black Market Volume K Tons Forecast, by Application 2020 & 2033
- Table 25: Global Recovered Carbon Black Market Revenue billion Forecast, by End-user Industry 2020 & 2033
- Table 26: Global Recovered Carbon Black Market Volume K Tons Forecast, by End-user Industry 2020 & 2033
- Table 27: Global Recovered Carbon Black Market Revenue billion Forecast, by Country 2020 & 2033
- Table 28: Global Recovered Carbon Black Market Volume K Tons Forecast, by Country 2020 & 2033
- Table 29: United States Recovered Carbon Black Market Revenue (billion) Forecast, by Application 2020 & 2033
- Table 30: United States Recovered Carbon Black Market Volume (K Tons) Forecast, by Application 2020 & 2033
- Table 31: Canada Recovered Carbon Black Market Revenue (billion) Forecast, by Application 2020 & 2033
- Table 32: Canada Recovered Carbon Black Market Volume (K Tons) Forecast, by Application 2020 & 2033
- Table 33: Mexico Recovered Carbon Black Market Revenue (billion) Forecast, by Application 2020 & 2033
- Table 34: Mexico Recovered Carbon Black Market Volume (K Tons) Forecast, by Application 2020 & 2033
- Table 35: Global Recovered Carbon Black Market Revenue billion Forecast, by Application 2020 & 2033
- Table 36: Global Recovered Carbon Black Market Volume K Tons Forecast, by Application 2020 & 2033
- Table 37: Global Recovered Carbon Black Market Revenue billion Forecast, by End-user Industry 2020 & 2033
- Table 38: Global Recovered Carbon Black Market Volume K Tons Forecast, by End-user Industry 2020 & 2033
- Table 39: Global Recovered Carbon Black Market Revenue billion Forecast, by Country 2020 & 2033
- Table 40: Global Recovered Carbon Black Market Volume K Tons Forecast, by Country 2020 & 2033
- Table 41: Germany Recovered Carbon Black Market Revenue (billion) Forecast, by Application 2020 & 2033
- Table 42: Germany Recovered Carbon Black Market Volume (K Tons) Forecast, by Application 2020 & 2033
- Table 43: United Kingdom Recovered Carbon Black Market Revenue (billion) Forecast, by Application 2020 & 2033
- Table 44: United Kingdom Recovered Carbon Black Market Volume (K Tons) Forecast, by Application 2020 & 2033
- Table 45: Italy Recovered Carbon Black Market Revenue (billion) Forecast, by Application 2020 & 2033
- Table 46: Italy Recovered Carbon Black Market Volume (K Tons) Forecast, by Application 2020 & 2033
- Table 47: France Recovered Carbon Black Market Revenue (billion) Forecast, by Application 2020 & 2033
- Table 48: France Recovered Carbon Black Market Volume (K Tons) Forecast, by Application 2020 & 2033
- Table 49: Rest of Europe Recovered Carbon Black Market Revenue (billion) Forecast, by Application 2020 & 2033
- Table 50: Rest of Europe Recovered Carbon Black Market Volume (K Tons) Forecast, by Application 2020 & 2033
- Table 51: Global Recovered Carbon Black Market Revenue billion Forecast, by Application 2020 & 2033
- Table 52: Global Recovered Carbon Black Market Volume K Tons Forecast, by Application 2020 & 2033
- Table 53: Global Recovered Carbon Black Market Revenue billion Forecast, by End-user Industry 2020 & 2033
- Table 54: Global Recovered Carbon Black Market Volume K Tons Forecast, by End-user Industry 2020 & 2033
- Table 55: Global Recovered Carbon Black Market Revenue billion Forecast, by Country 2020 & 2033
- Table 56: Global Recovered Carbon Black Market Volume K Tons Forecast, by Country 2020 & 2033
- Table 57: Brazil Recovered Carbon Black Market Revenue (billion) Forecast, by Application 2020 & 2033
- Table 58: Brazil Recovered Carbon Black Market Volume (K Tons) Forecast, by Application 2020 & 2033
- Table 59: Argentina Recovered Carbon Black Market Revenue (billion) Forecast, by Application 2020 & 2033
- Table 60: Argentina Recovered Carbon Black Market Volume (K Tons) Forecast, by Application 2020 & 2033
- Table 61: Rest of South America Recovered Carbon Black Market Revenue (billion) Forecast, by Application 2020 & 2033
- Table 62: Rest of South America Recovered Carbon Black Market Volume (K Tons) Forecast, by Application 2020 & 2033
- Table 63: Global Recovered Carbon Black Market Revenue billion Forecast, by Application 2020 & 2033
- Table 64: Global Recovered Carbon Black Market Volume K Tons Forecast, by Application 2020 & 2033
- Table 65: Global Recovered Carbon Black Market Revenue billion Forecast, by End-user Industry 2020 & 2033
- Table 66: Global Recovered Carbon Black Market Volume K Tons Forecast, by End-user Industry 2020 & 2033
- Table 67: Global Recovered Carbon Black Market Revenue billion Forecast, by Country 2020 & 2033
- Table 68: Global Recovered Carbon Black Market Volume K Tons Forecast, by Country 2020 & 2033
- Table 69: Saudi Arabia Recovered Carbon Black Market Revenue (billion) Forecast, by Application 2020 & 2033
- Table 70: Saudi Arabia Recovered Carbon Black Market Volume (K Tons) Forecast, by Application 2020 & 2033
- Table 71: South Africa Recovered Carbon Black Market Revenue (billion) Forecast, by Application 2020 & 2033
- Table 72: South Africa Recovered Carbon Black Market Volume (K Tons) Forecast, by Application 2020 & 2033
- Table 73: Rest of Middle East and Africa Recovered Carbon Black Market Revenue (billion) Forecast, by Application 2020 & 2033
- Table 74: Rest of Middle East and Africa Recovered Carbon Black Market Volume (K Tons) Forecast, by Application 2020 & 2033
Frequently Asked Questions
1. What is the projected Compound Annual Growth Rate (CAGR) of the Recovered Carbon Black Market?
The projected CAGR is approximately 4.8%.
2. Which companies are prominent players in the Recovered Carbon Black Market?
Key companies in the market include Enrestec Inc, Strebl Green Carbon Pte Ltd, Black Bear Carbon B V, Dron Industries, Pyrum Innovations AG, Carbon Recovery GmbH, DVA Renewable Energy JSC, SR2O Holdings LLC, Klean Industries Inc, Polimix, Delta Energy LLC, Reoil Sp z o o, Bolder Industries, Scandinavian Enviro Systems AB, Alpha Carbone.
3. What are the main segments of the Recovered Carbon Black Market?
The market segments include Application, End-user Industry.
4. Can you provide details about the market size?
The market size is estimated to be USD 14.5 billion as of 2022.
5. What are some drivers contributing to market growth?
Rising Demand for Recycled and Recovered Products; Increasing Usages as Sustainable Filler in Tire and Non-tire Rubber Applications.
6. What are the notable trends driving market growth?
Increasing Usage in the Tire Industry.
7. Are there any restraints impacting market growth?
Lack of Infrastructure and Technologies for Recovered Carbon Black; Providing Consistent Quality of Recovered Carbon Black.
8. Can you provide examples of recent developments in the market?
In May 2022, Pyrum Innovations AG started the test operation of a new pelletizer at its plant site in Germany, which will enable the recovered carbon black (rCB) obtained via the pyrolysis process to be bonded into pellets, to increase their transportability and facilitates the further processing of the raw material.
9. What pricing options are available for accessing the report?
Pricing options include single-user, multi-user, and enterprise licenses priced at USD 4750, USD 5250, and USD 8750 respectively.
10. Is the market size provided in terms of value or volume?
The market size is provided in terms of value, measured in billion and volume, measured in K Tons.
11. Are there any specific market keywords associated with the report?
Yes, the market keyword associated with the report is "Recovered Carbon Black Market," which aids in identifying and referencing the specific market segment covered.
12. How do I determine which pricing option suits my needs best?
The pricing options vary based on user requirements and access needs. Individual users may opt for single-user licenses, while businesses requiring broader access may choose multi-user or enterprise licenses for cost-effective access to the report.
13. Are there any additional resources or data provided in the Recovered Carbon Black Market report?
While the report offers comprehensive insights, it's advisable to review the specific contents or supplementary materials provided to ascertain if additional resources or data are available.
14. How can I stay updated on further developments or reports in the Recovered Carbon Black Market?
To stay informed about further developments, trends, and reports in the Recovered Carbon Black Market, consider subscribing to industry newsletters, following relevant companies and organizations, or regularly checking reputable industry news sources and publications.
Methodology
Step 1 - Identification of Relevant Samples Size from Population Database


Step 2 - Approaches for Defining Global Market Size (Value, Volume* & Price*)

Note*: In applicable scenarios
Step 3 - Data Sources
Primary Research
- Web Analytics
- Survey Reports
- Research Institute
- Latest Research Reports
- Opinion Leaders
Secondary Research
- Annual Reports
- White Paper
- Latest Press Release
- Industry Association
- Paid Database
- Investor Presentations

Step 4 - Data Triangulation
Involves using different sources of information in order to increase the validity of a study
These sources are likely to be stakeholders in a program - participants, other researchers, program staff, other community members, and so on.
Then we put all data in single framework & apply various statistical tools to find out the dynamic on the market.
During the analysis stage, feedback from the stakeholder groups would be compared to determine areas of agreement as well as areas of divergence