

Key Insights
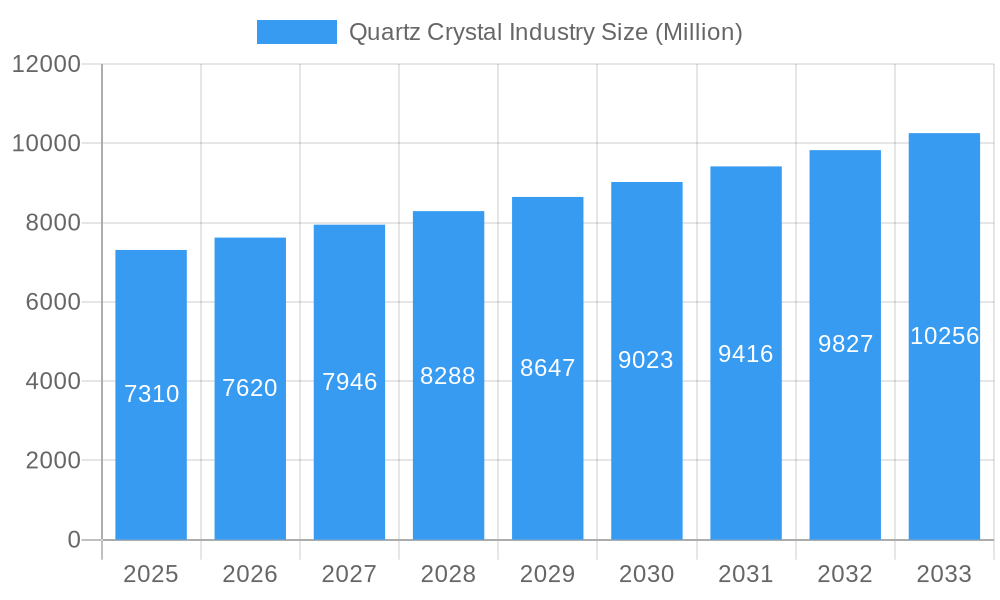
The global quartz crystal market, valued at $7.31 billion in 2025, is projected to experience robust growth, driven by a compound annual growth rate (CAGR) of 4.19% from 2025 to 2033. This expansion is fueled by several key factors. The surging demand for electronics and semiconductors, particularly in the burgeoning fields of 5G technology and artificial intelligence, is a primary driver. The renewable energy sector, specifically solar power, is also significantly contributing to market growth, with quartz crystal playing a crucial role in solar cell manufacturing. Furthermore, the construction industry's increasing adoption of quartz-based materials for its durability and aesthetic appeal further bolsters market expansion. The automotive industry's integration of advanced sensors and electronic components also fuels demand. While supply chain disruptions and fluctuations in raw material prices pose potential restraints, technological advancements leading to higher-purity quartz crystals and improved manufacturing processes are expected to mitigate these challenges and ensure sustained market growth throughout the forecast period.
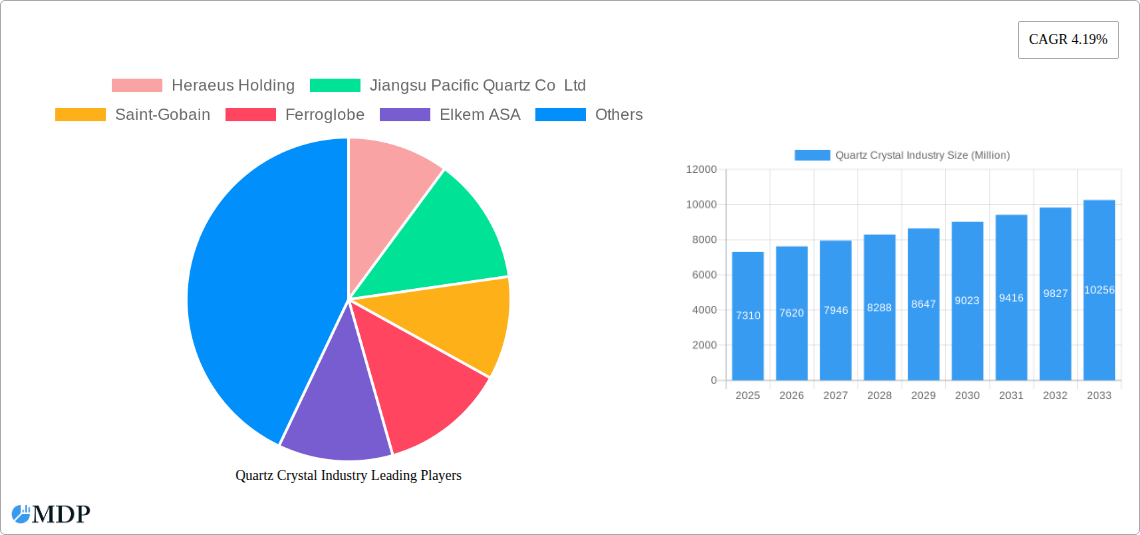
Quartz Crystal Industry Market Size (In Billion)
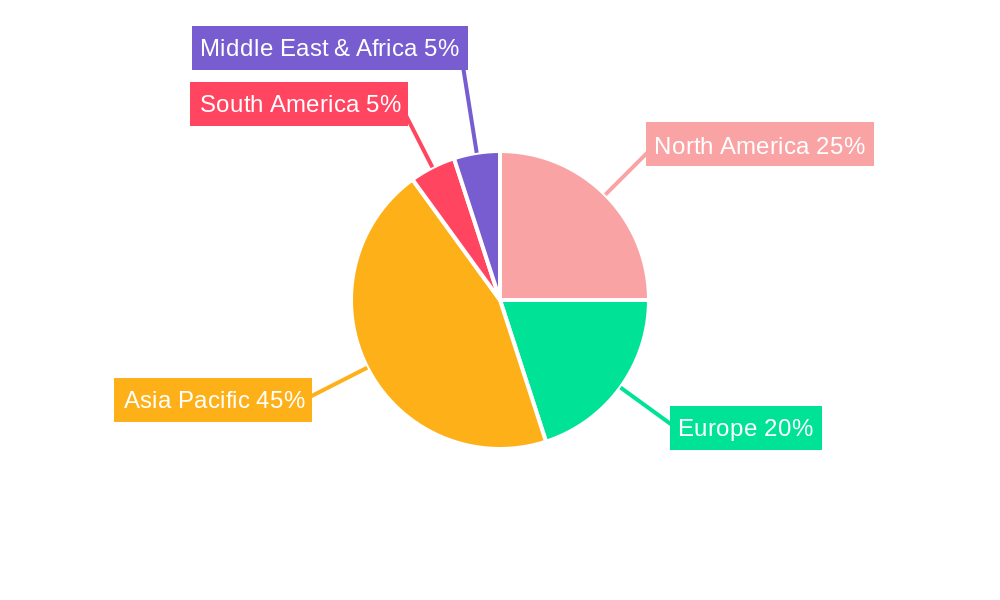
The market segmentation reveals a dominance of high-purity quartz within the type segment, reflecting the increasing demand for precision and performance in various applications. The electronics and semiconductor segment leads among end-user industries, underscoring the sector's critical dependence on quartz crystal components. Geographically, the Asia-Pacific region, particularly China and India, is expected to lead the market, propelled by rapid industrialization and economic growth. North America and Europe also represent substantial markets, with steady growth anticipated due to ongoing technological advancements and increasing adoption across diverse industries. Competition within the market is intense, with established players like Heraeus Holding, Saint-Gobain, and others vying for market share. However, the emergence of new technologies and innovative applications provides opportunities for both established and new market entrants to capitalize on the continued growth trajectory of the quartz crystal market.
Quartz Crystal Industry Company Market Share
Quartz Crystal Industry Market Report: 2019-2033
This comprehensive report provides an in-depth analysis of the global quartz crystal industry, offering invaluable insights for stakeholders across the value chain. With a study period spanning 2019-2033, a base year of 2025, and a forecast period of 2025-2033, this report leverages rigorous data analysis to illuminate market dynamics, trends, and opportunities within this vital sector. The report covers key segments including Quartz Glass and Silicon Metal, focusing on end-user industries like Electronics & Semiconductors, Solar, Buildings & Construction, Optical Fiber & Telecommunication, Automotive, and others. High-purity quartz is a specific area of focus. Key players analyzed include Heraeus Holding, Jiangsu Pacific Quartz Co Ltd, Saint-Gobain, Ferroglobe, Elkem ASA, Wonic QnC Corporation, The Quartz Corporation, Nihon Dempa Kogyo Co Ltd, Sibelco, Nordic Mining ASA, SUMCO Corporation, Dow, RUSNANO Group, AGC Inc, and Beijing Kai de Quartz Co Ltd. The report projects a market value exceeding xx Million by 2033.
Quartz Crystal Industry Market Dynamics & Concentration
The global quartz crystal market exhibits a moderately concentrated landscape, with a few major players holding significant market share. Market concentration is influenced by factors such as economies of scale in production, access to raw materials, and technological expertise. Innovation is a key driver, with ongoing advancements in materials science and manufacturing processes leading to higher purity and performance characteristics. Stringent regulatory frameworks governing environmental impact and worker safety play a crucial role. Product substitutes, while limited, include synthetic materials with comparable properties, but quartz crystal retains its dominance due to its superior performance in many applications. End-user trends such as the growth of the electronics and solar industries significantly impact market demand. Mergers and acquisitions (M&A) activities are a frequent occurrence, as evidenced by Sibelco’s acquisition of Bassanetti Group in December 2022, signifying strategic expansion efforts by larger players.
- Market Share: Top 5 players hold approximately xx% of the global market share (2024).
- M&A Deal Counts: An average of xx deals per year were observed during the historical period (2019-2024).
- Innovation Drivers: Advancements in crystal growth techniques, improved purity levels, and development of specialized coatings.
- Regulatory Impacts: Environmental regulations concerning silica dust emissions and waste management.
Quartz Crystal Industry Industry Trends & Analysis
The quartz crystal industry is experiencing robust growth, driven primarily by the expanding electronics and renewable energy sectors. The compound annual growth rate (CAGR) is projected to be xx% during the forecast period (2025-2033). Technological disruptions, such as the development of advanced manufacturing techniques and the rise of specialized quartz crystal applications, are reshaping the competitive landscape. Consumer preferences towards high-performance, sustainable, and cost-effective products significantly influence market demand. Intense competition among established players and emerging entrants drives innovation and price optimization. Market penetration of high-purity quartz in niche applications is consistently increasing.
Leading Markets & Segments in Quartz Crystal Industry
The Asia-Pacific region dominates the global quartz crystal market, fueled by rapid industrialization, strong economic growth, and a large manufacturing base. China, in particular, plays a key role, due to its significant production capacity and substantial demand from its thriving electronics and solar sectors. Within segments, high-purity quartz commands a premium, driven by its critical role in high-tech applications. The electronics and semiconductor industry remains the largest end-user sector, followed by the solar industry.
- Key Drivers in Asia-Pacific:
- Rapid industrial expansion and urbanization.
- Government incentives for renewable energy adoption.
- Growth of electronics and semiconductor manufacturing.
- Dominant Segment: High-purity quartz holds the largest market share due to its indispensable role in advanced technology applications.
- Largest End-User: Electronics and semiconductors, driven by the proliferation of smartphones, computers, and other electronic devices.
Quartz Crystal Industry Product Developments
Recent product innovations focus on enhancing purity, improving dimensional stability, and developing specialized coatings to meet specific application requirements. These advancements lead to improved performance, enhanced durability, and broader applications across various industries. The key competitive advantages are derived from superior product quality, cost-effectiveness, and reliable supply chains. Technological trends highlight the increasing demand for customized quartz crystal solutions tailored to specific applications.
Key Drivers of Quartz Crystal Industry Growth
The quartz crystal industry's growth is fueled by several factors:
- Technological Advancements: Continuous improvements in crystal growth technology and processing techniques lead to higher purity and improved performance characteristics.
- Economic Growth: Expansion in end-user industries like electronics, solar, and telecommunications drives increased demand for quartz crystal products.
- Government Policies: Government support for renewable energy and technological innovation creates favorable market conditions.
Challenges in the Quartz Crystal Industry Market
The industry faces several challenges:
- Supply Chain Disruptions: Global events can impact the availability of raw materials and affect production timelines. The war in Ukraine, for example, affected supply chains for some producers.
- Price Volatility: Fluctuations in raw material prices and energy costs can significantly impact profitability.
- Intense Competition: Competition among established and emerging players puts downward pressure on prices.
Emerging Opportunities in Quartz Crystal Industry
Emerging opportunities include:
- Technological Breakthroughs: The development of novel quartz crystal applications in emerging technologies like 5G and quantum computing offers significant growth potential.
- Strategic Partnerships: Collaborations between quartz crystal manufacturers and end-user companies can lead to the development of customized solutions and accelerate market penetration.
- Market Expansion: Expanding into new and developing markets with high growth potential presents significant opportunities for growth.
Leading Players in the Quartz Crystal Industry Sector
- Heraeus Holding
- Jiangsu Pacific Quartz Co Ltd
- Saint-Gobain
- Ferroglobe
- Elkem ASA
- Wonic QnC Corporation
- The Quartz Corporation
- Nihon Dempa Kogyo Co Ltd
- Sibelco
- Nordic Mining ASA
- SUMCO Corporation
- Dow
- RUSNANO Group
- AGC Inc
- Beijing Kai de Quartz Co Ltd
Key Milestones in Quartz Crystal Industry Industry
- December 2022: Sibelco acquired Bassanetti Group, strengthening its position in Southern Europe.
- March 2022: AGC Inc terminated operations in Russia and Ukraine due to the ongoing war.
Strategic Outlook for Quartz Crystal Industry Market
The quartz crystal industry is poised for continued growth, driven by technological advancements, increasing demand from key end-user sectors, and strategic expansion into new markets. Opportunities exist for companies to invest in research and development, optimize production processes, and expand their global reach to capitalize on this positive outlook. Strategic partnerships and mergers and acquisitions will continue to shape the industry landscape.
Quartz Crystal Industry Segmentation
-
1. Type
-
1.1. High-purity Quartz
- 1.1.1. Quartz Surface and Tile
- 1.1.2. Fused Quartz Crucible
- 1.1.3. Quartz Glass
- 1.2. Quartz Crystal
- 1.3. Silicon Metal
-
1.1. High-purity Quartz
-
2. End-user Industry
- 2.1. Electronics and Semiconductor
- 2.2. Solar
- 2.3. Buildings and Construction
- 2.4. Optical fiber and Telecommunication
- 2.5. Automotive
- 2.6. Other End-user Industries
Quartz Crystal Industry Segmentation By Geography
-
1. Asia Pacific
- 1.1. China
- 1.2. India
- 1.3. Japan
- 1.4. South Korea
- 1.5. Rest of Asia Pacific
-
2. North America
- 2.1. United States
- 2.2. Canada
- 2.3. Mexico
-
3. Europe
- 3.1. Germany
- 3.2. United Kingdom
- 3.3. Italy
- 3.4. France
- 3.5. Russia
- 3.6. Rest of Europe
-
4. South America
- 4.1. Brazil
- 4.2. Argentina
- 4.3. Rest of South America
- 5. Middle East
-
6. Saudi Arabia
- 6.1. South Africa
- 6.2. Rest of Middle East
Quartz Crystal Industry Regional Market Share
Geographic Coverage of Quartz Crystal Industry
Quartz Crystal Industry REPORT HIGHLIGHTS
| Aspects | Details |
|---|---|
| Study Period | 2020-2034 |
| Base Year | 2025 |
| Estimated Year | 2026 |
| Forecast Period | 2026-2034 |
| Historical Period | 2020-2025 |
| Growth Rate | CAGR of 4.19% from 2020-2034 |
| Segmentation |
|
Table of Contents
- 1. Introduction
- 1.1. Research Scope
- 1.2. Market Segmentation
- 1.3. Research Objective
- 1.4. Definitions and Assumptions
- 2. Executive Summary
- 2.1. Market Snapshot
- 3. Market Dynamics
- 3.1. Market Drivers
- 3.2. Market Restrains
- 3.3. Market Trends
- 3.4. Market Opportunities
- 4. Market Factor Analysis
- 4.1. Porters Five Forces
- 4.1.1. Bargaining Power of Suppliers
- 4.1.2. Bargaining Power of Buyers
- 4.1.3. Threat of New Entrants
- 4.1.4. Threat of Substitutes
- 4.1.5. Competitive Rivalry
- 4.2. PESTEL analysis
- 4.3. BCG Analysis
- 4.3.1. Stars (High Growth, High Market Share)
- 4.3.2. Cash Cows (Low Growth, High Market Share)
- 4.3.3. Question Mark (High Growth, Low Market Share)
- 4.3.4. Dogs (Low Growth, Low Market Share)
- 4.4. Ansoff Matrix Analysis
- 4.5. Supply Chain Analysis
- 4.6. Regulatory Landscape
- 4.7. Current Market Potential and Opportunity Assessment (TAM–SAM–SOM Framework)
- 4.8. MDP Analyst Note
- 4.1. Porters Five Forces
- 5. Market Analysis, Insights and Forecast 2021-2033
- 5.1. Market Analysis, Insights and Forecast - by Type
- 5.1.1. High-purity Quartz
- 5.1.1.1. Quartz Surface and Tile
- 5.1.1.2. Fused Quartz Crucible
- 5.1.1.3. Quartz Glass
- 5.1.2. Quartz Crystal
- 5.1.3. Silicon Metal
- 5.1.1. High-purity Quartz
- 5.2. Market Analysis, Insights and Forecast - by End-user Industry
- 5.2.1. Electronics and Semiconductor
- 5.2.2. Solar
- 5.2.3. Buildings and Construction
- 5.2.4. Optical fiber and Telecommunication
- 5.2.5. Automotive
- 5.2.6. Other End-user Industries
- 5.3. Market Analysis, Insights and Forecast - by Region
- 5.3.1. Asia Pacific
- 5.3.2. North America
- 5.3.3. Europe
- 5.3.4. South America
- 5.3.5. Middle East
- 5.3.6. Saudi Arabia
- 5.1. Market Analysis, Insights and Forecast - by Type
- 6. Global Quartz Crystal Industry Analysis, Insights and Forecast, 2021-2033
- 6.1. Market Analysis, Insights and Forecast - by Type
- 6.1.1. High-purity Quartz
- 6.1.1.1. Quartz Surface and Tile
- 6.1.1.2. Fused Quartz Crucible
- 6.1.1.3. Quartz Glass
- 6.1.2. Quartz Crystal
- 6.1.3. Silicon Metal
- 6.1.1. High-purity Quartz
- 6.2. Market Analysis, Insights and Forecast - by End-user Industry
- 6.2.1. Electronics and Semiconductor
- 6.2.2. Solar
- 6.2.3. Buildings and Construction
- 6.2.4. Optical fiber and Telecommunication
- 6.2.5. Automotive
- 6.2.6. Other End-user Industries
- 6.1. Market Analysis, Insights and Forecast - by Type
- 7. Asia Pacific Quartz Crystal Industry Analysis, Insights and Forecast, 2020-2032
- 7.1. Market Analysis, Insights and Forecast - by Type
- 7.1.1. High-purity Quartz
- 7.1.1.1. Quartz Surface and Tile
- 7.1.1.2. Fused Quartz Crucible
- 7.1.1.3. Quartz Glass
- 7.1.2. Quartz Crystal
- 7.1.3. Silicon Metal
- 7.1.1. High-purity Quartz
- 7.2. Market Analysis, Insights and Forecast - by End-user Industry
- 7.2.1. Electronics and Semiconductor
- 7.2.2. Solar
- 7.2.3. Buildings and Construction
- 7.2.4. Optical fiber and Telecommunication
- 7.2.5. Automotive
- 7.2.6. Other End-user Industries
- 7.1. Market Analysis, Insights and Forecast - by Type
- 8. North America Quartz Crystal Industry Analysis, Insights and Forecast, 2020-2032
- 8.1. Market Analysis, Insights and Forecast - by Type
- 8.1.1. High-purity Quartz
- 8.1.1.1. Quartz Surface and Tile
- 8.1.1.2. Fused Quartz Crucible
- 8.1.1.3. Quartz Glass
- 8.1.2. Quartz Crystal
- 8.1.3. Silicon Metal
- 8.1.1. High-purity Quartz
- 8.2. Market Analysis, Insights and Forecast - by End-user Industry
- 8.2.1. Electronics and Semiconductor
- 8.2.2. Solar
- 8.2.3. Buildings and Construction
- 8.2.4. Optical fiber and Telecommunication
- 8.2.5. Automotive
- 8.2.6. Other End-user Industries
- 8.1. Market Analysis, Insights and Forecast - by Type
- 9. Europe Quartz Crystal Industry Analysis, Insights and Forecast, 2020-2032
- 9.1. Market Analysis, Insights and Forecast - by Type
- 9.1.1. High-purity Quartz
- 9.1.1.1. Quartz Surface and Tile
- 9.1.1.2. Fused Quartz Crucible
- 9.1.1.3. Quartz Glass
- 9.1.2. Quartz Crystal
- 9.1.3. Silicon Metal
- 9.1.1. High-purity Quartz
- 9.2. Market Analysis, Insights and Forecast - by End-user Industry
- 9.2.1. Electronics and Semiconductor
- 9.2.2. Solar
- 9.2.3. Buildings and Construction
- 9.2.4. Optical fiber and Telecommunication
- 9.2.5. Automotive
- 9.2.6. Other End-user Industries
- 9.1. Market Analysis, Insights and Forecast - by Type
- 10. South America Quartz Crystal Industry Analysis, Insights and Forecast, 2020-2032
- 10.1. Market Analysis, Insights and Forecast - by Type
- 10.1.1. High-purity Quartz
- 10.1.1.1. Quartz Surface and Tile
- 10.1.1.2. Fused Quartz Crucible
- 10.1.1.3. Quartz Glass
- 10.1.2. Quartz Crystal
- 10.1.3. Silicon Metal
- 10.1.1. High-purity Quartz
- 10.2. Market Analysis, Insights and Forecast - by End-user Industry
- 10.2.1. Electronics and Semiconductor
- 10.2.2. Solar
- 10.2.3. Buildings and Construction
- 10.2.4. Optical fiber and Telecommunication
- 10.2.5. Automotive
- 10.2.6. Other End-user Industries
- 10.1. Market Analysis, Insights and Forecast - by Type
- 11. Middle East Quartz Crystal Industry Analysis, Insights and Forecast, 2020-2032
- 11.1. Market Analysis, Insights and Forecast - by Type
- 11.1.1. High-purity Quartz
- 11.1.1.1. Quartz Surface and Tile
- 11.1.1.2. Fused Quartz Crucible
- 11.1.1.3. Quartz Glass
- 11.1.2. Quartz Crystal
- 11.1.3. Silicon Metal
- 11.1.1. High-purity Quartz
- 11.2. Market Analysis, Insights and Forecast - by End-user Industry
- 11.2.1. Electronics and Semiconductor
- 11.2.2. Solar
- 11.2.3. Buildings and Construction
- 11.2.4. Optical fiber and Telecommunication
- 11.2.5. Automotive
- 11.2.6. Other End-user Industries
- 11.1. Market Analysis, Insights and Forecast - by Type
- 12. Saudi Arabia Quartz Crystal Industry Analysis, Insights and Forecast, 2020-2032
- 12.1. Market Analysis, Insights and Forecast - by Type
- 12.1.1. High-purity Quartz
- 12.1.1.1. Quartz Surface and Tile
- 12.1.1.2. Fused Quartz Crucible
- 12.1.1.3. Quartz Glass
- 12.1.2. Quartz Crystal
- 12.1.3. Silicon Metal
- 12.1.1. High-purity Quartz
- 12.2. Market Analysis, Insights and Forecast - by End-user Industry
- 12.2.1. Electronics and Semiconductor
- 12.2.2. Solar
- 12.2.3. Buildings and Construction
- 12.2.4. Optical fiber and Telecommunication
- 12.2.5. Automotive
- 12.2.6. Other End-user Industries
- 12.1. Market Analysis, Insights and Forecast - by Type
- 13. Competitive Analysis
- 13.1. Company Profiles
- 13.1.1 Heraeus Holding
- 13.1.1.1. Company Overview
- 13.1.1.2. Products
- 13.1.1.3. Company Financials
- 13.1.1.4. SWOT Analysis
- 13.1.2 Jiangsu Pacific Quartz Co Ltd
- 13.1.2.1. Company Overview
- 13.1.2.2. Products
- 13.1.2.3. Company Financials
- 13.1.2.4. SWOT Analysis
- 13.1.3 Saint-Gobain
- 13.1.3.1. Company Overview
- 13.1.3.2. Products
- 13.1.3.3. Company Financials
- 13.1.3.4. SWOT Analysis
- 13.1.4 Ferroglobe
- 13.1.4.1. Company Overview
- 13.1.4.2. Products
- 13.1.4.3. Company Financials
- 13.1.4.4. SWOT Analysis
- 13.1.5 Elkem ASA
- 13.1.5.1. Company Overview
- 13.1.5.2. Products
- 13.1.5.3. Company Financials
- 13.1.5.4. SWOT Analysis
- 13.1.6 Wonic QnC Corporation
- 13.1.6.1. Company Overview
- 13.1.6.2. Products
- 13.1.6.3. Company Financials
- 13.1.6.4. SWOT Analysis
- 13.1.7 The Quartz Corporation*List Not Exhaustive
- 13.1.7.1. Company Overview
- 13.1.7.2. Products
- 13.1.7.3. Company Financials
- 13.1.7.4. SWOT Analysis
- 13.1.8 Nihon Dempa Kogyo Co Ltd
- 13.1.8.1. Company Overview
- 13.1.8.2. Products
- 13.1.8.3. Company Financials
- 13.1.8.4. SWOT Analysis
- 13.1.9 Sibelco
- 13.1.9.1. Company Overview
- 13.1.9.2. Products
- 13.1.9.3. Company Financials
- 13.1.9.4. SWOT Analysis
- 13.1.10 Nordic Mining ASA
- 13.1.10.1. Company Overview
- 13.1.10.2. Products
- 13.1.10.3. Company Financials
- 13.1.10.4. SWOT Analysis
- 13.1.11 SUMCO Corporation
- 13.1.11.1. Company Overview
- 13.1.11.2. Products
- 13.1.11.3. Company Financials
- 13.1.11.4. SWOT Analysis
- 13.1.12 Dow
- 13.1.12.1. Company Overview
- 13.1.12.2. Products
- 13.1.12.3. Company Financials
- 13.1.12.4. SWOT Analysis
- 13.1.13 RUSNANO Group
- 13.1.13.1. Company Overview
- 13.1.13.2. Products
- 13.1.13.3. Company Financials
- 13.1.13.4. SWOT Analysis
- 13.1.14 AGC Inc
- 13.1.14.1. Company Overview
- 13.1.14.2. Products
- 13.1.14.3. Company Financials
- 13.1.14.4. SWOT Analysis
- 13.1.15 Beijing Kai de Quartz Co Ltd
- 13.1.15.1. Company Overview
- 13.1.15.2. Products
- 13.1.15.3. Company Financials
- 13.1.15.4. SWOT Analysis
- 13.1.1 Heraeus Holding
- 13.2. Market Entropy
- 13.2.1 Company's Key Areas Served
- 13.2.2 Recent Developments
- 13.3. Company Market Share Analysis 2025
- 13.3.1 Top 5 Companies Market Share Analysis
- 13.3.2 Top 3 Companies Market Share Analysis
- 13.4. List of Potential Customers
- 14. Research Methodology
List of Figures
- Figure 1: Global Quartz Crystal Industry Revenue Breakdown (Million, %) by Region 2025 & 2033
- Figure 2: Asia Pacific Quartz Crystal Industry Revenue (Million), by Type 2025 & 2033
- Figure 3: Asia Pacific Quartz Crystal Industry Revenue Share (%), by Type 2025 & 2033
- Figure 4: Asia Pacific Quartz Crystal Industry Revenue (Million), by End-user Industry 2025 & 2033
- Figure 5: Asia Pacific Quartz Crystal Industry Revenue Share (%), by End-user Industry 2025 & 2033
- Figure 6: Asia Pacific Quartz Crystal Industry Revenue (Million), by Country 2025 & 2033
- Figure 7: Asia Pacific Quartz Crystal Industry Revenue Share (%), by Country 2025 & 2033
- Figure 8: North America Quartz Crystal Industry Revenue (Million), by Type 2025 & 2033
- Figure 9: North America Quartz Crystal Industry Revenue Share (%), by Type 2025 & 2033
- Figure 10: North America Quartz Crystal Industry Revenue (Million), by End-user Industry 2025 & 2033
- Figure 11: North America Quartz Crystal Industry Revenue Share (%), by End-user Industry 2025 & 2033
- Figure 12: North America Quartz Crystal Industry Revenue (Million), by Country 2025 & 2033
- Figure 13: North America Quartz Crystal Industry Revenue Share (%), by Country 2025 & 2033
- Figure 14: Europe Quartz Crystal Industry Revenue (Million), by Type 2025 & 2033
- Figure 15: Europe Quartz Crystal Industry Revenue Share (%), by Type 2025 & 2033
- Figure 16: Europe Quartz Crystal Industry Revenue (Million), by End-user Industry 2025 & 2033
- Figure 17: Europe Quartz Crystal Industry Revenue Share (%), by End-user Industry 2025 & 2033
- Figure 18: Europe Quartz Crystal Industry Revenue (Million), by Country 2025 & 2033
- Figure 19: Europe Quartz Crystal Industry Revenue Share (%), by Country 2025 & 2033
- Figure 20: South America Quartz Crystal Industry Revenue (Million), by Type 2025 & 2033
- Figure 21: South America Quartz Crystal Industry Revenue Share (%), by Type 2025 & 2033
- Figure 22: South America Quartz Crystal Industry Revenue (Million), by End-user Industry 2025 & 2033
- Figure 23: South America Quartz Crystal Industry Revenue Share (%), by End-user Industry 2025 & 2033
- Figure 24: South America Quartz Crystal Industry Revenue (Million), by Country 2025 & 2033
- Figure 25: South America Quartz Crystal Industry Revenue Share (%), by Country 2025 & 2033
- Figure 26: Middle East Quartz Crystal Industry Revenue (Million), by Type 2025 & 2033
- Figure 27: Middle East Quartz Crystal Industry Revenue Share (%), by Type 2025 & 2033
- Figure 28: Middle East Quartz Crystal Industry Revenue (Million), by End-user Industry 2025 & 2033
- Figure 29: Middle East Quartz Crystal Industry Revenue Share (%), by End-user Industry 2025 & 2033
- Figure 30: Middle East Quartz Crystal Industry Revenue (Million), by Country 2025 & 2033
- Figure 31: Middle East Quartz Crystal Industry Revenue Share (%), by Country 2025 & 2033
- Figure 32: Saudi Arabia Quartz Crystal Industry Revenue (Million), by Type 2025 & 2033
- Figure 33: Saudi Arabia Quartz Crystal Industry Revenue Share (%), by Type 2025 & 2033
- Figure 34: Saudi Arabia Quartz Crystal Industry Revenue (Million), by End-user Industry 2025 & 2033
- Figure 35: Saudi Arabia Quartz Crystal Industry Revenue Share (%), by End-user Industry 2025 & 2033
- Figure 36: Saudi Arabia Quartz Crystal Industry Revenue (Million), by Country 2025 & 2033
- Figure 37: Saudi Arabia Quartz Crystal Industry Revenue Share (%), by Country 2025 & 2033
List of Tables
- Table 1: Global Quartz Crystal Industry Revenue Million Forecast, by Type 2020 & 2033
- Table 2: Global Quartz Crystal Industry Revenue Million Forecast, by End-user Industry 2020 & 2033
- Table 3: Global Quartz Crystal Industry Revenue Million Forecast, by Region 2020 & 2033
- Table 4: Global Quartz Crystal Industry Revenue Million Forecast, by Type 2020 & 2033
- Table 5: Global Quartz Crystal Industry Revenue Million Forecast, by End-user Industry 2020 & 2033
- Table 6: Global Quartz Crystal Industry Revenue Million Forecast, by Country 2020 & 2033
- Table 7: China Quartz Crystal Industry Revenue (Million) Forecast, by Application 2020 & 2033
- Table 8: India Quartz Crystal Industry Revenue (Million) Forecast, by Application 2020 & 2033
- Table 9: Japan Quartz Crystal Industry Revenue (Million) Forecast, by Application 2020 & 2033
- Table 10: South Korea Quartz Crystal Industry Revenue (Million) Forecast, by Application 2020 & 2033
- Table 11: Rest of Asia Pacific Quartz Crystal Industry Revenue (Million) Forecast, by Application 2020 & 2033
- Table 12: Global Quartz Crystal Industry Revenue Million Forecast, by Type 2020 & 2033
- Table 13: Global Quartz Crystal Industry Revenue Million Forecast, by End-user Industry 2020 & 2033
- Table 14: Global Quartz Crystal Industry Revenue Million Forecast, by Country 2020 & 2033
- Table 15: United States Quartz Crystal Industry Revenue (Million) Forecast, by Application 2020 & 2033
- Table 16: Canada Quartz Crystal Industry Revenue (Million) Forecast, by Application 2020 & 2033
- Table 17: Mexico Quartz Crystal Industry Revenue (Million) Forecast, by Application 2020 & 2033
- Table 18: Global Quartz Crystal Industry Revenue Million Forecast, by Type 2020 & 2033
- Table 19: Global Quartz Crystal Industry Revenue Million Forecast, by End-user Industry 2020 & 2033
- Table 20: Global Quartz Crystal Industry Revenue Million Forecast, by Country 2020 & 2033
- Table 21: Germany Quartz Crystal Industry Revenue (Million) Forecast, by Application 2020 & 2033
- Table 22: United Kingdom Quartz Crystal Industry Revenue (Million) Forecast, by Application 2020 & 2033
- Table 23: Italy Quartz Crystal Industry Revenue (Million) Forecast, by Application 2020 & 2033
- Table 24: France Quartz Crystal Industry Revenue (Million) Forecast, by Application 2020 & 2033
- Table 25: Russia Quartz Crystal Industry Revenue (Million) Forecast, by Application 2020 & 2033
- Table 26: Rest of Europe Quartz Crystal Industry Revenue (Million) Forecast, by Application 2020 & 2033
- Table 27: Global Quartz Crystal Industry Revenue Million Forecast, by Type 2020 & 2033
- Table 28: Global Quartz Crystal Industry Revenue Million Forecast, by End-user Industry 2020 & 2033
- Table 29: Global Quartz Crystal Industry Revenue Million Forecast, by Country 2020 & 2033
- Table 30: Brazil Quartz Crystal Industry Revenue (Million) Forecast, by Application 2020 & 2033
- Table 31: Argentina Quartz Crystal Industry Revenue (Million) Forecast, by Application 2020 & 2033
- Table 32: Rest of South America Quartz Crystal Industry Revenue (Million) Forecast, by Application 2020 & 2033
- Table 33: Global Quartz Crystal Industry Revenue Million Forecast, by Type 2020 & 2033
- Table 34: Global Quartz Crystal Industry Revenue Million Forecast, by End-user Industry 2020 & 2033
- Table 35: Global Quartz Crystal Industry Revenue Million Forecast, by Country 2020 & 2033
- Table 36: Global Quartz Crystal Industry Revenue Million Forecast, by Type 2020 & 2033
- Table 37: Global Quartz Crystal Industry Revenue Million Forecast, by End-user Industry 2020 & 2033
- Table 38: Global Quartz Crystal Industry Revenue Million Forecast, by Country 2020 & 2033
- Table 39: South Africa Quartz Crystal Industry Revenue (Million) Forecast, by Application 2020 & 2033
- Table 40: Rest of Middle East Quartz Crystal Industry Revenue (Million) Forecast, by Application 2020 & 2033
Frequently Asked Questions
1. What is the projected Compound Annual Growth Rate (CAGR) of the Quartz Crystal Industry?
The projected CAGR is approximately 4.19%.
2. Which companies are prominent players in the Quartz Crystal Industry?
Key companies in the market include Heraeus Holding, Jiangsu Pacific Quartz Co Ltd, Saint-Gobain, Ferroglobe, Elkem ASA, Wonic QnC Corporation, The Quartz Corporation*List Not Exhaustive, Nihon Dempa Kogyo Co Ltd, Sibelco, Nordic Mining ASA, SUMCO Corporation, Dow, RUSNANO Group, AGC Inc, Beijing Kai de Quartz Co Ltd.
3. What are the main segments of the Quartz Crystal Industry?
The market segments include Type, End-user Industry.
4. Can you provide details about the market size?
The market size is estimated to be USD 7.31 Million as of 2022.
5. What are some drivers contributing to market growth?
Growing Solar Industry; Demand for High-purity Quartz in the Semiconductor Industry.
6. What are the notable trends driving market growth?
Rising Demand from the Electronics and Semiconductor Industry.
7. Are there any restraints impacting market growth?
Ecological Impact of Quartz Mining; Discoloration in Quartz Tiles and Slabs.
8. Can you provide examples of recent developments in the market?
December 2022: Sibelco acquired Bassanetti Group of Italy, which is a local player in the extraction, processing, and marketing of sand products in Southern Europe. This move will strengthen the company's positioning in Southern Europe.
9. What pricing options are available for accessing the report?
Pricing options include single-user, multi-user, and enterprise licenses priced at USD 4750, USD 5250, and USD 8750 respectively.
10. Is the market size provided in terms of value or volume?
The market size is provided in terms of value, measured in Million.
11. Are there any specific market keywords associated with the report?
Yes, the market keyword associated with the report is "Quartz Crystal Industry," which aids in identifying and referencing the specific market segment covered.
12. How do I determine which pricing option suits my needs best?
The pricing options vary based on user requirements and access needs. Individual users may opt for single-user licenses, while businesses requiring broader access may choose multi-user or enterprise licenses for cost-effective access to the report.
13. Are there any additional resources or data provided in the Quartz Crystal Industry report?
While the report offers comprehensive insights, it's advisable to review the specific contents or supplementary materials provided to ascertain if additional resources or data are available.
14. How can I stay updated on further developments or reports in the Quartz Crystal Industry?
To stay informed about further developments, trends, and reports in the Quartz Crystal Industry, consider subscribing to industry newsletters, following relevant companies and organizations, or regularly checking reputable industry news sources and publications.
Methodology
Step 1 - Identification of Relevant Samples Size from Population Database


Step 2 - Approaches for Defining Global Market Size (Value, Volume* & Price*)

Note*: In applicable scenarios
Step 3 - Data Sources
Primary Research
- Web Analytics
- Survey Reports
- Research Institute
- Latest Research Reports
- Opinion Leaders
Secondary Research
- Annual Reports
- White Paper
- Latest Press Release
- Industry Association
- Paid Database
- Investor Presentations

Step 4 - Data Triangulation
Involves using different sources of information in order to increase the validity of a study
These sources are likely to be stakeholders in a program - participants, other researchers, program staff, other community members, and so on.
Then we put all data in single framework & apply various statistical tools to find out the dynamic on the market.
During the analysis stage, feedback from the stakeholder groups would be compared to determine areas of agreement as well as areas of divergence