

Key Insights
The global pure gas industry, encompassing high-purity atmospheric, noble, and carbon gases, is poised for significant expansion. Projections indicate a Compound Annual Growth Rate (CAGR) of 4.4% from 2025 to 2033, with the market expected to reach $119.11 billion by the base year. This growth is propelled by escalating demand from key sectors including electronics, metal production, healthcare (for advanced treatments like laser surgery and cryogenics), and the expanding energy sector, particularly renewables. The food and beverage industry also contributes substantially through its use of pure gases for packaging and preservation. While supply chain volatility and raw material price fluctuations present challenges, ongoing technological advancements in gas purification and delivery systems are expected to mitigate these risks.
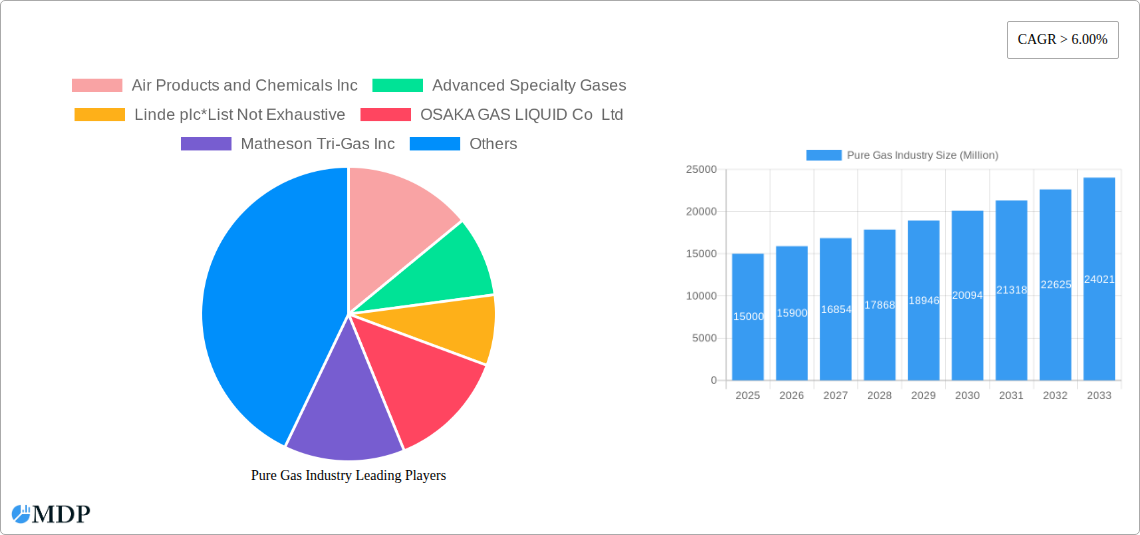
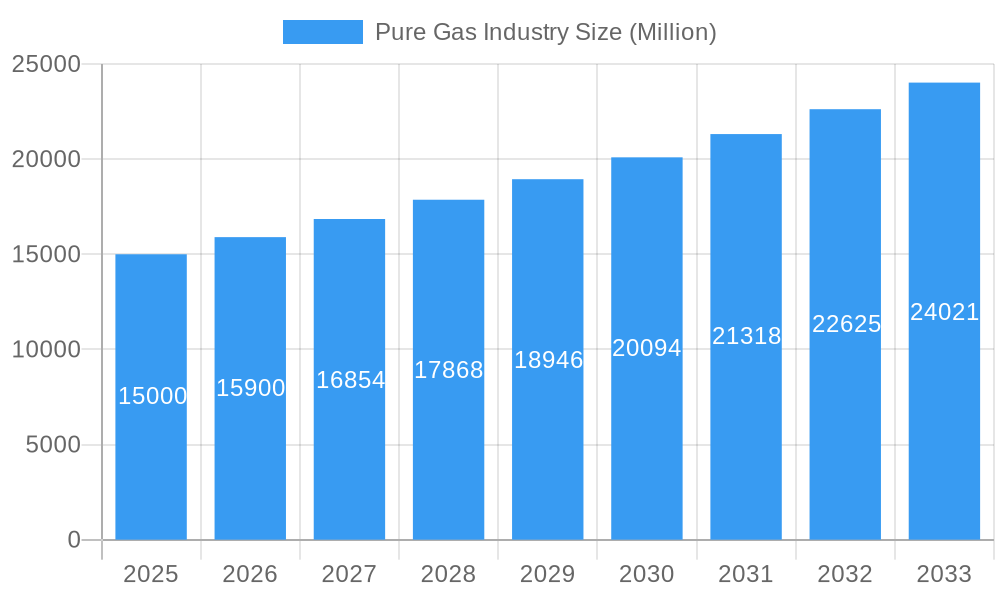
Pure Gas Industry Market Size (In Billion)
Market analysis reveals robust opportunities across product types and applications. High-purity atmospheric gases dominate the market share due to their widespread industrial utility. Noble gases represent a lucrative segment owing to their specialized applications in lighting and other advanced technologies. Geographically, the Asia-Pacific region, led by China and India, is anticipated to experience the most rapid expansion, driven by accelerated industrialization and manufacturing growth. Mature markets in North America and Europe are projected to maintain steady growth, supported by technological innovation and specialized sector demand. The competitive landscape features prominent players such as Air Products and Chemicals Inc., Linde plc, and Air Liquide, alongside numerous regional and specialized firms, fostering continuous innovation and ensuring a reliable supply of high-quality pure gases worldwide.
Pure Gas Industry Company Market Share
Pure Gas Industry Market Report: 2019-2033 Forecast
Uncover lucrative opportunities and navigate challenges in the dynamic Pure Gas market with this comprehensive report. This in-depth analysis provides a 360° view of the Pure Gas industry, encompassing market size, segmentation, competitive landscape, and future growth projections. The report covers the period 2019-2033, with a focus on the 2025-2033 forecast period. Benefit from actionable insights derived from meticulous data analysis and expert interpretation. This report is ideal for industry stakeholders, investors, and strategic decision-makers seeking a competitive edge in this rapidly evolving sector.
Pure Gas Industry Market Dynamics & Concentration
This section analyzes the market concentration, innovation drivers, regulatory landscapes, product substitutes, end-user trends, and merger & acquisition (M&A) activities within the Pure Gas industry. The global Pure Gas market reached a value of $xx Million in 2024 and is projected to reach $xx Million by 2033, exhibiting a CAGR of xx% during the forecast period (2025-2033).
Market Concentration: The Pure Gas market exhibits a moderately concentrated structure, with key players like Air Products and Chemicals Inc, Linde plc, and Air Liquide holding significant market shares. However, the presence of numerous regional and specialized players contributes to competitive dynamism. The top 5 players collectively hold an estimated xx% market share in 2025.
Innovation Drivers: Technological advancements in gas purification, cryogenic separation, and delivery systems are key innovation drivers. Emphasis on energy efficiency and sustainability is also fueling innovation.
Regulatory Frameworks: Stringent safety and environmental regulations governing the production, handling, and transportation of Pure Gases significantly influence market dynamics. Compliance costs and evolving regulations represent both challenges and opportunities for innovation.
Product Substitutes: While few direct substitutes exist for specific Pure Gas applications, the availability of alternative technologies in some niche segments creates competitive pressures.
End-User Trends: Growth in key end-user industries, such as electronics, healthcare, and energy, is driving demand for Pure Gases. Changing consumer preferences regarding sustainable and eco-friendly products are influencing the market.
M&A Activities: The Pure Gas industry has witnessed a significant number of M&A transactions (xx deals) in the historical period (2019-2024), driven by strategies for market consolidation and expansion into new geographical regions and product segments.
Pure Gas Industry Industry Trends & Analysis
This section delves into the key market growth drivers, technological disruptions, consumer preferences, and competitive dynamics shaping the Pure Gas industry. The market is experiencing robust growth, driven by increasing demand from various sectors.
The increasing demand for high-purity gases in various applications, such as electronics manufacturing, medical research, and industrial processes, is a key driver. Technological advancements, such as improved purification techniques and efficient delivery systems, are enhancing the quality and accessibility of Pure Gases. Consumer preference for high-quality, reliable, and sustainable gas solutions influences product development and market positioning. Intense competition among established players and emerging companies fosters innovation and drives pricing strategies. The market penetration of Pure Gases in various end-user industries is also experiencing a steady increase, reflecting their importance across sectors. The global market value is projected to grow at a CAGR of xx% from 2025 to 2033. Factors such as stricter environmental regulations and the rising demand for energy-efficient technologies will continue to drive market growth.
Leading Markets & Segments in Pure Gas Industry
This section identifies the leading regions, countries, and segments within the Pure Gas industry. Analysis considers Product Type (High-Purity Atmospheric Gases, Noble Gases, Carbon Gases, Other Product Types), Application (Insulation, Lighting, Coolant, Other Applications), and End-user Industry (Electronics, Metal Production, Chemicals, Energy and Power, Medical and Healthcare, Food and Beverages, Other End-user Industries).
Dominant Regions/Countries: [Insert Dominant Region/Country Analysis – approx. 200 words. Mention specific factors driving dominance, such as economic development, industrial growth, government support, or infrastructure.]
Dominant Product Types: High-purity atmospheric gases currently dominate the market, owing to their widespread use in various applications. The demand for noble gases is also experiencing strong growth, driven by their unique properties and specialized applications.
Key Drivers for High-Purity Atmospheric Gases: Widespread industrial applications, cost-effectiveness, and readily available supply.
Key Drivers for Noble Gases: Increasing demand from electronics and medical industries due to their unique properties (e.g., inertness, low reactivity).
Key Drivers for Carbon Gases: Use in various industrial processes and increasing demand from the chemical industry.
Dominant End-user Industries: The electronics and metal production industries are major consumers of Pure Gases, reflecting their critical role in manufacturing processes. The healthcare and energy sectors also represent significant and growing market segments.
Key Drivers for Electronics: Precise gas requirements for semiconductor manufacturing and other high-tech applications.
Key Drivers for Metal Production: Use in various metallurgical processes, such as welding and heat treatment.
Key Drivers for Healthcare: Use in medical equipment, diagnostics, and therapy.
Pure Gas Industry Product Developments
Recent product innovations focus on enhancing purity levels, improving delivery systems, and developing specialized gas mixtures tailored to specific end-user applications. Technological advancements in gas purification and separation techniques are driving the development of higher-purity gases with improved performance characteristics. These developments cater to the increasing demand for high-quality gases in diverse industries. Companies are investing in developing innovative applications for Pure Gases, leading to increased market penetration.
Key Drivers of Pure Gas Industry Growth
The Pure Gas industry's growth is driven by several factors, including technological advancements leading to improved gas purity and efficiency, robust economic growth in key end-user industries, and supportive government policies and regulations promoting industrial development and technological innovation. Increased investment in research and development is also contributing to the expansion of this market segment.
Challenges in the Pure Gas Industry Market
Challenges include stringent safety and environmental regulations, potential supply chain disruptions affecting raw material availability and transportation costs, and intense competition among established players and new entrants. These factors can influence pricing strategies and profitability in the market.
Emerging Opportunities in Pure Gas Industry
Emerging opportunities lie in the development of new applications for Pure Gases in emerging industries, strategic partnerships and collaborations to expand market reach, and investments in research and development to improve gas purity and delivery systems. Expanding into new geographical markets also presents significant growth opportunities.
Leading Players in the Pure Gas Industry Sector
- Air Products and Chemicals Inc
- Advanced Specialty Gases
- Linde plc
- OSAKA GAS LIQUID Co Ltd
- Matheson Tri-Gas Inc
- Iwatani Corporation
- American Welding & Gas
- Messer Group
- Air Liquide
- Airgas Inc
Key Milestones in Pure Gas Industry Industry
- 2020: Linde plc and Praxair complete their merger, creating a global leader in the industrial gases sector. [Insert further key milestones with dates and impact description]
Strategic Outlook for Pure Gas Industry Market
The Pure Gas industry presents a significant long-term growth potential, driven by technological innovation, expanding applications across diverse sectors, and supportive government policies. Strategic opportunities include focusing on developing sustainable and energy-efficient gas solutions, expanding into high-growth markets, and forging strategic partnerships to enhance market penetration and reach.
Pure Gas Industry Segmentation
-
1. Product Type
- 1.1. High-Purity Atmospheric Gases
- 1.2. Noble Gases
- 1.3. Carbon Gases
- 1.4. Other Product Types
-
2. Application
- 2.1. Insulation
- 2.2. Lighting
- 2.3. Coolant
- 2.4. Other Applications
-
3. End-user Industry
- 3.1. Electronics
- 3.2. Metal Production
- 3.3. Chemicals
- 3.4. Energy and Power
- 3.5. Medical and Healthcare
- 3.6. Food and Beverages
- 3.7. Other End-user Industries
Pure Gas Industry Segmentation By Geography
-
1. Asia Pacific
- 1.1. China
- 1.2. India
- 1.3. Japan
- 1.4. South Korea
- 1.5. ASEAN Countries
- 1.6. Rest of Asia Pacific
-
2. North America
- 2.1. United States
- 2.2. Canada
- 2.3. Mexico
-
3. Europe
- 3.1. Germany
- 3.2. United Kingdom
- 3.3. Italy
- 3.4. France
- 3.5. Rest of Europe
-
4. South America
- 4.1. Brazil
- 4.2. Argentina
- 4.3. Rest of South America
-
5. Middle East and Africa
- 5.1. Saudi Arabia
- 5.2. South Africa
- 5.3. Rest of Middle East and Africa
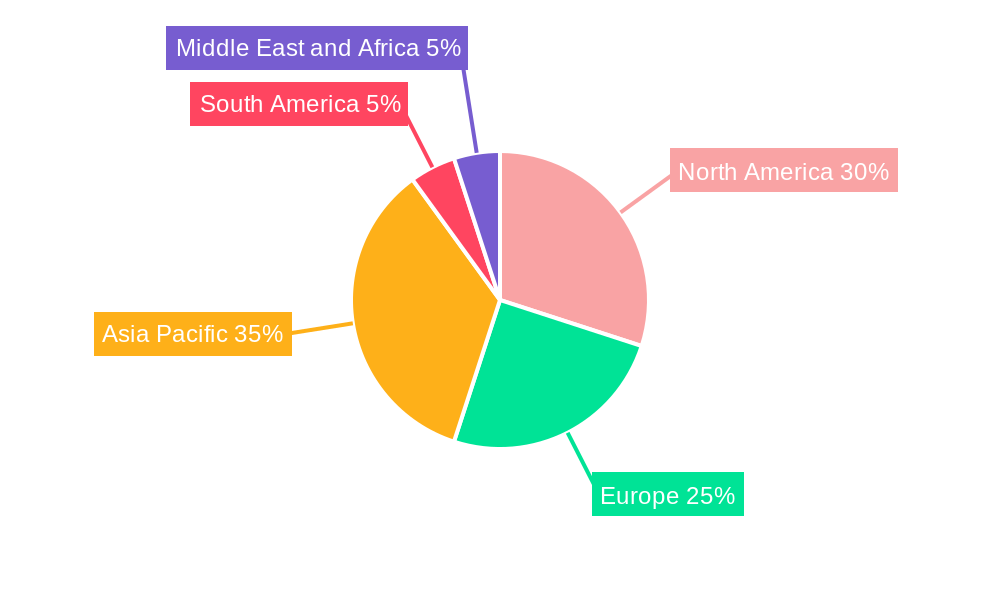
Pure Gas Industry Regional Market Share
Geographic Coverage of Pure Gas Industry
Pure Gas Industry REPORT HIGHLIGHTS
| Aspects | Details |
|---|---|
| Study Period | 2020-2034 |
| Base Year | 2025 |
| Estimated Year | 2026 |
| Forecast Period | 2026-2034 |
| Historical Period | 2020-2025 |
| Growth Rate | CAGR of 4.4% from 2020-2034 |
| Segmentation |
|
Table of Contents
- 1. Introduction
- 1.1. Research Scope
- 1.2. Market Segmentation
- 1.3. Research Objective
- 1.4. Definitions and Assumptions
- 2. Executive Summary
- 2.1. Market Snapshot
- 3. Market Dynamics
- 3.1. Market Drivers
- 3.2. Market Restrains
- 3.3. Market Trends
- 3.4. Market Opportunities
- 4. Market Factor Analysis
- 4.1. Porters Five Forces
- 4.1.1. Bargaining Power of Suppliers
- 4.1.2. Bargaining Power of Buyers
- 4.1.3. Threat of New Entrants
- 4.1.4. Threat of Substitutes
- 4.1.5. Competitive Rivalry
- 4.2. PESTEL analysis
- 4.3. BCG Analysis
- 4.3.1. Stars (High Growth, High Market Share)
- 4.3.2. Cash Cows (Low Growth, High Market Share)
- 4.3.3. Question Mark (High Growth, Low Market Share)
- 4.3.4. Dogs (Low Growth, Low Market Share)
- 4.4. Ansoff Matrix Analysis
- 4.5. Supply Chain Analysis
- 4.6. Regulatory Landscape
- 4.7. Current Market Potential and Opportunity Assessment (TAM–SAM–SOM Framework)
- 4.8. MDP Analyst Note
- 4.1. Porters Five Forces
- 5. Market Analysis, Insights and Forecast 2021-2033
- 5.1. Market Analysis, Insights and Forecast - by Product Type
- 5.1.1. High-Purity Atmospheric Gases
- 5.1.2. Noble Gases
- 5.1.3. Carbon Gases
- 5.1.4. Other Product Types
- 5.2. Market Analysis, Insights and Forecast - by Application
- 5.2.1. Insulation
- 5.2.2. Lighting
- 5.2.3. Coolant
- 5.2.4. Other Applications
- 5.3. Market Analysis, Insights and Forecast - by End-user Industry
- 5.3.1. Electronics
- 5.3.2. Metal Production
- 5.3.3. Chemicals
- 5.3.4. Energy and Power
- 5.3.5. Medical and Healthcare
- 5.3.6. Food and Beverages
- 5.3.7. Other End-user Industries
- 5.4. Market Analysis, Insights and Forecast - by Region
- 5.4.1. Asia Pacific
- 5.4.2. North America
- 5.4.3. Europe
- 5.4.4. South America
- 5.4.5. Middle East and Africa
- 5.1. Market Analysis, Insights and Forecast - by Product Type
- 6. Global Pure Gas Industry Analysis, Insights and Forecast, 2021-2033
- 6.1. Market Analysis, Insights and Forecast - by Product Type
- 6.1.1. High-Purity Atmospheric Gases
- 6.1.2. Noble Gases
- 6.1.3. Carbon Gases
- 6.1.4. Other Product Types
- 6.2. Market Analysis, Insights and Forecast - by Application
- 6.2.1. Insulation
- 6.2.2. Lighting
- 6.2.3. Coolant
- 6.2.4. Other Applications
- 6.3. Market Analysis, Insights and Forecast - by End-user Industry
- 6.3.1. Electronics
- 6.3.2. Metal Production
- 6.3.3. Chemicals
- 6.3.4. Energy and Power
- 6.3.5. Medical and Healthcare
- 6.3.6. Food and Beverages
- 6.3.7. Other End-user Industries
- 6.1. Market Analysis, Insights and Forecast - by Product Type
- 7. Asia Pacific Pure Gas Industry Analysis, Insights and Forecast, 2020-2032
- 7.1. Market Analysis, Insights and Forecast - by Product Type
- 7.1.1. High-Purity Atmospheric Gases
- 7.1.2. Noble Gases
- 7.1.3. Carbon Gases
- 7.1.4. Other Product Types
- 7.2. Market Analysis, Insights and Forecast - by Application
- 7.2.1. Insulation
- 7.2.2. Lighting
- 7.2.3. Coolant
- 7.2.4. Other Applications
- 7.3. Market Analysis, Insights and Forecast - by End-user Industry
- 7.3.1. Electronics
- 7.3.2. Metal Production
- 7.3.3. Chemicals
- 7.3.4. Energy and Power
- 7.3.5. Medical and Healthcare
- 7.3.6. Food and Beverages
- 7.3.7. Other End-user Industries
- 7.1. Market Analysis, Insights and Forecast - by Product Type
- 8. North America Pure Gas Industry Analysis, Insights and Forecast, 2020-2032
- 8.1. Market Analysis, Insights and Forecast - by Product Type
- 8.1.1. High-Purity Atmospheric Gases
- 8.1.2. Noble Gases
- 8.1.3. Carbon Gases
- 8.1.4. Other Product Types
- 8.2. Market Analysis, Insights and Forecast - by Application
- 8.2.1. Insulation
- 8.2.2. Lighting
- 8.2.3. Coolant
- 8.2.4. Other Applications
- 8.3. Market Analysis, Insights and Forecast - by End-user Industry
- 8.3.1. Electronics
- 8.3.2. Metal Production
- 8.3.3. Chemicals
- 8.3.4. Energy and Power
- 8.3.5. Medical and Healthcare
- 8.3.6. Food and Beverages
- 8.3.7. Other End-user Industries
- 8.1. Market Analysis, Insights and Forecast - by Product Type
- 9. Europe Pure Gas Industry Analysis, Insights and Forecast, 2020-2032
- 9.1. Market Analysis, Insights and Forecast - by Product Type
- 9.1.1. High-Purity Atmospheric Gases
- 9.1.2. Noble Gases
- 9.1.3. Carbon Gases
- 9.1.4. Other Product Types
- 9.2. Market Analysis, Insights and Forecast - by Application
- 9.2.1. Insulation
- 9.2.2. Lighting
- 9.2.3. Coolant
- 9.2.4. Other Applications
- 9.3. Market Analysis, Insights and Forecast - by End-user Industry
- 9.3.1. Electronics
- 9.3.2. Metal Production
- 9.3.3. Chemicals
- 9.3.4. Energy and Power
- 9.3.5. Medical and Healthcare
- 9.3.6. Food and Beverages
- 9.3.7. Other End-user Industries
- 9.1. Market Analysis, Insights and Forecast - by Product Type
- 10. South America Pure Gas Industry Analysis, Insights and Forecast, 2020-2032
- 10.1. Market Analysis, Insights and Forecast - by Product Type
- 10.1.1. High-Purity Atmospheric Gases
- 10.1.2. Noble Gases
- 10.1.3. Carbon Gases
- 10.1.4. Other Product Types
- 10.2. Market Analysis, Insights and Forecast - by Application
- 10.2.1. Insulation
- 10.2.2. Lighting
- 10.2.3. Coolant
- 10.2.4. Other Applications
- 10.3. Market Analysis, Insights and Forecast - by End-user Industry
- 10.3.1. Electronics
- 10.3.2. Metal Production
- 10.3.3. Chemicals
- 10.3.4. Energy and Power
- 10.3.5. Medical and Healthcare
- 10.3.6. Food and Beverages
- 10.3.7. Other End-user Industries
- 10.1. Market Analysis, Insights and Forecast - by Product Type
- 11. Middle East and Africa Pure Gas Industry Analysis, Insights and Forecast, 2020-2032
- 11.1. Market Analysis, Insights and Forecast - by Product Type
- 11.1.1. High-Purity Atmospheric Gases
- 11.1.2. Noble Gases
- 11.1.3. Carbon Gases
- 11.1.4. Other Product Types
- 11.2. Market Analysis, Insights and Forecast - by Application
- 11.2.1. Insulation
- 11.2.2. Lighting
- 11.2.3. Coolant
- 11.2.4. Other Applications
- 11.3. Market Analysis, Insights and Forecast - by End-user Industry
- 11.3.1. Electronics
- 11.3.2. Metal Production
- 11.3.3. Chemicals
- 11.3.4. Energy and Power
- 11.3.5. Medical and Healthcare
- 11.3.6. Food and Beverages
- 11.3.7. Other End-user Industries
- 11.1. Market Analysis, Insights and Forecast - by Product Type
- 12. Competitive Analysis
- 12.1. Company Profiles
- 12.1.1 Air Products and Chemicals Inc
- 12.1.1.1. Company Overview
- 12.1.1.2. Products
- 12.1.1.3. Company Financials
- 12.1.1.4. SWOT Analysis
- 12.1.2 Advanced Specialty Gases
- 12.1.2.1. Company Overview
- 12.1.2.2. Products
- 12.1.2.3. Company Financials
- 12.1.2.4. SWOT Analysis
- 12.1.3 Linde plc*List Not Exhaustive
- 12.1.3.1. Company Overview
- 12.1.3.2. Products
- 12.1.3.3. Company Financials
- 12.1.3.4. SWOT Analysis
- 12.1.4 OSAKA GAS LIQUID Co Ltd
- 12.1.4.1. Company Overview
- 12.1.4.2. Products
- 12.1.4.3. Company Financials
- 12.1.4.4. SWOT Analysis
- 12.1.5 Matheson Tri-Gas Inc
- 12.1.5.1. Company Overview
- 12.1.5.2. Products
- 12.1.5.3. Company Financials
- 12.1.5.4. SWOT Analysis
- 12.1.6 Iwatani Corporation
- 12.1.6.1. Company Overview
- 12.1.6.2. Products
- 12.1.6.3. Company Financials
- 12.1.6.4. SWOT Analysis
- 12.1.7 American Welding & Gas
- 12.1.7.1. Company Overview
- 12.1.7.2. Products
- 12.1.7.3. Company Financials
- 12.1.7.4. SWOT Analysis
- 12.1.8 Messer Group
- 12.1.8.1. Company Overview
- 12.1.8.2. Products
- 12.1.8.3. Company Financials
- 12.1.8.4. SWOT Analysis
- 12.1.9 Air Liquide
- 12.1.9.1. Company Overview
- 12.1.9.2. Products
- 12.1.9.3. Company Financials
- 12.1.9.4. SWOT Analysis
- 12.1.10 Airgas Inc
- 12.1.10.1. Company Overview
- 12.1.10.2. Products
- 12.1.10.3. Company Financials
- 12.1.10.4. SWOT Analysis
- 12.1.1 Air Products and Chemicals Inc
- 12.2. Market Entropy
- 12.2.1 Company's Key Areas Served
- 12.2.2 Recent Developments
- 12.3. Company Market Share Analysis 2025
- 12.3.1 Top 5 Companies Market Share Analysis
- 12.3.2 Top 3 Companies Market Share Analysis
- 12.4. List of Potential Customers
- 13. Research Methodology
List of Figures
- Figure 1: Global Pure Gas Industry Revenue Breakdown (billion, %) by Region 2025 & 2033
- Figure 2: Asia Pacific Pure Gas Industry Revenue (billion), by Product Type 2025 & 2033
- Figure 3: Asia Pacific Pure Gas Industry Revenue Share (%), by Product Type 2025 & 2033
- Figure 4: Asia Pacific Pure Gas Industry Revenue (billion), by Application 2025 & 2033
- Figure 5: Asia Pacific Pure Gas Industry Revenue Share (%), by Application 2025 & 2033
- Figure 6: Asia Pacific Pure Gas Industry Revenue (billion), by End-user Industry 2025 & 2033
- Figure 7: Asia Pacific Pure Gas Industry Revenue Share (%), by End-user Industry 2025 & 2033
- Figure 8: Asia Pacific Pure Gas Industry Revenue (billion), by Country 2025 & 2033
- Figure 9: Asia Pacific Pure Gas Industry Revenue Share (%), by Country 2025 & 2033
- Figure 10: North America Pure Gas Industry Revenue (billion), by Product Type 2025 & 2033
- Figure 11: North America Pure Gas Industry Revenue Share (%), by Product Type 2025 & 2033
- Figure 12: North America Pure Gas Industry Revenue (billion), by Application 2025 & 2033
- Figure 13: North America Pure Gas Industry Revenue Share (%), by Application 2025 & 2033
- Figure 14: North America Pure Gas Industry Revenue (billion), by End-user Industry 2025 & 2033
- Figure 15: North America Pure Gas Industry Revenue Share (%), by End-user Industry 2025 & 2033
- Figure 16: North America Pure Gas Industry Revenue (billion), by Country 2025 & 2033
- Figure 17: North America Pure Gas Industry Revenue Share (%), by Country 2025 & 2033
- Figure 18: Europe Pure Gas Industry Revenue (billion), by Product Type 2025 & 2033
- Figure 19: Europe Pure Gas Industry Revenue Share (%), by Product Type 2025 & 2033
- Figure 20: Europe Pure Gas Industry Revenue (billion), by Application 2025 & 2033
- Figure 21: Europe Pure Gas Industry Revenue Share (%), by Application 2025 & 2033
- Figure 22: Europe Pure Gas Industry Revenue (billion), by End-user Industry 2025 & 2033
- Figure 23: Europe Pure Gas Industry Revenue Share (%), by End-user Industry 2025 & 2033
- Figure 24: Europe Pure Gas Industry Revenue (billion), by Country 2025 & 2033
- Figure 25: Europe Pure Gas Industry Revenue Share (%), by Country 2025 & 2033
- Figure 26: South America Pure Gas Industry Revenue (billion), by Product Type 2025 & 2033
- Figure 27: South America Pure Gas Industry Revenue Share (%), by Product Type 2025 & 2033
- Figure 28: South America Pure Gas Industry Revenue (billion), by Application 2025 & 2033
- Figure 29: South America Pure Gas Industry Revenue Share (%), by Application 2025 & 2033
- Figure 30: South America Pure Gas Industry Revenue (billion), by End-user Industry 2025 & 2033
- Figure 31: South America Pure Gas Industry Revenue Share (%), by End-user Industry 2025 & 2033
- Figure 32: South America Pure Gas Industry Revenue (billion), by Country 2025 & 2033
- Figure 33: South America Pure Gas Industry Revenue Share (%), by Country 2025 & 2033
- Figure 34: Middle East and Africa Pure Gas Industry Revenue (billion), by Product Type 2025 & 2033
- Figure 35: Middle East and Africa Pure Gas Industry Revenue Share (%), by Product Type 2025 & 2033
- Figure 36: Middle East and Africa Pure Gas Industry Revenue (billion), by Application 2025 & 2033
- Figure 37: Middle East and Africa Pure Gas Industry Revenue Share (%), by Application 2025 & 2033
- Figure 38: Middle East and Africa Pure Gas Industry Revenue (billion), by End-user Industry 2025 & 2033
- Figure 39: Middle East and Africa Pure Gas Industry Revenue Share (%), by End-user Industry 2025 & 2033
- Figure 40: Middle East and Africa Pure Gas Industry Revenue (billion), by Country 2025 & 2033
- Figure 41: Middle East and Africa Pure Gas Industry Revenue Share (%), by Country 2025 & 2033
List of Tables
- Table 1: Global Pure Gas Industry Revenue billion Forecast, by Product Type 2020 & 2033
- Table 2: Global Pure Gas Industry Revenue billion Forecast, by Application 2020 & 2033
- Table 3: Global Pure Gas Industry Revenue billion Forecast, by End-user Industry 2020 & 2033
- Table 4: Global Pure Gas Industry Revenue billion Forecast, by Region 2020 & 2033
- Table 5: Global Pure Gas Industry Revenue billion Forecast, by Product Type 2020 & 2033
- Table 6: Global Pure Gas Industry Revenue billion Forecast, by Application 2020 & 2033
- Table 7: Global Pure Gas Industry Revenue billion Forecast, by End-user Industry 2020 & 2033
- Table 8: Global Pure Gas Industry Revenue billion Forecast, by Country 2020 & 2033
- Table 9: China Pure Gas Industry Revenue (billion) Forecast, by Application 2020 & 2033
- Table 10: India Pure Gas Industry Revenue (billion) Forecast, by Application 2020 & 2033
- Table 11: Japan Pure Gas Industry Revenue (billion) Forecast, by Application 2020 & 2033
- Table 12: South Korea Pure Gas Industry Revenue (billion) Forecast, by Application 2020 & 2033
- Table 13: ASEAN Countries Pure Gas Industry Revenue (billion) Forecast, by Application 2020 & 2033
- Table 14: Rest of Asia Pacific Pure Gas Industry Revenue (billion) Forecast, by Application 2020 & 2033
- Table 15: Global Pure Gas Industry Revenue billion Forecast, by Product Type 2020 & 2033
- Table 16: Global Pure Gas Industry Revenue billion Forecast, by Application 2020 & 2033
- Table 17: Global Pure Gas Industry Revenue billion Forecast, by End-user Industry 2020 & 2033
- Table 18: Global Pure Gas Industry Revenue billion Forecast, by Country 2020 & 2033
- Table 19: United States Pure Gas Industry Revenue (billion) Forecast, by Application 2020 & 2033
- Table 20: Canada Pure Gas Industry Revenue (billion) Forecast, by Application 2020 & 2033
- Table 21: Mexico Pure Gas Industry Revenue (billion) Forecast, by Application 2020 & 2033
- Table 22: Global Pure Gas Industry Revenue billion Forecast, by Product Type 2020 & 2033
- Table 23: Global Pure Gas Industry Revenue billion Forecast, by Application 2020 & 2033
- Table 24: Global Pure Gas Industry Revenue billion Forecast, by End-user Industry 2020 & 2033
- Table 25: Global Pure Gas Industry Revenue billion Forecast, by Country 2020 & 2033
- Table 26: Germany Pure Gas Industry Revenue (billion) Forecast, by Application 2020 & 2033
- Table 27: United Kingdom Pure Gas Industry Revenue (billion) Forecast, by Application 2020 & 2033
- Table 28: Italy Pure Gas Industry Revenue (billion) Forecast, by Application 2020 & 2033
- Table 29: France Pure Gas Industry Revenue (billion) Forecast, by Application 2020 & 2033
- Table 30: Rest of Europe Pure Gas Industry Revenue (billion) Forecast, by Application 2020 & 2033
- Table 31: Global Pure Gas Industry Revenue billion Forecast, by Product Type 2020 & 2033
- Table 32: Global Pure Gas Industry Revenue billion Forecast, by Application 2020 & 2033
- Table 33: Global Pure Gas Industry Revenue billion Forecast, by End-user Industry 2020 & 2033
- Table 34: Global Pure Gas Industry Revenue billion Forecast, by Country 2020 & 2033
- Table 35: Brazil Pure Gas Industry Revenue (billion) Forecast, by Application 2020 & 2033
- Table 36: Argentina Pure Gas Industry Revenue (billion) Forecast, by Application 2020 & 2033
- Table 37: Rest of South America Pure Gas Industry Revenue (billion) Forecast, by Application 2020 & 2033
- Table 38: Global Pure Gas Industry Revenue billion Forecast, by Product Type 2020 & 2033
- Table 39: Global Pure Gas Industry Revenue billion Forecast, by Application 2020 & 2033
- Table 40: Global Pure Gas Industry Revenue billion Forecast, by End-user Industry 2020 & 2033
- Table 41: Global Pure Gas Industry Revenue billion Forecast, by Country 2020 & 2033
- Table 42: Saudi Arabia Pure Gas Industry Revenue (billion) Forecast, by Application 2020 & 2033
- Table 43: South Africa Pure Gas Industry Revenue (billion) Forecast, by Application 2020 & 2033
- Table 44: Rest of Middle East and Africa Pure Gas Industry Revenue (billion) Forecast, by Application 2020 & 2033
Frequently Asked Questions
1. What is the projected Compound Annual Growth Rate (CAGR) of the Pure Gas Industry?
The projected CAGR is approximately 4.4%.
2. Which companies are prominent players in the Pure Gas Industry?
Key companies in the market include Air Products and Chemicals Inc, Advanced Specialty Gases, Linde plc*List Not Exhaustive, OSAKA GAS LIQUID Co Ltd, Matheson Tri-Gas Inc, Iwatani Corporation, American Welding & Gas, Messer Group, Air Liquide, Airgas Inc.
3. What are the main segments of the Pure Gas Industry?
The market segments include Product Type, Application, End-user Industry.
4. Can you provide details about the market size?
The market size is estimated to be USD 119.11 billion as of 2022.
5. What are some drivers contributing to market growth?
; Increasing Demand from Electronics Industry; Rising Demand for Solar PV Production.
6. What are the notable trends driving market growth?
Noble Gas Product Type to Dominate the Market.
7. Are there any restraints impacting market growth?
; High Cost of Indium Tin Oxide; Other Restraints.
8. Can you provide examples of recent developments in the market?
N/A
9. What pricing options are available for accessing the report?
Pricing options include single-user, multi-user, and enterprise licenses priced at USD 4750, USD 5250, and USD 8750 respectively.
10. Is the market size provided in terms of value or volume?
The market size is provided in terms of value, measured in billion.
11. Are there any specific market keywords associated with the report?
Yes, the market keyword associated with the report is "Pure Gas Industry," which aids in identifying and referencing the specific market segment covered.
12. How do I determine which pricing option suits my needs best?
The pricing options vary based on user requirements and access needs. Individual users may opt for single-user licenses, while businesses requiring broader access may choose multi-user or enterprise licenses for cost-effective access to the report.
13. Are there any additional resources or data provided in the Pure Gas Industry report?
While the report offers comprehensive insights, it's advisable to review the specific contents or supplementary materials provided to ascertain if additional resources or data are available.
14. How can I stay updated on further developments or reports in the Pure Gas Industry?
To stay informed about further developments, trends, and reports in the Pure Gas Industry, consider subscribing to industry newsletters, following relevant companies and organizations, or regularly checking reputable industry news sources and publications.
Methodology
Step 1 - Identification of Relevant Samples Size from Population Database


Step 2 - Approaches for Defining Global Market Size (Value, Volume* & Price*)

Note*: In applicable scenarios
Step 3 - Data Sources
Primary Research
- Web Analytics
- Survey Reports
- Research Institute
- Latest Research Reports
- Opinion Leaders
Secondary Research
- Annual Reports
- White Paper
- Latest Press Release
- Industry Association
- Paid Database
- Investor Presentations

Step 4 - Data Triangulation
Involves using different sources of information in order to increase the validity of a study
These sources are likely to be stakeholders in a program - participants, other researchers, program staff, other community members, and so on.
Then we put all data in single framework & apply various statistical tools to find out the dynamic on the market.
During the analysis stage, feedback from the stakeholder groups would be compared to determine areas of agreement as well as areas of divergence