

Key Insights
The global polyurethane composites market is poised for robust expansion, with an estimated Compound Annual Growth Rate (CAGR) of 5.96% between 2025 and 2033. This growth is propelled by the increasing demand for high-strength, lightweight materials across key industries. The automotive and transportation sectors are significant drivers, leveraging polyurethane composites for their superior impact resistance, durability, and thermal insulation in components like body panels and interior elements. The construction industry's embrace of these materials for energy-efficient insulation and structural applications, alongside the wind energy sector's use in blades due to excellent fatigue resistance, further fuels market momentum. While raw material price volatility and environmental considerations present challenges, advancements in sustainable materials and manufacturing processes are actively addressing these concerns. The market is segmented by fiber type (glass, carbon, others) and end-user industry (transportation, building & construction, electrical & electronics, wind energy, others). Key market players are investing in innovation and portfolio expansion to capitalize on emerging opportunities. The Asia-Pacific region, particularly China and India, is expected to lead growth due to rapid industrialization and infrastructure development. North America and Europe also represent substantial market share, supported by established automotive and construction industries. The market size is projected to reach 870.93 million by 2025.
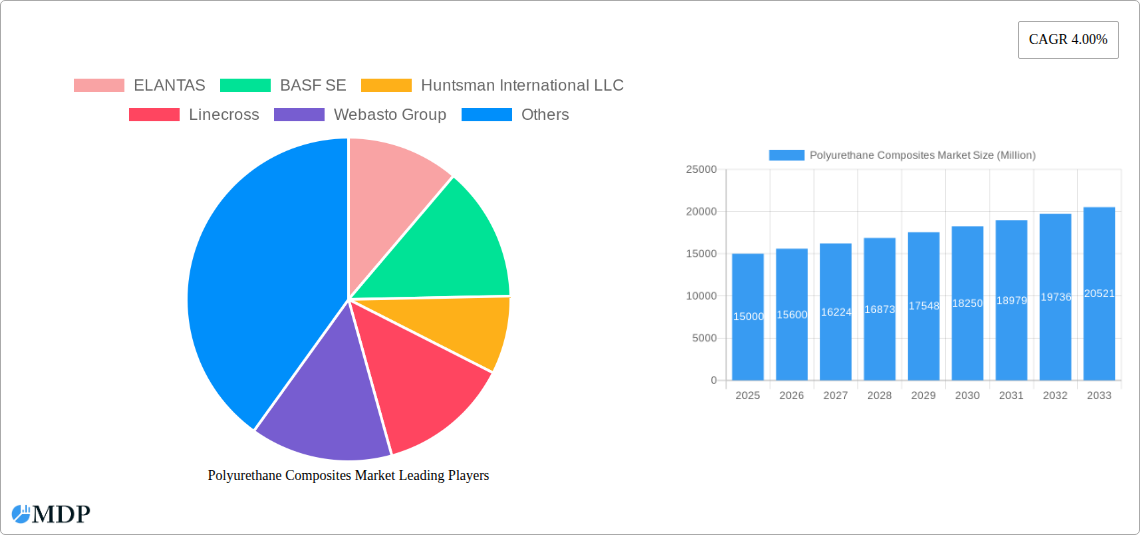
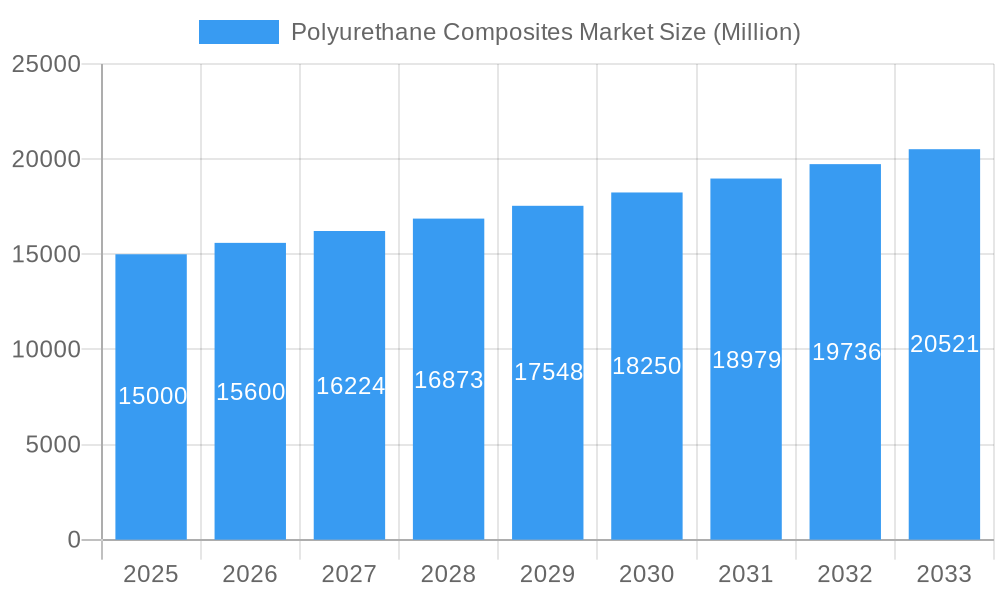
Polyurethane Composites Market Market Size (In Million)
Future market growth will be significantly influenced by ongoing innovations in material science, enhancing performance and sustainability. The adoption of bio-based polyurethane components aligns with the global drive for eco-friendly solutions. Evolving regulations concerning emissions and sustainability across various end-use sectors will also shape market dynamics. The competitive landscape is dynamic, characterized by both established leaders and emerging players, driving continuous product innovation and competitive pricing. This environment fosters the broader adoption of polyurethane composites in diverse applications.
Polyurethane Composites Market Company Market Share
Polyurethane Composites Market: A Comprehensive Report (2019-2033)
Unlocking Growth Opportunities in the Thriving Polyurethane Composites Market
This comprehensive report provides an in-depth analysis of the Polyurethane Composites market, offering invaluable insights for stakeholders seeking to navigate this dynamic landscape. Covering the period from 2019 to 2033, with a base year of 2025, this study meticulously examines market dynamics, trends, leading players, and future prospects. The global market size is projected to reach xx Million by 2033, exhibiting a CAGR of xx% during the forecast period (2025-2033).
Polyurethane Composites Market Market Dynamics & Concentration
The polyurethane composites market is characterized by a moderately concentrated landscape, with key players such as ELANTAS, BASF SE, Huntsman International LLC, Linecross, Webasto Group, Henkel Corporation, and Covestro AG holding significant market share. The market share distribution is expected to evolve with ongoing mergers and acquisitions (M&A) activity and the entrance of new players. In the historical period (2019-2024), approximately xx M&A deals were recorded, driving consolidation and shaping competitive dynamics. Innovation in fiber types (glass, carbon, and others), coupled with advancements in manufacturing processes, fuels market growth. Stringent environmental regulations concerning volatile organic compounds (VOCs) present challenges, while increasing demand from the transportation and construction sectors is a major driver. Product substitution from alternative materials remains a minor threat, offset by the unique performance characteristics of polyurethane composites. End-user preferences are shifting towards lighter, stronger, and more sustainable materials, which is beneficial for the market.
- Market Concentration: Moderately concentrated, with top players holding xx% market share in 2025.
- Innovation Drivers: Advancements in fiber technology, manufacturing processes, and sustainable formulations.
- Regulatory Framework: Stringent environmental regulations impacting material choices and manufacturing.
- Product Substitutes: Limited substitution due to unique material properties, but competition from alternative materials exists.
- M&A Activity: xx M&A deals recorded between 2019 and 2024, leading to market consolidation.
Polyurethane Composites Market Industry Trends & Analysis
The polyurethane composites market is experiencing robust growth, driven by a surge in demand across diverse end-user industries. The transportation sector, particularly automotive and aerospace, is a major contributor due to the lightweight and high-strength properties of these composites. The building and construction sector is also showing significant adoption, with polyurethane composites used in insulation, roofing, and structural components. Technological advancements, including the development of high-performance fibers and improved manufacturing techniques, are further accelerating market expansion. Consumer preferences for lightweight, durable, and energy-efficient materials are also positively influencing market growth. The market exhibits intense competition, with established players and emerging companies vying for market share through product innovation, strategic partnerships, and geographical expansion. The global market is anticipated to grow at a CAGR of xx% during the forecast period (2025-2033), driven by factors like increasing infrastructure development and the adoption of sustainable building practices. Market penetration in emerging economies is also expected to rise.
Leading Markets & Segments in Polyurethane Composites Market
The transportation segment dominates the polyurethane composites market, accounting for approximately xx% of the global market share in 2025. This dominance is fueled by the automotive industry's increasing demand for lightweight materials to improve fuel efficiency and reduce emissions. The building and construction sector holds the second largest share, driven by increased infrastructure development and the growing preference for energy-efficient building materials. Within fiber types, glass fiber composites hold the largest market share, although carbon fiber composites are experiencing significant growth due to their superior strength-to-weight ratio. Geographically, North America and Europe are currently leading regions, but Asia-Pacific is expected to witness the highest growth rate during the forecast period due to rapid industrialization and infrastructure development.
- Dominant Segment (By Fiber Type): Glass Fiber Composites
- Key Drivers (Transportation): Stringent fuel efficiency standards, increasing vehicle production.
- Key Drivers (Building & Construction): Infrastructure development, energy efficiency regulations, rising construction activity.
- Dominant Region: North America
- Fastest-Growing Region: Asia-Pacific
Polyurethane Composites Market Product Developments
Recent product developments in the polyurethane composites market focus on enhancing material properties, expanding applications, and improving manufacturing processes. This includes innovations such as self-healing composites, nano-enhanced materials, and recyclable polyurethane formulations. These advancements improve the performance, durability, and sustainability of polyurethane composites, leading to increased adoption across various industries. The market is witnessing a shift towards high-performance, specialized composites designed to meet the specific needs of diverse applications. Furthermore, the integration of smart technologies, such as sensors and embedded electronics, is transforming the functionalities of polyurethane composite materials, opening new avenues for applications.
Key Drivers of Polyurethane Composites Market Growth
Several factors are driving the growth of the polyurethane composites market. Technological advancements, particularly in fiber technology and manufacturing processes, are continuously improving the performance and versatility of these materials. The increasing demand for lightweight, high-strength materials in the automotive and aerospace sectors is a key growth driver. Government initiatives promoting sustainable building practices and energy-efficient construction also boost market growth. Furthermore, economic growth in developing economies is increasing infrastructure development and construction projects, furthering the demand for polyurethane composites.
Challenges in the Polyurethane Composites Market Market
Despite significant growth potential, the polyurethane composites market faces several challenges. The high cost of some advanced materials, particularly carbon fiber composites, can limit their widespread adoption. Fluctuations in raw material prices can impact profitability and make it difficult to maintain price competitiveness. Environmental regulations concerning VOC emissions also present compliance challenges for manufacturers. Intense competition among industry players adds to the challenges, necessitating continuous innovation and strategic initiatives to retain market share.
Emerging Opportunities in Polyurethane Composites Market
The polyurethane composites market presents numerous opportunities for growth. The development of sustainable and recyclable polyurethane composites is attracting increasing interest, creating significant growth potential. Strategic partnerships and collaborations between material suppliers, manufacturers, and end-users are facilitating innovation and market expansion. The integration of smart technologies and sensor capabilities into composite materials opens new avenues for advanced applications. Expansion into emerging markets in Asia-Pacific and Latin America offers significant untapped potential.
Leading Players in the Polyurethane Composites Market Sector
Key Milestones in Polyurethane Composites Market Industry
- 2020: Introduction of a new recyclable polyurethane composite by Covestro AG.
- 2021: BASF SE announces a strategic partnership to develop high-performance carbon fiber composites.
- 2022: Acquisition of a smaller composite manufacturer by Huntsman International LLC.
- 2023: Launch of a self-healing polyurethane composite by a new entrant in the market.
- 2024: Significant increase in demand for sustainable polyurethane composites due to new regulations.
Strategic Outlook for Polyurethane Composites Market Market
The future of the polyurethane composites market looks promising, with significant growth potential driven by technological advancements, increasing demand from key end-user industries, and a growing emphasis on sustainability. Strategic initiatives focusing on innovation, partnerships, and market expansion will be crucial for players seeking to capitalize on the emerging opportunities. Companies that can effectively manage raw material costs, adapt to evolving environmental regulations, and deliver high-performance, sustainable products will be well-positioned for success in this dynamic market.
Polyurethane Composites Market Segmentation
-
1. Fiber Type
- 1.1. Glass
- 1.2. Carbon
- 1.3. Others
-
2. End-user Industry
- 2.1. Transportation
- 2.2. Building & Construction
- 2.3. Electrical & Electronics
- 2.4. Wind Energy
- 2.5. Others
Polyurethane Composites Market Segmentation By Geography
-
1. Asia Pacific
- 1.1. China
- 1.2. India
- 1.3. Japan
- 1.4. South Korea
- 1.5. Rest of Asia Pacific
-
2. North America
- 2.1. United States
- 2.2. Canada
- 2.3. Mexico
-
3. Europe
- 3.1. Germany
- 3.2. United Kingdom
- 3.3. Italy
- 3.4. France
- 3.5. Rest of Europe
-
4. South America
- 4.1. Brazil
- 4.2. Argentina
- 4.3. Rest of South America
-
5. Middle East and Africa
- 5.1. Saudi Arabia
- 5.2. South Africa
- 5.3. Rest of Middle East and Africa
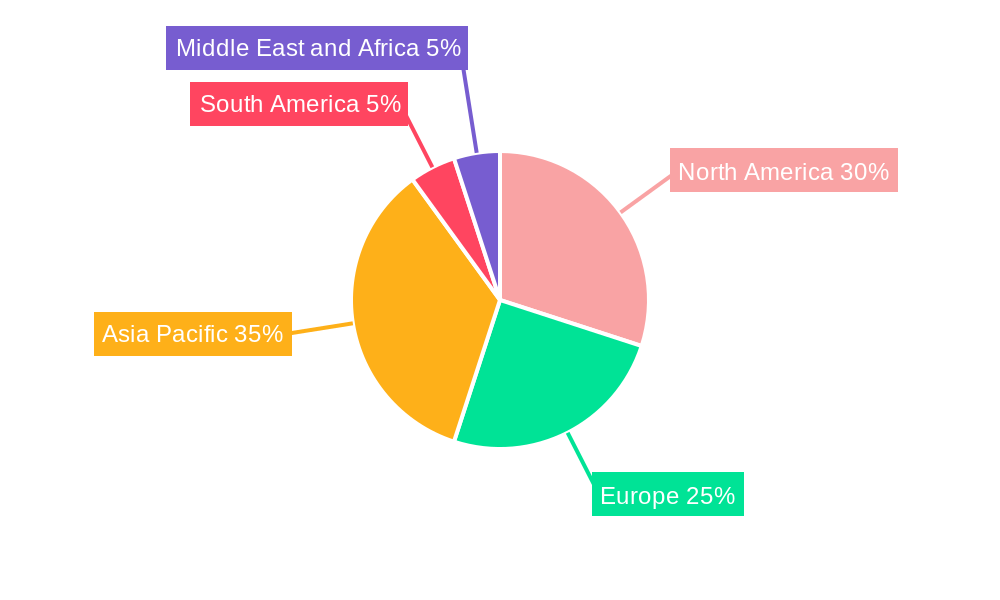
Polyurethane Composites Market Regional Market Share
Geographic Coverage of Polyurethane Composites Market
Polyurethane Composites Market REPORT HIGHLIGHTS
| Aspects | Details |
|---|---|
| Study Period | 2020-2034 |
| Base Year | 2025 |
| Estimated Year | 2026 |
| Forecast Period | 2026-2034 |
| Historical Period | 2020-2025 |
| Growth Rate | CAGR of 5.96% from 2020-2034 |
| Segmentation |
|
Table of Contents
- 1. Introduction
- 1.1. Research Scope
- 1.2. Market Segmentation
- 1.3. Research Objective
- 1.4. Definitions and Assumptions
- 2. Executive Summary
- 2.1. Market Snapshot
- 3. Market Dynamics
- 3.1. Market Drivers
- 3.2. Market Restrains
- 3.3. Market Trends
- 3.4. Market Opportunities
- 4. Market Factor Analysis
- 4.1. Porters Five Forces
- 4.1.1. Bargaining Power of Suppliers
- 4.1.2. Bargaining Power of Buyers
- 4.1.3. Threat of New Entrants
- 4.1.4. Threat of Substitutes
- 4.1.5. Competitive Rivalry
- 4.2. PESTEL analysis
- 4.3. BCG Analysis
- 4.3.1. Stars (High Growth, High Market Share)
- 4.3.2. Cash Cows (Low Growth, High Market Share)
- 4.3.3. Question Mark (High Growth, Low Market Share)
- 4.3.4. Dogs (Low Growth, Low Market Share)
- 4.4. Ansoff Matrix Analysis
- 4.5. Supply Chain Analysis
- 4.6. Regulatory Landscape
- 4.7. Current Market Potential and Opportunity Assessment (TAM–SAM–SOM Framework)
- 4.8. MDP Analyst Note
- 4.1. Porters Five Forces
- 5. Market Analysis, Insights and Forecast 2021-2033
- 5.1. Market Analysis, Insights and Forecast - by Fiber Type
- 5.1.1. Glass
- 5.1.2. Carbon
- 5.1.3. Others
- 5.2. Market Analysis, Insights and Forecast - by End-user Industry
- 5.2.1. Transportation
- 5.2.2. Building & Construction
- 5.2.3. Electrical & Electronics
- 5.2.4. Wind Energy
- 5.2.5. Others
- 5.3. Market Analysis, Insights and Forecast - by Region
- 5.3.1. Asia Pacific
- 5.3.2. North America
- 5.3.3. Europe
- 5.3.4. South America
- 5.3.5. Middle East and Africa
- 5.1. Market Analysis, Insights and Forecast - by Fiber Type
- 6. Global Polyurethane Composites Market Analysis, Insights and Forecast, 2021-2033
- 6.1. Market Analysis, Insights and Forecast - by Fiber Type
- 6.1.1. Glass
- 6.1.2. Carbon
- 6.1.3. Others
- 6.2. Market Analysis, Insights and Forecast - by End-user Industry
- 6.2.1. Transportation
- 6.2.2. Building & Construction
- 6.2.3. Electrical & Electronics
- 6.2.4. Wind Energy
- 6.2.5. Others
- 6.1. Market Analysis, Insights and Forecast - by Fiber Type
- 7. Asia Pacific Polyurethane Composites Market Analysis, Insights and Forecast, 2020-2032
- 7.1. Market Analysis, Insights and Forecast - by Fiber Type
- 7.1.1. Glass
- 7.1.2. Carbon
- 7.1.3. Others
- 7.2. Market Analysis, Insights and Forecast - by End-user Industry
- 7.2.1. Transportation
- 7.2.2. Building & Construction
- 7.2.3. Electrical & Electronics
- 7.2.4. Wind Energy
- 7.2.5. Others
- 7.1. Market Analysis, Insights and Forecast - by Fiber Type
- 8. North America Polyurethane Composites Market Analysis, Insights and Forecast, 2020-2032
- 8.1. Market Analysis, Insights and Forecast - by Fiber Type
- 8.1.1. Glass
- 8.1.2. Carbon
- 8.1.3. Others
- 8.2. Market Analysis, Insights and Forecast - by End-user Industry
- 8.2.1. Transportation
- 8.2.2. Building & Construction
- 8.2.3. Electrical & Electronics
- 8.2.4. Wind Energy
- 8.2.5. Others
- 8.1. Market Analysis, Insights and Forecast - by Fiber Type
- 9. Europe Polyurethane Composites Market Analysis, Insights and Forecast, 2020-2032
- 9.1. Market Analysis, Insights and Forecast - by Fiber Type
- 9.1.1. Glass
- 9.1.2. Carbon
- 9.1.3. Others
- 9.2. Market Analysis, Insights and Forecast - by End-user Industry
- 9.2.1. Transportation
- 9.2.2. Building & Construction
- 9.2.3. Electrical & Electronics
- 9.2.4. Wind Energy
- 9.2.5. Others
- 9.1. Market Analysis, Insights and Forecast - by Fiber Type
- 10. South America Polyurethane Composites Market Analysis, Insights and Forecast, 2020-2032
- 10.1. Market Analysis, Insights and Forecast - by Fiber Type
- 10.1.1. Glass
- 10.1.2. Carbon
- 10.1.3. Others
- 10.2. Market Analysis, Insights and Forecast - by End-user Industry
- 10.2.1. Transportation
- 10.2.2. Building & Construction
- 10.2.3. Electrical & Electronics
- 10.2.4. Wind Energy
- 10.2.5. Others
- 10.1. Market Analysis, Insights and Forecast - by Fiber Type
- 11. Middle East and Africa Polyurethane Composites Market Analysis, Insights and Forecast, 2020-2032
- 11.1. Market Analysis, Insights and Forecast - by Fiber Type
- 11.1.1. Glass
- 11.1.2. Carbon
- 11.1.3. Others
- 11.2. Market Analysis, Insights and Forecast - by End-user Industry
- 11.2.1. Transportation
- 11.2.2. Building & Construction
- 11.2.3. Electrical & Electronics
- 11.2.4. Wind Energy
- 11.2.5. Others
- 11.1. Market Analysis, Insights and Forecast - by Fiber Type
- 12. Competitive Analysis
- 12.1. Company Profiles
- 12.1.1 ELANTAS
- 12.1.1.1. Company Overview
- 12.1.1.2. Products
- 12.1.1.3. Company Financials
- 12.1.1.4. SWOT Analysis
- 12.1.2 BASF SE
- 12.1.2.1. Company Overview
- 12.1.2.2. Products
- 12.1.2.3. Company Financials
- 12.1.2.4. SWOT Analysis
- 12.1.3 Huntsman International LLC
- 12.1.3.1. Company Overview
- 12.1.3.2. Products
- 12.1.3.3. Company Financials
- 12.1.3.4. SWOT Analysis
- 12.1.4 Linecross
- 12.1.4.1. Company Overview
- 12.1.4.2. Products
- 12.1.4.3. Company Financials
- 12.1.4.4. SWOT Analysis
- 12.1.5 Webasto Group
- 12.1.5.1. Company Overview
- 12.1.5.2. Products
- 12.1.5.3. Company Financials
- 12.1.5.4. SWOT Analysis
- 12.1.6 Henkel Corporation
- 12.1.6.1. Company Overview
- 12.1.6.2. Products
- 12.1.6.3. Company Financials
- 12.1.6.4. SWOT Analysis
- 12.1.7 Covestro AG
- 12.1.7.1. Company Overview
- 12.1.7.2. Products
- 12.1.7.3. Company Financials
- 12.1.7.4. SWOT Analysis
- 12.1.1 ELANTAS
- 12.2. Market Entropy
- 12.2.1 Company's Key Areas Served
- 12.2.2 Recent Developments
- 12.3. Company Market Share Analysis 2025
- 12.3.1 Top 5 Companies Market Share Analysis
- 12.3.2 Top 3 Companies Market Share Analysis
- 12.4. List of Potential Customers
- 13. Research Methodology
List of Figures
- Figure 1: Global Polyurethane Composites Market Revenue Breakdown (million, %) by Region 2025 & 2033
- Figure 2: Global Polyurethane Composites Market Volume Breakdown (grams per cubic centimeter , %) by Region 2025 & 2033
- Figure 3: Asia Pacific Polyurethane Composites Market Revenue (million), by Fiber Type 2025 & 2033
- Figure 4: Asia Pacific Polyurethane Composites Market Volume (grams per cubic centimeter ), by Fiber Type 2025 & 2033
- Figure 5: Asia Pacific Polyurethane Composites Market Revenue Share (%), by Fiber Type 2025 & 2033
- Figure 6: Asia Pacific Polyurethane Composites Market Volume Share (%), by Fiber Type 2025 & 2033
- Figure 7: Asia Pacific Polyurethane Composites Market Revenue (million), by End-user Industry 2025 & 2033
- Figure 8: Asia Pacific Polyurethane Composites Market Volume (grams per cubic centimeter ), by End-user Industry 2025 & 2033
- Figure 9: Asia Pacific Polyurethane Composites Market Revenue Share (%), by End-user Industry 2025 & 2033
- Figure 10: Asia Pacific Polyurethane Composites Market Volume Share (%), by End-user Industry 2025 & 2033
- Figure 11: Asia Pacific Polyurethane Composites Market Revenue (million), by Country 2025 & 2033
- Figure 12: Asia Pacific Polyurethane Composites Market Volume (grams per cubic centimeter ), by Country 2025 & 2033
- Figure 13: Asia Pacific Polyurethane Composites Market Revenue Share (%), by Country 2025 & 2033
- Figure 14: Asia Pacific Polyurethane Composites Market Volume Share (%), by Country 2025 & 2033
- Figure 15: North America Polyurethane Composites Market Revenue (million), by Fiber Type 2025 & 2033
- Figure 16: North America Polyurethane Composites Market Volume (grams per cubic centimeter ), by Fiber Type 2025 & 2033
- Figure 17: North America Polyurethane Composites Market Revenue Share (%), by Fiber Type 2025 & 2033
- Figure 18: North America Polyurethane Composites Market Volume Share (%), by Fiber Type 2025 & 2033
- Figure 19: North America Polyurethane Composites Market Revenue (million), by End-user Industry 2025 & 2033
- Figure 20: North America Polyurethane Composites Market Volume (grams per cubic centimeter ), by End-user Industry 2025 & 2033
- Figure 21: North America Polyurethane Composites Market Revenue Share (%), by End-user Industry 2025 & 2033
- Figure 22: North America Polyurethane Composites Market Volume Share (%), by End-user Industry 2025 & 2033
- Figure 23: North America Polyurethane Composites Market Revenue (million), by Country 2025 & 2033
- Figure 24: North America Polyurethane Composites Market Volume (grams per cubic centimeter ), by Country 2025 & 2033
- Figure 25: North America Polyurethane Composites Market Revenue Share (%), by Country 2025 & 2033
- Figure 26: North America Polyurethane Composites Market Volume Share (%), by Country 2025 & 2033
- Figure 27: Europe Polyurethane Composites Market Revenue (million), by Fiber Type 2025 & 2033
- Figure 28: Europe Polyurethane Composites Market Volume (grams per cubic centimeter ), by Fiber Type 2025 & 2033
- Figure 29: Europe Polyurethane Composites Market Revenue Share (%), by Fiber Type 2025 & 2033
- Figure 30: Europe Polyurethane Composites Market Volume Share (%), by Fiber Type 2025 & 2033
- Figure 31: Europe Polyurethane Composites Market Revenue (million), by End-user Industry 2025 & 2033
- Figure 32: Europe Polyurethane Composites Market Volume (grams per cubic centimeter ), by End-user Industry 2025 & 2033
- Figure 33: Europe Polyurethane Composites Market Revenue Share (%), by End-user Industry 2025 & 2033
- Figure 34: Europe Polyurethane Composites Market Volume Share (%), by End-user Industry 2025 & 2033
- Figure 35: Europe Polyurethane Composites Market Revenue (million), by Country 2025 & 2033
- Figure 36: Europe Polyurethane Composites Market Volume (grams per cubic centimeter ), by Country 2025 & 2033
- Figure 37: Europe Polyurethane Composites Market Revenue Share (%), by Country 2025 & 2033
- Figure 38: Europe Polyurethane Composites Market Volume Share (%), by Country 2025 & 2033
- Figure 39: South America Polyurethane Composites Market Revenue (million), by Fiber Type 2025 & 2033
- Figure 40: South America Polyurethane Composites Market Volume (grams per cubic centimeter ), by Fiber Type 2025 & 2033
- Figure 41: South America Polyurethane Composites Market Revenue Share (%), by Fiber Type 2025 & 2033
- Figure 42: South America Polyurethane Composites Market Volume Share (%), by Fiber Type 2025 & 2033
- Figure 43: South America Polyurethane Composites Market Revenue (million), by End-user Industry 2025 & 2033
- Figure 44: South America Polyurethane Composites Market Volume (grams per cubic centimeter ), by End-user Industry 2025 & 2033
- Figure 45: South America Polyurethane Composites Market Revenue Share (%), by End-user Industry 2025 & 2033
- Figure 46: South America Polyurethane Composites Market Volume Share (%), by End-user Industry 2025 & 2033
- Figure 47: South America Polyurethane Composites Market Revenue (million), by Country 2025 & 2033
- Figure 48: South America Polyurethane Composites Market Volume (grams per cubic centimeter ), by Country 2025 & 2033
- Figure 49: South America Polyurethane Composites Market Revenue Share (%), by Country 2025 & 2033
- Figure 50: South America Polyurethane Composites Market Volume Share (%), by Country 2025 & 2033
- Figure 51: Middle East and Africa Polyurethane Composites Market Revenue (million), by Fiber Type 2025 & 2033
- Figure 52: Middle East and Africa Polyurethane Composites Market Volume (grams per cubic centimeter ), by Fiber Type 2025 & 2033
- Figure 53: Middle East and Africa Polyurethane Composites Market Revenue Share (%), by Fiber Type 2025 & 2033
- Figure 54: Middle East and Africa Polyurethane Composites Market Volume Share (%), by Fiber Type 2025 & 2033
- Figure 55: Middle East and Africa Polyurethane Composites Market Revenue (million), by End-user Industry 2025 & 2033
- Figure 56: Middle East and Africa Polyurethane Composites Market Volume (grams per cubic centimeter ), by End-user Industry 2025 & 2033
- Figure 57: Middle East and Africa Polyurethane Composites Market Revenue Share (%), by End-user Industry 2025 & 2033
- Figure 58: Middle East and Africa Polyurethane Composites Market Volume Share (%), by End-user Industry 2025 & 2033
- Figure 59: Middle East and Africa Polyurethane Composites Market Revenue (million), by Country 2025 & 2033
- Figure 60: Middle East and Africa Polyurethane Composites Market Volume (grams per cubic centimeter ), by Country 2025 & 2033
- Figure 61: Middle East and Africa Polyurethane Composites Market Revenue Share (%), by Country 2025 & 2033
- Figure 62: Middle East and Africa Polyurethane Composites Market Volume Share (%), by Country 2025 & 2033
List of Tables
- Table 1: Global Polyurethane Composites Market Revenue million Forecast, by Fiber Type 2020 & 2033
- Table 2: Global Polyurethane Composites Market Volume grams per cubic centimeter Forecast, by Fiber Type 2020 & 2033
- Table 3: Global Polyurethane Composites Market Revenue million Forecast, by End-user Industry 2020 & 2033
- Table 4: Global Polyurethane Composites Market Volume grams per cubic centimeter Forecast, by End-user Industry 2020 & 2033
- Table 5: Global Polyurethane Composites Market Revenue million Forecast, by Region 2020 & 2033
- Table 6: Global Polyurethane Composites Market Volume grams per cubic centimeter Forecast, by Region 2020 & 2033
- Table 7: Global Polyurethane Composites Market Revenue million Forecast, by Fiber Type 2020 & 2033
- Table 8: Global Polyurethane Composites Market Volume grams per cubic centimeter Forecast, by Fiber Type 2020 & 2033
- Table 9: Global Polyurethane Composites Market Revenue million Forecast, by End-user Industry 2020 & 2033
- Table 10: Global Polyurethane Composites Market Volume grams per cubic centimeter Forecast, by End-user Industry 2020 & 2033
- Table 11: Global Polyurethane Composites Market Revenue million Forecast, by Country 2020 & 2033
- Table 12: Global Polyurethane Composites Market Volume grams per cubic centimeter Forecast, by Country 2020 & 2033
- Table 13: China Polyurethane Composites Market Revenue (million) Forecast, by Application 2020 & 2033
- Table 14: China Polyurethane Composites Market Volume (grams per cubic centimeter ) Forecast, by Application 2020 & 2033
- Table 15: India Polyurethane Composites Market Revenue (million) Forecast, by Application 2020 & 2033
- Table 16: India Polyurethane Composites Market Volume (grams per cubic centimeter ) Forecast, by Application 2020 & 2033
- Table 17: Japan Polyurethane Composites Market Revenue (million) Forecast, by Application 2020 & 2033
- Table 18: Japan Polyurethane Composites Market Volume (grams per cubic centimeter ) Forecast, by Application 2020 & 2033
- Table 19: South Korea Polyurethane Composites Market Revenue (million) Forecast, by Application 2020 & 2033
- Table 20: South Korea Polyurethane Composites Market Volume (grams per cubic centimeter ) Forecast, by Application 2020 & 2033
- Table 21: Rest of Asia Pacific Polyurethane Composites Market Revenue (million) Forecast, by Application 2020 & 2033
- Table 22: Rest of Asia Pacific Polyurethane Composites Market Volume (grams per cubic centimeter ) Forecast, by Application 2020 & 2033
- Table 23: Global Polyurethane Composites Market Revenue million Forecast, by Fiber Type 2020 & 2033
- Table 24: Global Polyurethane Composites Market Volume grams per cubic centimeter Forecast, by Fiber Type 2020 & 2033
- Table 25: Global Polyurethane Composites Market Revenue million Forecast, by End-user Industry 2020 & 2033
- Table 26: Global Polyurethane Composites Market Volume grams per cubic centimeter Forecast, by End-user Industry 2020 & 2033
- Table 27: Global Polyurethane Composites Market Revenue million Forecast, by Country 2020 & 2033
- Table 28: Global Polyurethane Composites Market Volume grams per cubic centimeter Forecast, by Country 2020 & 2033
- Table 29: United States Polyurethane Composites Market Revenue (million) Forecast, by Application 2020 & 2033
- Table 30: United States Polyurethane Composites Market Volume (grams per cubic centimeter ) Forecast, by Application 2020 & 2033
- Table 31: Canada Polyurethane Composites Market Revenue (million) Forecast, by Application 2020 & 2033
- Table 32: Canada Polyurethane Composites Market Volume (grams per cubic centimeter ) Forecast, by Application 2020 & 2033
- Table 33: Mexico Polyurethane Composites Market Revenue (million) Forecast, by Application 2020 & 2033
- Table 34: Mexico Polyurethane Composites Market Volume (grams per cubic centimeter ) Forecast, by Application 2020 & 2033
- Table 35: Global Polyurethane Composites Market Revenue million Forecast, by Fiber Type 2020 & 2033
- Table 36: Global Polyurethane Composites Market Volume grams per cubic centimeter Forecast, by Fiber Type 2020 & 2033
- Table 37: Global Polyurethane Composites Market Revenue million Forecast, by End-user Industry 2020 & 2033
- Table 38: Global Polyurethane Composites Market Volume grams per cubic centimeter Forecast, by End-user Industry 2020 & 2033
- Table 39: Global Polyurethane Composites Market Revenue million Forecast, by Country 2020 & 2033
- Table 40: Global Polyurethane Composites Market Volume grams per cubic centimeter Forecast, by Country 2020 & 2033
- Table 41: Germany Polyurethane Composites Market Revenue (million) Forecast, by Application 2020 & 2033
- Table 42: Germany Polyurethane Composites Market Volume (grams per cubic centimeter ) Forecast, by Application 2020 & 2033
- Table 43: United Kingdom Polyurethane Composites Market Revenue (million) Forecast, by Application 2020 & 2033
- Table 44: United Kingdom Polyurethane Composites Market Volume (grams per cubic centimeter ) Forecast, by Application 2020 & 2033
- Table 45: Italy Polyurethane Composites Market Revenue (million) Forecast, by Application 2020 & 2033
- Table 46: Italy Polyurethane Composites Market Volume (grams per cubic centimeter ) Forecast, by Application 2020 & 2033
- Table 47: France Polyurethane Composites Market Revenue (million) Forecast, by Application 2020 & 2033
- Table 48: France Polyurethane Composites Market Volume (grams per cubic centimeter ) Forecast, by Application 2020 & 2033
- Table 49: Rest of Europe Polyurethane Composites Market Revenue (million) Forecast, by Application 2020 & 2033
- Table 50: Rest of Europe Polyurethane Composites Market Volume (grams per cubic centimeter ) Forecast, by Application 2020 & 2033
- Table 51: Global Polyurethane Composites Market Revenue million Forecast, by Fiber Type 2020 & 2033
- Table 52: Global Polyurethane Composites Market Volume grams per cubic centimeter Forecast, by Fiber Type 2020 & 2033
- Table 53: Global Polyurethane Composites Market Revenue million Forecast, by End-user Industry 2020 & 2033
- Table 54: Global Polyurethane Composites Market Volume grams per cubic centimeter Forecast, by End-user Industry 2020 & 2033
- Table 55: Global Polyurethane Composites Market Revenue million Forecast, by Country 2020 & 2033
- Table 56: Global Polyurethane Composites Market Volume grams per cubic centimeter Forecast, by Country 2020 & 2033
- Table 57: Brazil Polyurethane Composites Market Revenue (million) Forecast, by Application 2020 & 2033
- Table 58: Brazil Polyurethane Composites Market Volume (grams per cubic centimeter ) Forecast, by Application 2020 & 2033
- Table 59: Argentina Polyurethane Composites Market Revenue (million) Forecast, by Application 2020 & 2033
- Table 60: Argentina Polyurethane Composites Market Volume (grams per cubic centimeter ) Forecast, by Application 2020 & 2033
- Table 61: Rest of South America Polyurethane Composites Market Revenue (million) Forecast, by Application 2020 & 2033
- Table 62: Rest of South America Polyurethane Composites Market Volume (grams per cubic centimeter ) Forecast, by Application 2020 & 2033
- Table 63: Global Polyurethane Composites Market Revenue million Forecast, by Fiber Type 2020 & 2033
- Table 64: Global Polyurethane Composites Market Volume grams per cubic centimeter Forecast, by Fiber Type 2020 & 2033
- Table 65: Global Polyurethane Composites Market Revenue million Forecast, by End-user Industry 2020 & 2033
- Table 66: Global Polyurethane Composites Market Volume grams per cubic centimeter Forecast, by End-user Industry 2020 & 2033
- Table 67: Global Polyurethane Composites Market Revenue million Forecast, by Country 2020 & 2033
- Table 68: Global Polyurethane Composites Market Volume grams per cubic centimeter Forecast, by Country 2020 & 2033
- Table 69: Saudi Arabia Polyurethane Composites Market Revenue (million) Forecast, by Application 2020 & 2033
- Table 70: Saudi Arabia Polyurethane Composites Market Volume (grams per cubic centimeter ) Forecast, by Application 2020 & 2033
- Table 71: South Africa Polyurethane Composites Market Revenue (million) Forecast, by Application 2020 & 2033
- Table 72: South Africa Polyurethane Composites Market Volume (grams per cubic centimeter ) Forecast, by Application 2020 & 2033
- Table 73: Rest of Middle East and Africa Polyurethane Composites Market Revenue (million) Forecast, by Application 2020 & 2033
- Table 74: Rest of Middle East and Africa Polyurethane Composites Market Volume (grams per cubic centimeter ) Forecast, by Application 2020 & 2033
Frequently Asked Questions
1. What is the projected Compound Annual Growth Rate (CAGR) of the Polyurethane Composites Market?
The projected CAGR is approximately 5.96%.
2. Which companies are prominent players in the Polyurethane Composites Market?
Key companies in the market include ELANTAS, BASF SE, Huntsman International LLC, Linecross, Webasto Group, Henkel Corporation, Covestro AG.
3. What are the main segments of the Polyurethane Composites Market?
The market segments include Fiber Type, End-user Industry.
4. Can you provide details about the market size?
The market size is estimated to be USD 870.93 million as of 2022.
5. What are some drivers contributing to market growth?
; Increasing Demand for the Lightweight Materials From the Transportation Industry; Growing Demand from the Building and Construction Industry.
6. What are the notable trends driving market growth?
Increasing demand from the Transportation Industry.
7. Are there any restraints impacting market growth?
; Slowdown in the Global Automotive Production; High Production Costs.
8. Can you provide examples of recent developments in the market?
N/A
9. What pricing options are available for accessing the report?
Pricing options include single-user, multi-user, and enterprise licenses priced at USD 4750, USD 5250, and USD 8750 respectively.
10. Is the market size provided in terms of value or volume?
The market size is provided in terms of value, measured in million and volume, measured in grams per cubic centimeter .
11. Are there any specific market keywords associated with the report?
Yes, the market keyword associated with the report is "Polyurethane Composites Market," which aids in identifying and referencing the specific market segment covered.
12. How do I determine which pricing option suits my needs best?
The pricing options vary based on user requirements and access needs. Individual users may opt for single-user licenses, while businesses requiring broader access may choose multi-user or enterprise licenses for cost-effective access to the report.
13. Are there any additional resources or data provided in the Polyurethane Composites Market report?
While the report offers comprehensive insights, it's advisable to review the specific contents or supplementary materials provided to ascertain if additional resources or data are available.
14. How can I stay updated on further developments or reports in the Polyurethane Composites Market?
To stay informed about further developments, trends, and reports in the Polyurethane Composites Market, consider subscribing to industry newsletters, following relevant companies and organizations, or regularly checking reputable industry news sources and publications.
Methodology
Step 1 - Identification of Relevant Samples Size from Population Database


Step 2 - Approaches for Defining Global Market Size (Value, Volume* & Price*)

Note*: In applicable scenarios
Step 3 - Data Sources
Primary Research
- Web Analytics
- Survey Reports
- Research Institute
- Latest Research Reports
- Opinion Leaders
Secondary Research
- Annual Reports
- White Paper
- Latest Press Release
- Industry Association
- Paid Database
- Investor Presentations

Step 4 - Data Triangulation
Involves using different sources of information in order to increase the validity of a study
These sources are likely to be stakeholders in a program - participants, other researchers, program staff, other community members, and so on.
Then we put all data in single framework & apply various statistical tools to find out the dynamic on the market.
During the analysis stage, feedback from the stakeholder groups would be compared to determine areas of agreement as well as areas of divergence