

Key Insights
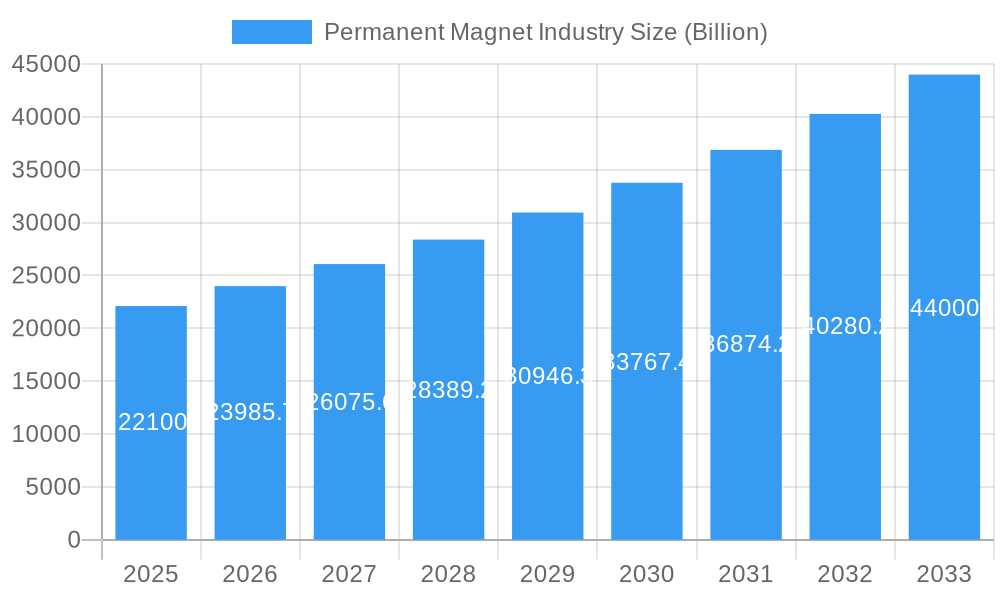
The permanent magnet industry, valued at $22.1 billion in 2025, is projected to experience robust growth, driven by the increasing demand from key sectors such as automotive (electric vehicles and hybrid vehicles), electronics (consumer electronics and renewable energy), and industrial automation. The industry's Compound Annual Growth Rate (CAGR) of 8.7% from 2025 to 2033 reflects a positive outlook fueled by technological advancements leading to higher-performance magnets and the growing adoption of energy-efficient technologies. Neodymium-Iron-Boron magnets currently dominate the market due to their superior magnetic properties, but other materials like samarium cobalt are gaining traction in niche applications requiring extreme temperature resistance or higher coercivity. Geographic expansion, particularly in the Asia-Pacific region driven by significant manufacturing and technological advancements in China and other developing nations, is a major growth driver. While supply chain constraints and fluctuating rare earth prices pose challenges, technological innovation and diversification of sourcing strategies are mitigating these risks.
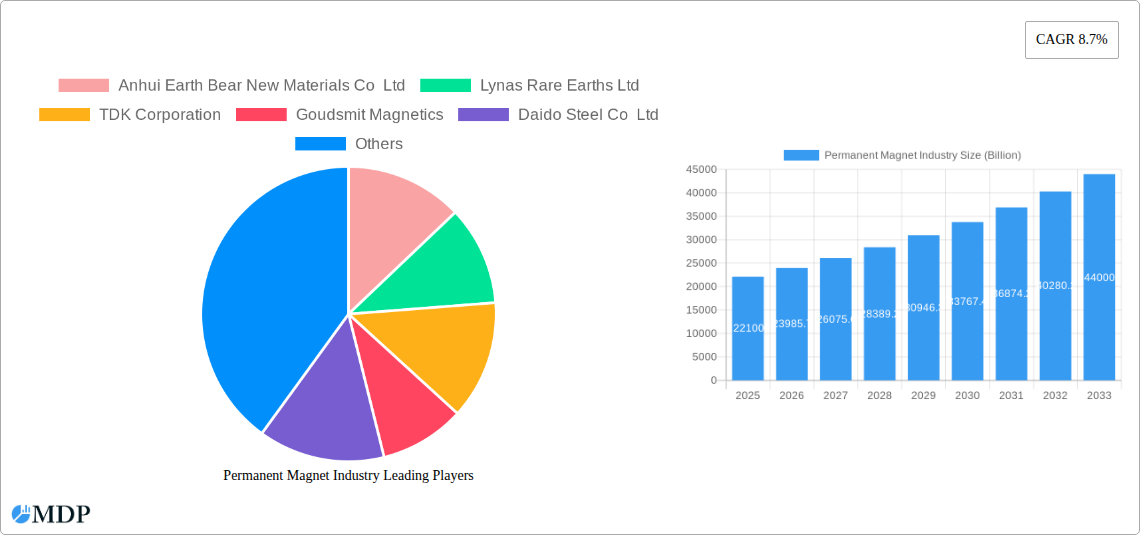
Permanent Magnet Industry Market Size (In Billion)
The segment analysis reveals a significant contribution from the automotive industry, fueled by the rising popularity of electric vehicles (EVs) and hybrid vehicles (HEVs). The electronics sector is another major contributor, with increasing demand for permanent magnets in various electronic devices. The industrial sector benefits from the use of permanent magnets in motors, sensors, and actuators. Competition in the market is intense, with major players including Anhui Earth Bear New Materials Co Ltd, Lynas Rare Earths Ltd, TDK Corporation, and others striving for technological leadership and market share. The forecast period (2025-2033) is expected to see continued growth, driven by ongoing technological advancements in magnet materials and their applications across various industries. The industry’s future success hinges on its ability to overcome challenges related to raw material sourcing, environmental concerns associated with rare earth mining, and the ongoing development of sustainable and cost-effective magnet alternatives.
Permanent Magnet Industry Company Market Share
Permanent Magnet Industry: A Comprehensive Market Report (2019-2033)
This comprehensive report provides an in-depth analysis of the global permanent magnet industry, projecting a market value exceeding $XX Billion by 2033. It offers invaluable insights for industry stakeholders, investors, and businesses seeking to navigate this dynamic sector. The report covers the historical period (2019-2024), base year (2025), and forecast period (2025-2033), delivering actionable intelligence for strategic decision-making.
Permanent Magnet Industry Market Dynamics & Concentration
The global permanent magnet market, valued at $XX Billion in 2024, is characterized by moderate concentration with several key players vying for market share. Innovation, driven by the increasing demand for energy-efficient technologies and advancements in materials science, is a significant growth catalyst. Stringent environmental regulations regarding rare earth element mining and processing are shaping industry practices, while the search for sustainable alternatives and improved recycling methods is gaining momentum. The market experiences substitution pressure from alternative technologies, however, the superior performance and cost-effectiveness of permanent magnets in numerous applications continue to solidify their position. End-user trends, especially the burgeoning electric vehicle (EV) sector, are significantly impacting market growth. Mergers and acquisitions (M&A) activities, while not exceedingly frequent, are strategic moves aimed at securing resources, expanding market reach, and accessing innovative technologies.
- Market Concentration: Moderately concentrated, with the top 5 players holding approximately xx% of the market share in 2024.
- Innovation Drivers: Advancements in material science, miniaturization technologies, and improved energy efficiency.
- Regulatory Frameworks: Increasing scrutiny on rare earth mining and environmental impact, driving sustainable practices.
- Product Substitutes: Electromagnets, but with limitations in specific applications.
- M&A Activity: A moderate number of deals (xx) were recorded between 2019 and 2024, predominantly focused on securing rare earth resources and expanding production capabilities.
- End-User Trends: Strong growth driven by the automotive and electronics sectors, particularly EVs and renewable energy technologies.
Permanent Magnet Industry Industry Trends & Analysis
The permanent magnet market exhibits robust growth, projected at a CAGR of xx% during the forecast period (2025-2033). This growth is fueled by several key factors, including the rapid expansion of the electric vehicle market and the increasing adoption of renewable energy sources such as wind turbines and solar power. Technological disruptions, particularly in the development of high-performance magnets with improved temperature stability and energy efficiency, are reshaping the competitive landscape. Consumer preferences are shifting towards sustainable and eco-friendly products, which indirectly benefit the industry due to the demand for efficient and clean energy technologies. The competitive dynamics are characterized by intense rivalry among established players, alongside the emergence of innovative startups, particularly in niche areas such as advanced material development and customized magnet solutions. Market penetration is accelerating significantly in developing economies due to expanding industrialization and infrastructure development.
Leading Markets & Segments in Permanent Magnet Industry
The Asia-Pacific region dominates the permanent magnet market, driven primarily by strong demand from China, Japan, and other rapidly industrializing economies. The automotive segment holds the largest market share within end-user industries, due to its extensive usage in electric vehicles and hybrid vehicles. Within material types, Neodymium-Iron-Boron magnets currently command the largest market share due to their superior magnetic properties.
- Dominant Region: Asia-Pacific
- Dominant End-user Industry: Automotive
- Dominant Material Type: Neodymium-Iron-Boron
Key Drivers:
- Asia-Pacific: Rapid industrialization, significant investments in renewable energy infrastructure, and a large automotive manufacturing base.
- Automotive: The escalating demand for electric and hybrid vehicles globally is driving significant growth.
- Neodymium-Iron-Boron: Superior magnetic properties, high energy density, and versatility in various applications.
Permanent Magnet Industry Product Developments
Recent product innovations focus on enhancing the performance and efficiency of permanent magnets. Developments include the creation of high-temperature magnets, improved corrosion resistance, and miniaturization capabilities. These advancements are crucial for expanding the applications of permanent magnets in demanding environments such as electric vehicles and aerospace technology. This trend is pushing the industry towards improved energy density, enhanced thermal stability, and optimized performance across various applications.
Key Drivers of Permanent Magnet Industry Growth
The industry's growth is driven by several factors. The surging demand for electric vehicles and renewable energy technologies requires high-performance permanent magnets. Technological advancements lead to improved magnet properties, enabling applications in diverse sectors. Favorable government policies and incentives promote the adoption of sustainable energy solutions, positively impacting the demand for these magnets.
Challenges in the Permanent Magnet Industry Market
The industry faces challenges, including the limited availability of rare earth elements crucial for magnet production. Supply chain disruptions and price fluctuations for these materials pose considerable risks. Increasing competition from new entrants and alternative technologies necessitates continuous innovation and cost optimization. Stringent environmental regulations add complexities to manufacturing and disposal processes, affecting costs and operational strategies.
Emerging Opportunities in Permanent Magnet Industry
Significant growth opportunities exist in developing advanced magnet materials with enhanced performance, particularly focusing on high-temperature applications and increased energy density. Strategic partnerships among companies involved in rare earth mining, magnet manufacturing, and end-user industries will be vital for securing supply chains and accelerating innovation. Expanding market penetration in emerging economies with growing industrial sectors and increasing electrification will fuel significant future growth.
Leading Players in the Permanent Magnet Industry Sector
Key Milestones in Permanent Magnet Industry Industry
September 2022: Solvay announced plans to expand its rare earths operations in La Rochelle, France, aiming to enter the European permanent magnet value chain, particularly targeting the wind power, electric vehicle, and electronics markets. This signifies a significant move towards strengthening the European supply chain for rare earth-based magnets.
July 2022: GKN Powder Metallurgy announced its entry into the permanent magnet market for electric vehicles, planning to establish a capacity to produce up to 4,000 tons of permanent magnets annually by 2024. This highlights the growing importance of the electric vehicle market as a driver of growth in the permanent magnet industry.
Strategic Outlook for Permanent Magnet Industry Market
The permanent magnet industry is poised for significant growth, driven by the continued expansion of the electric vehicle and renewable energy sectors. Strategic partnerships and investments in research and development will be crucial for unlocking the full potential of this market. Companies that prioritize sustainable sourcing of rare earth materials and invest in innovative magnet technologies will gain a competitive advantage in the long term. The focus on improving energy density, thermal stability and developing cost-effective manufacturing processes will shape the industry's trajectory.
Permanent Magnet Industry Segmentation
-
1. Material Type
- 1.1. Neodymium-Iron-Boron
- 1.2. Ferrite
- 1.3. Samarium Cobalt
- 1.4. Alnico
-
2. End-user Industry
- 2.1. Automotive
- 2.2. Electronics
- 2.3. Industrial
- 2.4. Power Generation
- 2.5. Other End-user Industries
Permanent Magnet Industry Segmentation By Geography
-
1. Asia Pacific
- 1.1. China
- 1.2. India
- 1.3. Japan
- 1.4. South Korea
- 1.5. Rest of Asia Pacific
-
2. North America
- 2.1. United States
- 2.2. Canada
- 2.3. Mexico
-
3. Europe
- 3.1. Germany
- 3.2. United Kingdom
- 3.3. France
- 3.4. Italy
- 3.5. Rest of Europe
-
4. South America
- 4.1. Brazil
- 4.2. Argentina
- 4.3. Rest of South America
-
5. Middle East and Africa
- 5.1. Saudi Arabia
- 5.2. South Africa
- 5.3. Rest of Middle East and Africa
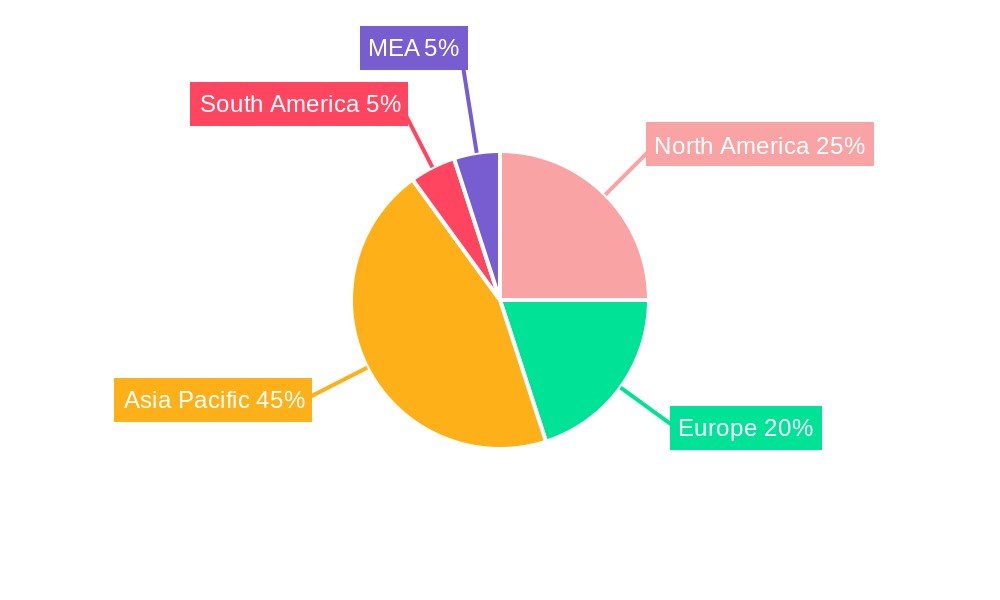
Permanent Magnet Industry Regional Market Share
Geographic Coverage of Permanent Magnet Industry
Permanent Magnet Industry REPORT HIGHLIGHTS
| Aspects | Details |
|---|---|
| Study Period | 2020-2034 |
| Base Year | 2025 |
| Estimated Year | 2026 |
| Forecast Period | 2026-2034 |
| Historical Period | 2020-2025 |
| Growth Rate | CAGR of 8.7% from 2020-2034 |
| Segmentation |
|
Table of Contents
- 1. Introduction
- 1.1. Research Scope
- 1.2. Market Segmentation
- 1.3. Research Objective
- 1.4. Definitions and Assumptions
- 2. Executive Summary
- 2.1. Market Snapshot
- 3. Market Dynamics
- 3.1. Market Drivers
- 3.2. Market Restrains
- 3.3. Market Trends
- 3.4. Market Opportunities
- 4. Market Factor Analysis
- 4.1. Porters Five Forces
- 4.1.1. Bargaining Power of Suppliers
- 4.1.2. Bargaining Power of Buyers
- 4.1.3. Threat of New Entrants
- 4.1.4. Threat of Substitutes
- 4.1.5. Competitive Rivalry
- 4.2. PESTEL analysis
- 4.3. BCG Analysis
- 4.3.1. Stars (High Growth, High Market Share)
- 4.3.2. Cash Cows (Low Growth, High Market Share)
- 4.3.3. Question Mark (High Growth, Low Market Share)
- 4.3.4. Dogs (Low Growth, Low Market Share)
- 4.4. Ansoff Matrix Analysis
- 4.5. Supply Chain Analysis
- 4.6. Regulatory Landscape
- 4.7. Current Market Potential and Opportunity Assessment (TAM–SAM–SOM Framework)
- 4.8. MDP Analyst Note
- 4.1. Porters Five Forces
- 5. Market Analysis, Insights and Forecast 2021-2033
- 5.1. Market Analysis, Insights and Forecast - by Material Type
- 5.1.1. Neodymium-Iron-Boron
- 5.1.2. Ferrite
- 5.1.3. Samarium Cobalt
- 5.1.4. Alnico
- 5.2. Market Analysis, Insights and Forecast - by End-user Industry
- 5.2.1. Automotive
- 5.2.2. Electronics
- 5.2.3. Industrial
- 5.2.4. Power Generation
- 5.2.5. Other End-user Industries
- 5.3. Market Analysis, Insights and Forecast - by Region
- 5.3.1. Asia Pacific
- 5.3.2. North America
- 5.3.3. Europe
- 5.3.4. South America
- 5.3.5. Middle East and Africa
- 5.1. Market Analysis, Insights and Forecast - by Material Type
- 6. Global Permanent Magnet Industry Analysis, Insights and Forecast, 2021-2033
- 6.1. Market Analysis, Insights and Forecast - by Material Type
- 6.1.1. Neodymium-Iron-Boron
- 6.1.2. Ferrite
- 6.1.3. Samarium Cobalt
- 6.1.4. Alnico
- 6.2. Market Analysis, Insights and Forecast - by End-user Industry
- 6.2.1. Automotive
- 6.2.2. Electronics
- 6.2.3. Industrial
- 6.2.4. Power Generation
- 6.2.5. Other End-user Industries
- 6.1. Market Analysis, Insights and Forecast - by Material Type
- 7. Asia Pacific Permanent Magnet Industry Analysis, Insights and Forecast, 2020-2032
- 7.1. Market Analysis, Insights and Forecast - by Material Type
- 7.1.1. Neodymium-Iron-Boron
- 7.1.2. Ferrite
- 7.1.3. Samarium Cobalt
- 7.1.4. Alnico
- 7.2. Market Analysis, Insights and Forecast - by End-user Industry
- 7.2.1. Automotive
- 7.2.2. Electronics
- 7.2.3. Industrial
- 7.2.4. Power Generation
- 7.2.5. Other End-user Industries
- 7.1. Market Analysis, Insights and Forecast - by Material Type
- 8. North America Permanent Magnet Industry Analysis, Insights and Forecast, 2020-2032
- 8.1. Market Analysis, Insights and Forecast - by Material Type
- 8.1.1. Neodymium-Iron-Boron
- 8.1.2. Ferrite
- 8.1.3. Samarium Cobalt
- 8.1.4. Alnico
- 8.2. Market Analysis, Insights and Forecast - by End-user Industry
- 8.2.1. Automotive
- 8.2.2. Electronics
- 8.2.3. Industrial
- 8.2.4. Power Generation
- 8.2.5. Other End-user Industries
- 8.1. Market Analysis, Insights and Forecast - by Material Type
- 9. Europe Permanent Magnet Industry Analysis, Insights and Forecast, 2020-2032
- 9.1. Market Analysis, Insights and Forecast - by Material Type
- 9.1.1. Neodymium-Iron-Boron
- 9.1.2. Ferrite
- 9.1.3. Samarium Cobalt
- 9.1.4. Alnico
- 9.2. Market Analysis, Insights and Forecast - by End-user Industry
- 9.2.1. Automotive
- 9.2.2. Electronics
- 9.2.3. Industrial
- 9.2.4. Power Generation
- 9.2.5. Other End-user Industries
- 9.1. Market Analysis, Insights and Forecast - by Material Type
- 10. South America Permanent Magnet Industry Analysis, Insights and Forecast, 2020-2032
- 10.1. Market Analysis, Insights and Forecast - by Material Type
- 10.1.1. Neodymium-Iron-Boron
- 10.1.2. Ferrite
- 10.1.3. Samarium Cobalt
- 10.1.4. Alnico
- 10.2. Market Analysis, Insights and Forecast - by End-user Industry
- 10.2.1. Automotive
- 10.2.2. Electronics
- 10.2.3. Industrial
- 10.2.4. Power Generation
- 10.2.5. Other End-user Industries
- 10.1. Market Analysis, Insights and Forecast - by Material Type
- 11. Middle East and Africa Permanent Magnet Industry Analysis, Insights and Forecast, 2020-2032
- 11.1. Market Analysis, Insights and Forecast - by Material Type
- 11.1.1. Neodymium-Iron-Boron
- 11.1.2. Ferrite
- 11.1.3. Samarium Cobalt
- 11.1.4. Alnico
- 11.2. Market Analysis, Insights and Forecast - by End-user Industry
- 11.2.1. Automotive
- 11.2.2. Electronics
- 11.2.3. Industrial
- 11.2.4. Power Generation
- 11.2.5. Other End-user Industries
- 11.1. Market Analysis, Insights and Forecast - by Material Type
- 12. Competitive Analysis
- 12.1. Company Profiles
- 12.1.1 Anhui Earth Bear New Materials Co Ltd
- 12.1.1.1. Company Overview
- 12.1.1.2. Products
- 12.1.1.3. Company Financials
- 12.1.1.4. SWOT Analysis
- 12.1.2 Lynas Rare Earths Ltd
- 12.1.2.1. Company Overview
- 12.1.2.2. Products
- 12.1.2.3. Company Financials
- 12.1.2.4. SWOT Analysis
- 12.1.3 TDK Corporation
- 12.1.3.1. Company Overview
- 12.1.3.2. Products
- 12.1.3.3. Company Financials
- 12.1.3.4. SWOT Analysis
- 12.1.4 Goudsmit Magnetics
- 12.1.4.1. Company Overview
- 12.1.4.2. Products
- 12.1.4.3. Company Financials
- 12.1.4.4. SWOT Analysis
- 12.1.5 Daido Steel Co Ltd
- 12.1.5.1. Company Overview
- 12.1.5.2. Products
- 12.1.5.3. Company Financials
- 12.1.5.4. SWOT Analysis
- 12.1.6 Galaxymagnets
- 12.1.6.1. Company Overview
- 12.1.6.2. Products
- 12.1.6.3. Company Financials
- 12.1.6.4. SWOT Analysis
- 12.1.7 Hitachi Metals Ltd
- 12.1.7.1. Company Overview
- 12.1.7.2. Products
- 12.1.7.3. Company Financials
- 12.1.7.4. SWOT Analysis
- 12.1.8 Arnold Magnetic Technologies
- 12.1.8.1. Company Overview
- 12.1.8.2. Products
- 12.1.8.3. Company Financials
- 12.1.8.4. SWOT Analysis
- 12.1.9 Shin-Etsu Chemical Co Ltd
- 12.1.9.1. Company Overview
- 12.1.9.2. Products
- 12.1.9.3. Company Financials
- 12.1.9.4. SWOT Analysis
- 12.1.10 GKN Powder Metallurgy
- 12.1.10.1. Company Overview
- 12.1.10.2. Products
- 12.1.10.3. Company Financials
- 12.1.10.4. SWOT Analysis
- 12.1.1 Anhui Earth Bear New Materials Co Ltd
- 12.2. Market Entropy
- 12.2.1 Company's Key Areas Served
- 12.2.2 Recent Developments
- 12.3. Company Market Share Analysis 2025
- 12.3.1 Top 5 Companies Market Share Analysis
- 12.3.2 Top 3 Companies Market Share Analysis
- 12.4. List of Potential Customers
- 13. Research Methodology
List of Figures
- Figure 1: Global Permanent Magnet Industry Revenue Breakdown (Billion, %) by Region 2025 & 2033
- Figure 2: Global Permanent Magnet Industry Volume Breakdown (K Tons, %) by Region 2025 & 2033
- Figure 3: Asia Pacific Permanent Magnet Industry Revenue (Billion), by Material Type 2025 & 2033
- Figure 4: Asia Pacific Permanent Magnet Industry Volume (K Tons), by Material Type 2025 & 2033
- Figure 5: Asia Pacific Permanent Magnet Industry Revenue Share (%), by Material Type 2025 & 2033
- Figure 6: Asia Pacific Permanent Magnet Industry Volume Share (%), by Material Type 2025 & 2033
- Figure 7: Asia Pacific Permanent Magnet Industry Revenue (Billion), by End-user Industry 2025 & 2033
- Figure 8: Asia Pacific Permanent Magnet Industry Volume (K Tons), by End-user Industry 2025 & 2033
- Figure 9: Asia Pacific Permanent Magnet Industry Revenue Share (%), by End-user Industry 2025 & 2033
- Figure 10: Asia Pacific Permanent Magnet Industry Volume Share (%), by End-user Industry 2025 & 2033
- Figure 11: Asia Pacific Permanent Magnet Industry Revenue (Billion), by Country 2025 & 2033
- Figure 12: Asia Pacific Permanent Magnet Industry Volume (K Tons), by Country 2025 & 2033
- Figure 13: Asia Pacific Permanent Magnet Industry Revenue Share (%), by Country 2025 & 2033
- Figure 14: Asia Pacific Permanent Magnet Industry Volume Share (%), by Country 2025 & 2033
- Figure 15: North America Permanent Magnet Industry Revenue (Billion), by Material Type 2025 & 2033
- Figure 16: North America Permanent Magnet Industry Volume (K Tons), by Material Type 2025 & 2033
- Figure 17: North America Permanent Magnet Industry Revenue Share (%), by Material Type 2025 & 2033
- Figure 18: North America Permanent Magnet Industry Volume Share (%), by Material Type 2025 & 2033
- Figure 19: North America Permanent Magnet Industry Revenue (Billion), by End-user Industry 2025 & 2033
- Figure 20: North America Permanent Magnet Industry Volume (K Tons), by End-user Industry 2025 & 2033
- Figure 21: North America Permanent Magnet Industry Revenue Share (%), by End-user Industry 2025 & 2033
- Figure 22: North America Permanent Magnet Industry Volume Share (%), by End-user Industry 2025 & 2033
- Figure 23: North America Permanent Magnet Industry Revenue (Billion), by Country 2025 & 2033
- Figure 24: North America Permanent Magnet Industry Volume (K Tons), by Country 2025 & 2033
- Figure 25: North America Permanent Magnet Industry Revenue Share (%), by Country 2025 & 2033
- Figure 26: North America Permanent Magnet Industry Volume Share (%), by Country 2025 & 2033
- Figure 27: Europe Permanent Magnet Industry Revenue (Billion), by Material Type 2025 & 2033
- Figure 28: Europe Permanent Magnet Industry Volume (K Tons), by Material Type 2025 & 2033
- Figure 29: Europe Permanent Magnet Industry Revenue Share (%), by Material Type 2025 & 2033
- Figure 30: Europe Permanent Magnet Industry Volume Share (%), by Material Type 2025 & 2033
- Figure 31: Europe Permanent Magnet Industry Revenue (Billion), by End-user Industry 2025 & 2033
- Figure 32: Europe Permanent Magnet Industry Volume (K Tons), by End-user Industry 2025 & 2033
- Figure 33: Europe Permanent Magnet Industry Revenue Share (%), by End-user Industry 2025 & 2033
- Figure 34: Europe Permanent Magnet Industry Volume Share (%), by End-user Industry 2025 & 2033
- Figure 35: Europe Permanent Magnet Industry Revenue (Billion), by Country 2025 & 2033
- Figure 36: Europe Permanent Magnet Industry Volume (K Tons), by Country 2025 & 2033
- Figure 37: Europe Permanent Magnet Industry Revenue Share (%), by Country 2025 & 2033
- Figure 38: Europe Permanent Magnet Industry Volume Share (%), by Country 2025 & 2033
- Figure 39: South America Permanent Magnet Industry Revenue (Billion), by Material Type 2025 & 2033
- Figure 40: South America Permanent Magnet Industry Volume (K Tons), by Material Type 2025 & 2033
- Figure 41: South America Permanent Magnet Industry Revenue Share (%), by Material Type 2025 & 2033
- Figure 42: South America Permanent Magnet Industry Volume Share (%), by Material Type 2025 & 2033
- Figure 43: South America Permanent Magnet Industry Revenue (Billion), by End-user Industry 2025 & 2033
- Figure 44: South America Permanent Magnet Industry Volume (K Tons), by End-user Industry 2025 & 2033
- Figure 45: South America Permanent Magnet Industry Revenue Share (%), by End-user Industry 2025 & 2033
- Figure 46: South America Permanent Magnet Industry Volume Share (%), by End-user Industry 2025 & 2033
- Figure 47: South America Permanent Magnet Industry Revenue (Billion), by Country 2025 & 2033
- Figure 48: South America Permanent Magnet Industry Volume (K Tons), by Country 2025 & 2033
- Figure 49: South America Permanent Magnet Industry Revenue Share (%), by Country 2025 & 2033
- Figure 50: South America Permanent Magnet Industry Volume Share (%), by Country 2025 & 2033
- Figure 51: Middle East and Africa Permanent Magnet Industry Revenue (Billion), by Material Type 2025 & 2033
- Figure 52: Middle East and Africa Permanent Magnet Industry Volume (K Tons), by Material Type 2025 & 2033
- Figure 53: Middle East and Africa Permanent Magnet Industry Revenue Share (%), by Material Type 2025 & 2033
- Figure 54: Middle East and Africa Permanent Magnet Industry Volume Share (%), by Material Type 2025 & 2033
- Figure 55: Middle East and Africa Permanent Magnet Industry Revenue (Billion), by End-user Industry 2025 & 2033
- Figure 56: Middle East and Africa Permanent Magnet Industry Volume (K Tons), by End-user Industry 2025 & 2033
- Figure 57: Middle East and Africa Permanent Magnet Industry Revenue Share (%), by End-user Industry 2025 & 2033
- Figure 58: Middle East and Africa Permanent Magnet Industry Volume Share (%), by End-user Industry 2025 & 2033
- Figure 59: Middle East and Africa Permanent Magnet Industry Revenue (Billion), by Country 2025 & 2033
- Figure 60: Middle East and Africa Permanent Magnet Industry Volume (K Tons), by Country 2025 & 2033
- Figure 61: Middle East and Africa Permanent Magnet Industry Revenue Share (%), by Country 2025 & 2033
- Figure 62: Middle East and Africa Permanent Magnet Industry Volume Share (%), by Country 2025 & 2033
List of Tables
- Table 1: Global Permanent Magnet Industry Revenue Billion Forecast, by Material Type 2020 & 2033
- Table 2: Global Permanent Magnet Industry Volume K Tons Forecast, by Material Type 2020 & 2033
- Table 3: Global Permanent Magnet Industry Revenue Billion Forecast, by End-user Industry 2020 & 2033
- Table 4: Global Permanent Magnet Industry Volume K Tons Forecast, by End-user Industry 2020 & 2033
- Table 5: Global Permanent Magnet Industry Revenue Billion Forecast, by Region 2020 & 2033
- Table 6: Global Permanent Magnet Industry Volume K Tons Forecast, by Region 2020 & 2033
- Table 7: Global Permanent Magnet Industry Revenue Billion Forecast, by Material Type 2020 & 2033
- Table 8: Global Permanent Magnet Industry Volume K Tons Forecast, by Material Type 2020 & 2033
- Table 9: Global Permanent Magnet Industry Revenue Billion Forecast, by End-user Industry 2020 & 2033
- Table 10: Global Permanent Magnet Industry Volume K Tons Forecast, by End-user Industry 2020 & 2033
- Table 11: Global Permanent Magnet Industry Revenue Billion Forecast, by Country 2020 & 2033
- Table 12: Global Permanent Magnet Industry Volume K Tons Forecast, by Country 2020 & 2033
- Table 13: China Permanent Magnet Industry Revenue (Billion) Forecast, by Application 2020 & 2033
- Table 14: China Permanent Magnet Industry Volume (K Tons) Forecast, by Application 2020 & 2033
- Table 15: India Permanent Magnet Industry Revenue (Billion) Forecast, by Application 2020 & 2033
- Table 16: India Permanent Magnet Industry Volume (K Tons) Forecast, by Application 2020 & 2033
- Table 17: Japan Permanent Magnet Industry Revenue (Billion) Forecast, by Application 2020 & 2033
- Table 18: Japan Permanent Magnet Industry Volume (K Tons) Forecast, by Application 2020 & 2033
- Table 19: South Korea Permanent Magnet Industry Revenue (Billion) Forecast, by Application 2020 & 2033
- Table 20: South Korea Permanent Magnet Industry Volume (K Tons) Forecast, by Application 2020 & 2033
- Table 21: Rest of Asia Pacific Permanent Magnet Industry Revenue (Billion) Forecast, by Application 2020 & 2033
- Table 22: Rest of Asia Pacific Permanent Magnet Industry Volume (K Tons) Forecast, by Application 2020 & 2033
- Table 23: Global Permanent Magnet Industry Revenue Billion Forecast, by Material Type 2020 & 2033
- Table 24: Global Permanent Magnet Industry Volume K Tons Forecast, by Material Type 2020 & 2033
- Table 25: Global Permanent Magnet Industry Revenue Billion Forecast, by End-user Industry 2020 & 2033
- Table 26: Global Permanent Magnet Industry Volume K Tons Forecast, by End-user Industry 2020 & 2033
- Table 27: Global Permanent Magnet Industry Revenue Billion Forecast, by Country 2020 & 2033
- Table 28: Global Permanent Magnet Industry Volume K Tons Forecast, by Country 2020 & 2033
- Table 29: United States Permanent Magnet Industry Revenue (Billion) Forecast, by Application 2020 & 2033
- Table 30: United States Permanent Magnet Industry Volume (K Tons) Forecast, by Application 2020 & 2033
- Table 31: Canada Permanent Magnet Industry Revenue (Billion) Forecast, by Application 2020 & 2033
- Table 32: Canada Permanent Magnet Industry Volume (K Tons) Forecast, by Application 2020 & 2033
- Table 33: Mexico Permanent Magnet Industry Revenue (Billion) Forecast, by Application 2020 & 2033
- Table 34: Mexico Permanent Magnet Industry Volume (K Tons) Forecast, by Application 2020 & 2033
- Table 35: Global Permanent Magnet Industry Revenue Billion Forecast, by Material Type 2020 & 2033
- Table 36: Global Permanent Magnet Industry Volume K Tons Forecast, by Material Type 2020 & 2033
- Table 37: Global Permanent Magnet Industry Revenue Billion Forecast, by End-user Industry 2020 & 2033
- Table 38: Global Permanent Magnet Industry Volume K Tons Forecast, by End-user Industry 2020 & 2033
- Table 39: Global Permanent Magnet Industry Revenue Billion Forecast, by Country 2020 & 2033
- Table 40: Global Permanent Magnet Industry Volume K Tons Forecast, by Country 2020 & 2033
- Table 41: Germany Permanent Magnet Industry Revenue (Billion) Forecast, by Application 2020 & 2033
- Table 42: Germany Permanent Magnet Industry Volume (K Tons) Forecast, by Application 2020 & 2033
- Table 43: United Kingdom Permanent Magnet Industry Revenue (Billion) Forecast, by Application 2020 & 2033
- Table 44: United Kingdom Permanent Magnet Industry Volume (K Tons) Forecast, by Application 2020 & 2033
- Table 45: France Permanent Magnet Industry Revenue (Billion) Forecast, by Application 2020 & 2033
- Table 46: France Permanent Magnet Industry Volume (K Tons) Forecast, by Application 2020 & 2033
- Table 47: Italy Permanent Magnet Industry Revenue (Billion) Forecast, by Application 2020 & 2033
- Table 48: Italy Permanent Magnet Industry Volume (K Tons) Forecast, by Application 2020 & 2033
- Table 49: Rest of Europe Permanent Magnet Industry Revenue (Billion) Forecast, by Application 2020 & 2033
- Table 50: Rest of Europe Permanent Magnet Industry Volume (K Tons) Forecast, by Application 2020 & 2033
- Table 51: Global Permanent Magnet Industry Revenue Billion Forecast, by Material Type 2020 & 2033
- Table 52: Global Permanent Magnet Industry Volume K Tons Forecast, by Material Type 2020 & 2033
- Table 53: Global Permanent Magnet Industry Revenue Billion Forecast, by End-user Industry 2020 & 2033
- Table 54: Global Permanent Magnet Industry Volume K Tons Forecast, by End-user Industry 2020 & 2033
- Table 55: Global Permanent Magnet Industry Revenue Billion Forecast, by Country 2020 & 2033
- Table 56: Global Permanent Magnet Industry Volume K Tons Forecast, by Country 2020 & 2033
- Table 57: Brazil Permanent Magnet Industry Revenue (Billion) Forecast, by Application 2020 & 2033
- Table 58: Brazil Permanent Magnet Industry Volume (K Tons) Forecast, by Application 2020 & 2033
- Table 59: Argentina Permanent Magnet Industry Revenue (Billion) Forecast, by Application 2020 & 2033
- Table 60: Argentina Permanent Magnet Industry Volume (K Tons) Forecast, by Application 2020 & 2033
- Table 61: Rest of South America Permanent Magnet Industry Revenue (Billion) Forecast, by Application 2020 & 2033
- Table 62: Rest of South America Permanent Magnet Industry Volume (K Tons) Forecast, by Application 2020 & 2033
- Table 63: Global Permanent Magnet Industry Revenue Billion Forecast, by Material Type 2020 & 2033
- Table 64: Global Permanent Magnet Industry Volume K Tons Forecast, by Material Type 2020 & 2033
- Table 65: Global Permanent Magnet Industry Revenue Billion Forecast, by End-user Industry 2020 & 2033
- Table 66: Global Permanent Magnet Industry Volume K Tons Forecast, by End-user Industry 2020 & 2033
- Table 67: Global Permanent Magnet Industry Revenue Billion Forecast, by Country 2020 & 2033
- Table 68: Global Permanent Magnet Industry Volume K Tons Forecast, by Country 2020 & 2033
- Table 69: Saudi Arabia Permanent Magnet Industry Revenue (Billion) Forecast, by Application 2020 & 2033
- Table 70: Saudi Arabia Permanent Magnet Industry Volume (K Tons) Forecast, by Application 2020 & 2033
- Table 71: South Africa Permanent Magnet Industry Revenue (Billion) Forecast, by Application 2020 & 2033
- Table 72: South Africa Permanent Magnet Industry Volume (K Tons) Forecast, by Application 2020 & 2033
- Table 73: Rest of Middle East and Africa Permanent Magnet Industry Revenue (Billion) Forecast, by Application 2020 & 2033
- Table 74: Rest of Middle East and Africa Permanent Magnet Industry Volume (K Tons) Forecast, by Application 2020 & 2033
Frequently Asked Questions
1. What is the projected Compound Annual Growth Rate (CAGR) of the Permanent Magnet Industry?
The projected CAGR is approximately 8.7%.
2. Which companies are prominent players in the Permanent Magnet Industry?
Key companies in the market include Anhui Earth Bear New Materials Co Ltd, Lynas Rare Earths Ltd, TDK Corporation, Goudsmit Magnetics, Daido Steel Co Ltd, Galaxymagnets, Hitachi Metals Ltd, Arnold Magnetic Technologies, Shin-Etsu Chemical Co Ltd, GKN Powder Metallurgy.
3. What are the main segments of the Permanent Magnet Industry?
The market segments include Material Type, End-user Industry.
4. Can you provide details about the market size?
The market size is estimated to be USD 22.1 Billion as of 2022.
5. What are some drivers contributing to market growth?
Increasing Electro-mechanical Applications; Other Drivers.
6. What are the notable trends driving market growth?
Growing Demand from Electronics Industry.
7. Are there any restraints impacting market growth?
Competition from Substitutes; Other Restraints.
8. Can you provide examples of recent developments in the market?
September 2022: Solvay announced plans to expand its rare earths operations in La Rochelle, France to enter the value chain for rare earths permanent magnets in Europe and serve customers in the wind power, electric vehicles, and electronics markets.
9. What pricing options are available for accessing the report?
Pricing options include single-user, multi-user, and enterprise licenses priced at USD 4750, USD 5250, and USD 8750 respectively.
10. Is the market size provided in terms of value or volume?
The market size is provided in terms of value, measured in Billion and volume, measured in K Tons.
11. Are there any specific market keywords associated with the report?
Yes, the market keyword associated with the report is "Permanent Magnet Industry," which aids in identifying and referencing the specific market segment covered.
12. How do I determine which pricing option suits my needs best?
The pricing options vary based on user requirements and access needs. Individual users may opt for single-user licenses, while businesses requiring broader access may choose multi-user or enterprise licenses for cost-effective access to the report.
13. Are there any additional resources or data provided in the Permanent Magnet Industry report?
While the report offers comprehensive insights, it's advisable to review the specific contents or supplementary materials provided to ascertain if additional resources or data are available.
14. How can I stay updated on further developments or reports in the Permanent Magnet Industry?
To stay informed about further developments, trends, and reports in the Permanent Magnet Industry, consider subscribing to industry newsletters, following relevant companies and organizations, or regularly checking reputable industry news sources and publications.
Methodology
Step 1 - Identification of Relevant Samples Size from Population Database


Step 2 - Approaches for Defining Global Market Size (Value, Volume* & Price*)

Note*: In applicable scenarios
Step 3 - Data Sources
Primary Research
- Web Analytics
- Survey Reports
- Research Institute
- Latest Research Reports
- Opinion Leaders
Secondary Research
- Annual Reports
- White Paper
- Latest Press Release
- Industry Association
- Paid Database
- Investor Presentations

Step 4 - Data Triangulation
Involves using different sources of information in order to increase the validity of a study
These sources are likely to be stakeholders in a program - participants, other researchers, program staff, other community members, and so on.
Then we put all data in single framework & apply various statistical tools to find out the dynamic on the market.
During the analysis stage, feedback from the stakeholder groups would be compared to determine areas of agreement as well as areas of divergence