

Key Insights
The Non-Halogenated Flame Retardants (NHFR) Chemicals market is demonstrating significant expansion, propelled by increasingly stringent regulations targeting halogenated flame retardants due to their adverse environmental and health implications. This market, projected for substantial growth from a base year of 2025 with an estimated market size of $10.59 billion, is expected to witness a Compound Annual Growth Rate (CAGR) of 12.02% through 2033. Key growth drivers include escalating demand across various end-use industries, notably in electrical and electronics where fire safety is critical. The proliferation of sustainable construction and the accelerated adoption of electric vehicles are further stimulating market expansion. Currently, the inorganic segment leads in market share over the organic segment, attributed to established applications and cost efficiencies in specific industries. Among boron compounds, phosphorus-based NHFRs remain prevalent, though nitrogen-based alternatives are gaining traction for their enhanced performance characteristics in niche applications. Leading industry players, including ICL, DIC Corporation, and Clariant, are making substantial investments in research and development to pioneer innovative and high-performance NHFR solutions, fostering market competitiveness and technological advancement. Geographic growth is anticipated to be led by North America and the Asia-Pacific region.
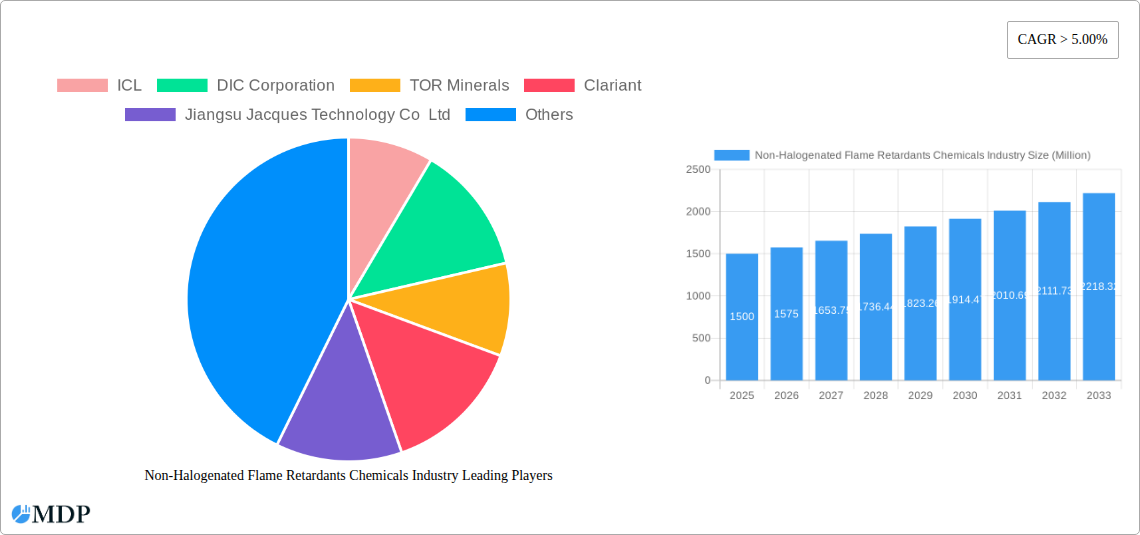
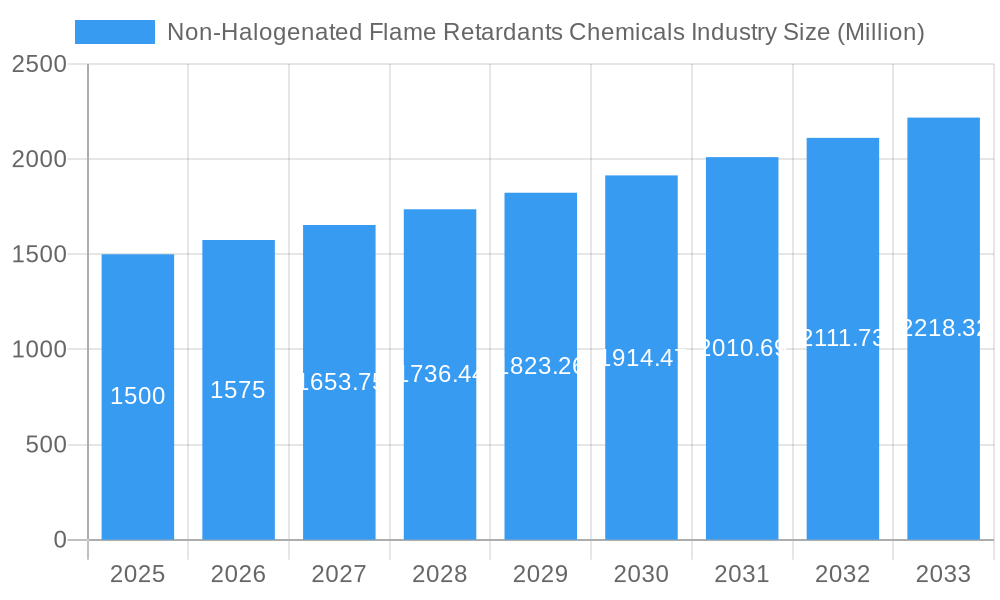
Non-Halogenated Flame Retardants Chemicals Industry Market Size (In Billion)
While the market exhibits a robust growth trajectory, certain challenges persist. The comparatively higher cost of select NHFRs versus their halogenated counterparts may impede widespread adoption, particularly in cost-sensitive sectors. Additionally, the efficacy of certain NHFRs can fluctuate based on application and material, necessitating precise selection and formulation. Nevertheless, ongoing R&D initiatives aimed at enhancing efficiency and cost-effectiveness, combined with intensified regulatory pressure on halogenated alternatives, indicate a future of sustained and considerable growth for the NHFR market. The continuous development of novel formulations tailored to specific application requirements will be instrumental in shaping future market dynamics and driving broader adoption across diverse sectors.
Non-Halogenated Flame Retardants Chemicals Industry Company Market Share
Non-Halogenated Flame Retardants Chemicals Industry Market Report: 2019-2033
This comprehensive report provides an in-depth analysis of the Non-Halogenated Flame Retardants Chemicals industry, offering invaluable insights for stakeholders, investors, and industry professionals. Covering the period from 2019 to 2033, with a focus on 2025, this report examines market dynamics, leading players, technological advancements, and future growth potential. The market is valued at xx Million in 2025 and is projected to reach xx Million by 2033, exhibiting a CAGR of xx% during the forecast period (2025-2033).
Non-Halogenated Flame Retardants Chemicals Industry Market Dynamics & Concentration
The Non-Halogenated Flame Retardants Chemicals market is characterized by moderate concentration, with key players such as ICL, DIC Corporation, and Clariant holding significant market share. The market is driven by stringent regulations against halogenated flame retardants, increasing demand from key end-use sectors like electronics and construction, and continuous innovation in material science leading to the development of more effective and sustainable alternatives. However, price fluctuations in raw materials and the emergence of substitute materials pose challenges. Mergers and acquisitions (M&A) activity has been moderate in recent years, with approximately xx M&A deals recorded between 2019 and 2024. This activity is expected to increase as companies seek to expand their product portfolios and geographical reach. Market share distribution among the top 5 players in 2025 is estimated to be around xx%, indicating a somewhat fragmented landscape despite the presence of established industry giants.
- Innovation Drivers: Development of high-performance, eco-friendly flame retardants.
- Regulatory Frameworks: Stringent regulations banning or restricting halogenated flame retardants in various applications.
- Product Substitutes: Competition from alternative materials with inherent flame-retardant properties.
- End-User Trends: Growing demand from the electronics, construction, and transportation sectors.
- M&A Activity: Consolidation through mergers and acquisitions to enhance market presence and expand product portfolios.
Non-Halogenated Flame Retardants Chemicals Industry Industry Trends & Analysis
The Non-Halogenated Flame Retardants Chemicals market is experiencing robust growth, driven by the increasing adoption of flame-retardant materials across diverse industries. The growing awareness of environmental concerns and health risks associated with halogenated flame retardants is a primary factor fueling this market expansion. Technological advancements, such as the development of nano-based flame retardants and improved phosphorus-based compounds, are enhancing the performance and efficiency of these materials. Furthermore, the increasing demand for energy-efficient and durable products across sectors like electronics and construction is driving the market forward. The market witnessed a notable increase in market penetration in the electrical and electronics sector during the historical period (2019-2024), expanding from xx% to xx% in 2024, reflecting the crucial role of these chemicals in ensuring product safety. This trend is expected to continue with a projected CAGR of xx% for the forecast period. Competitive dynamics are shaped by innovation, pricing strategies, and the ability to meet stringent regulatory requirements.
Leading Markets & Segments in Non-Halogenated Flame Retardants Chemicals Industry
The Asia-Pacific region dominates the Non-Halogenated Flame Retardants Chemicals market, driven by rapid industrialization, burgeoning construction activity, and a substantial electronics manufacturing base. Within this region, China and India are key contributors to market growth. The Inorganic segment currently holds the largest market share due to its cost-effectiveness and established applications.
Key Drivers for Asia-Pacific Dominance:
- Rapid economic growth and infrastructure development.
- Strong demand from the electronics and construction industries.
- Favorable government policies supporting industrial expansion.
Segment Analysis:
- Type: Inorganic flame retardants hold the largest market share, followed by organic and boron compounds. The "other types" segment is expected to witness significant growth due to innovation in novel chemistries.
- End-user Industry: The electrical and electronics sector is the leading consumer, driven by the growing demand for safer and more reliable electronic devices. The buildings and construction industry is also a significant contributor, followed by transportation and textiles.
The detailed analysis reveals the dominance of specific countries and segments and will provide an understanding of underlying dynamics and future trends for each.
Non-Halogenated Flame Retardants Chemicals Industry Product Developments
Recent product innovations have focused on developing high-performance, eco-friendly flame retardants with enhanced thermal stability and reduced toxicity. This includes advancements in phosphorus-based compounds, nano-scale materials, and synergistic blends. These innovations offer improved flame-retardant properties while mitigating environmental concerns. The market is witnessing a shift towards more sustainable and efficient solutions, aligning with global environmental regulations and consumer preferences for greener products.
Key Drivers of Non-Halogenated Flame Retardants Chemicals Industry Growth
The growth of the Non-Halogenated Flame Retardants Chemicals market is primarily fueled by stringent regulations restricting or banning halogenated flame retardants, the rising demand for safer products across various industries, and ongoing technological advancements leading to improved material properties. Economic factors, such as increased disposable incomes and infrastructure spending, further contribute to market expansion. Examples include the EU's Restriction of Hazardous Substances (RoHS) Directive and similar regulations in other regions.
Challenges in the Non-Halogenated Flame Retardants Chemicals Industry Market
The industry faces challenges including fluctuations in raw material prices, stringent regulatory compliance requirements, and intense competition among established players and new entrants. Supply chain disruptions can also significantly impact production and pricing. These factors can result in cost increases and potential delays in product delivery, impacting profitability.
Emerging Opportunities in Non-Halogenated Flame Retardants Chemicals Industry
Emerging opportunities lie in the development of novel flame retardant materials with improved performance and sustainability characteristics. Strategic partnerships and collaborations are emerging to expand market reach and leverage technological advancements. Furthermore, exploring new applications in emerging sectors like renewable energy and electric vehicles offers significant growth potential.
Leading Players in the Non-Halogenated Flame Retardants Chemicals Industry Sector
- ICL
- DIC Corporation
- TOR Minerals
- Clariant
- Jiangsu Jacques Technology Co Ltd
- MPI Chemie BV
- Italmatch Chemicals SpA
- LANXESS
- Nippon Carbide Industries Co Inc (Sanwa Chemical Industry Co Ltd)
- BASF SE
- Rin Kagaku Kogyo Co Ltd
- Shandong Brother Sci &Tech Co Ltd
- Nabaltec AG
- Thor
- Eti Maden
- Apexical Inc
- NYACOL Nano Technologies Inc
- Huber Engineered Materials
- Daihachi Chemical Industry Co Ltd
Key Milestones in Non-Halogenated Flame Retardants Chemicals Industry Industry
- 2020: Introduction of a novel phosphorus-based flame retardant by ICL with enhanced thermal stability.
- 2022: Acquisition of a smaller flame retardant manufacturer by Clariant, expanding its product portfolio.
- 2023: Publication of new environmental regulations in the EU impacting the use of certain flame retardant chemicals.
- 2024: Launch of a new generation of nano-based flame retardants by a leading Asian manufacturer. (Specifics will be detailed within the full report).
Strategic Outlook for Non-Halogenated Flame Retardants Chemicals Industry Market
The Non-Halogenated Flame Retardants Chemicals market is poised for sustained growth, driven by ongoing technological innovation, stringent environmental regulations, and increasing demand from key end-user sectors. Strategic partnerships, acquisitions, and expansion into new geographical markets will be key drivers of future success. Focus on developing sustainable and high-performance solutions will be crucial for companies seeking to maintain a competitive edge in this evolving market landscape.
Non-Halogenated Flame Retardants Chemicals Industry Segmentation
-
1. Type
-
1.1. Inorganic
- 1.1.1. Aluminum Hydroxide
- 1.1.2. Magnesium Hydroxide
- 1.1.3. Boron Compounds
- 1.2. Phosphorus
- 1.3. Nitrogen
- 1.4. Other Types
-
1.1. Inorganic
-
2. End-user Industry
- 2.1. Electrical and Electronics
- 2.2. Buildings and Construction
- 2.3. Transportation
- 2.4. Textiles and Furniture
Non-Halogenated Flame Retardants Chemicals Industry Segmentation By Geography
-
1. Asia Pacific
- 1.1. China
- 1.2. India
- 1.3. Japan
- 1.4. South Korea
- 1.5. Rest of Asia Pacific
-
2. North America
- 2.1. United States
- 2.2. Canada
- 2.3. Mexico
-
3. Europe
- 3.1. Germany
- 3.2. United Kingdom
- 3.3. Italy
- 3.4. France
- 3.5. Rest of Europe
-
4. South America
- 4.1. Brazil
- 4.2. Argentina
- 4.3. Rest of South America
-
5. Middle East and Africa
- 5.1. Saudi Arabia
- 5.2. South Africa
- 5.3. Rest of Middle East and Africa
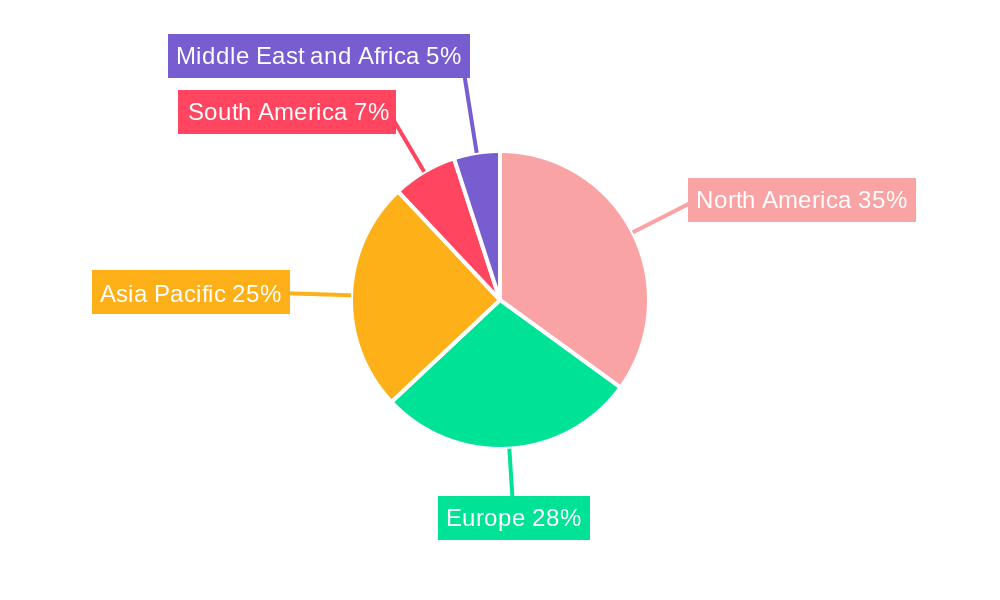
Non-Halogenated Flame Retardants Chemicals Industry Regional Market Share
Geographic Coverage of Non-Halogenated Flame Retardants Chemicals Industry
Non-Halogenated Flame Retardants Chemicals Industry REPORT HIGHLIGHTS
| Aspects | Details |
|---|---|
| Study Period | 2020-2034 |
| Base Year | 2025 |
| Estimated Year | 2026 |
| Forecast Period | 2026-2034 |
| Historical Period | 2020-2025 |
| Growth Rate | CAGR of 12.02% from 2020-2034 |
| Segmentation |
|
Table of Contents
- 1. Introduction
- 1.1. Research Scope
- 1.2. Market Segmentation
- 1.3. Research Objective
- 1.4. Definitions and Assumptions
- 2. Executive Summary
- 2.1. Market Snapshot
- 3. Market Dynamics
- 3.1. Market Drivers
- 3.2. Market Restrains
- 3.3. Market Trends
- 3.4. Market Opportunities
- 4. Market Factor Analysis
- 4.1. Porters Five Forces
- 4.1.1. Bargaining Power of Suppliers
- 4.1.2. Bargaining Power of Buyers
- 4.1.3. Threat of New Entrants
- 4.1.4. Threat of Substitutes
- 4.1.5. Competitive Rivalry
- 4.2. PESTEL analysis
- 4.3. BCG Analysis
- 4.3.1. Stars (High Growth, High Market Share)
- 4.3.2. Cash Cows (Low Growth, High Market Share)
- 4.3.3. Question Mark (High Growth, Low Market Share)
- 4.3.4. Dogs (Low Growth, Low Market Share)
- 4.4. Ansoff Matrix Analysis
- 4.5. Supply Chain Analysis
- 4.6. Regulatory Landscape
- 4.7. Current Market Potential and Opportunity Assessment (TAM–SAM–SOM Framework)
- 4.8. MDP Analyst Note
- 4.1. Porters Five Forces
- 5. Market Analysis, Insights and Forecast 2021-2033
- 5.1. Market Analysis, Insights and Forecast - by Type
- 5.1.1. Inorganic
- 5.1.1.1. Aluminum Hydroxide
- 5.1.1.2. Magnesium Hydroxide
- 5.1.1.3. Boron Compounds
- 5.1.2. Phosphorus
- 5.1.3. Nitrogen
- 5.1.4. Other Types
- 5.1.1. Inorganic
- 5.2. Market Analysis, Insights and Forecast - by End-user Industry
- 5.2.1. Electrical and Electronics
- 5.2.2. Buildings and Construction
- 5.2.3. Transportation
- 5.2.4. Textiles and Furniture
- 5.3. Market Analysis, Insights and Forecast - by Region
- 5.3.1. Asia Pacific
- 5.3.2. North America
- 5.3.3. Europe
- 5.3.4. South America
- 5.3.5. Middle East and Africa
- 5.1. Market Analysis, Insights and Forecast - by Type
- 6. Global Non-Halogenated Flame Retardants Chemicals Industry Analysis, Insights and Forecast, 2021-2033
- 6.1. Market Analysis, Insights and Forecast - by Type
- 6.1.1. Inorganic
- 6.1.1.1. Aluminum Hydroxide
- 6.1.1.2. Magnesium Hydroxide
- 6.1.1.3. Boron Compounds
- 6.1.2. Phosphorus
- 6.1.3. Nitrogen
- 6.1.4. Other Types
- 6.1.1. Inorganic
- 6.2. Market Analysis, Insights and Forecast - by End-user Industry
- 6.2.1. Electrical and Electronics
- 6.2.2. Buildings and Construction
- 6.2.3. Transportation
- 6.2.4. Textiles and Furniture
- 6.1. Market Analysis, Insights and Forecast - by Type
- 7. Asia Pacific Non-Halogenated Flame Retardants Chemicals Industry Analysis, Insights and Forecast, 2020-2032
- 7.1. Market Analysis, Insights and Forecast - by Type
- 7.1.1. Inorganic
- 7.1.1.1. Aluminum Hydroxide
- 7.1.1.2. Magnesium Hydroxide
- 7.1.1.3. Boron Compounds
- 7.1.2. Phosphorus
- 7.1.3. Nitrogen
- 7.1.4. Other Types
- 7.1.1. Inorganic
- 7.2. Market Analysis, Insights and Forecast - by End-user Industry
- 7.2.1. Electrical and Electronics
- 7.2.2. Buildings and Construction
- 7.2.3. Transportation
- 7.2.4. Textiles and Furniture
- 7.1. Market Analysis, Insights and Forecast - by Type
- 8. North America Non-Halogenated Flame Retardants Chemicals Industry Analysis, Insights and Forecast, 2020-2032
- 8.1. Market Analysis, Insights and Forecast - by Type
- 8.1.1. Inorganic
- 8.1.1.1. Aluminum Hydroxide
- 8.1.1.2. Magnesium Hydroxide
- 8.1.1.3. Boron Compounds
- 8.1.2. Phosphorus
- 8.1.3. Nitrogen
- 8.1.4. Other Types
- 8.1.1. Inorganic
- 8.2. Market Analysis, Insights and Forecast - by End-user Industry
- 8.2.1. Electrical and Electronics
- 8.2.2. Buildings and Construction
- 8.2.3. Transportation
- 8.2.4. Textiles and Furniture
- 8.1. Market Analysis, Insights and Forecast - by Type
- 9. Europe Non-Halogenated Flame Retardants Chemicals Industry Analysis, Insights and Forecast, 2020-2032
- 9.1. Market Analysis, Insights and Forecast - by Type
- 9.1.1. Inorganic
- 9.1.1.1. Aluminum Hydroxide
- 9.1.1.2. Magnesium Hydroxide
- 9.1.1.3. Boron Compounds
- 9.1.2. Phosphorus
- 9.1.3. Nitrogen
- 9.1.4. Other Types
- 9.1.1. Inorganic
- 9.2. Market Analysis, Insights and Forecast - by End-user Industry
- 9.2.1. Electrical and Electronics
- 9.2.2. Buildings and Construction
- 9.2.3. Transportation
- 9.2.4. Textiles and Furniture
- 9.1. Market Analysis, Insights and Forecast - by Type
- 10. South America Non-Halogenated Flame Retardants Chemicals Industry Analysis, Insights and Forecast, 2020-2032
- 10.1. Market Analysis, Insights and Forecast - by Type
- 10.1.1. Inorganic
- 10.1.1.1. Aluminum Hydroxide
- 10.1.1.2. Magnesium Hydroxide
- 10.1.1.3. Boron Compounds
- 10.1.2. Phosphorus
- 10.1.3. Nitrogen
- 10.1.4. Other Types
- 10.1.1. Inorganic
- 10.2. Market Analysis, Insights and Forecast - by End-user Industry
- 10.2.1. Electrical and Electronics
- 10.2.2. Buildings and Construction
- 10.2.3. Transportation
- 10.2.4. Textiles and Furniture
- 10.1. Market Analysis, Insights and Forecast - by Type
- 11. Middle East and Africa Non-Halogenated Flame Retardants Chemicals Industry Analysis, Insights and Forecast, 2020-2032
- 11.1. Market Analysis, Insights and Forecast - by Type
- 11.1.1. Inorganic
- 11.1.1.1. Aluminum Hydroxide
- 11.1.1.2. Magnesium Hydroxide
- 11.1.1.3. Boron Compounds
- 11.1.2. Phosphorus
- 11.1.3. Nitrogen
- 11.1.4. Other Types
- 11.1.1. Inorganic
- 11.2. Market Analysis, Insights and Forecast - by End-user Industry
- 11.2.1. Electrical and Electronics
- 11.2.2. Buildings and Construction
- 11.2.3. Transportation
- 11.2.4. Textiles and Furniture
- 11.1. Market Analysis, Insights and Forecast - by Type
- 12. Competitive Analysis
- 12.1. Company Profiles
- 12.1.1 ICL
- 12.1.1.1. Company Overview
- 12.1.1.2. Products
- 12.1.1.3. Company Financials
- 12.1.1.4. SWOT Analysis
- 12.1.2 DIC Corporation
- 12.1.2.1. Company Overview
- 12.1.2.2. Products
- 12.1.2.3. Company Financials
- 12.1.2.4. SWOT Analysis
- 12.1.3 TOR Minerals
- 12.1.3.1. Company Overview
- 12.1.3.2. Products
- 12.1.3.3. Company Financials
- 12.1.3.4. SWOT Analysis
- 12.1.4 Clariant
- 12.1.4.1. Company Overview
- 12.1.4.2. Products
- 12.1.4.3. Company Financials
- 12.1.4.4. SWOT Analysis
- 12.1.5 Jiangsu Jacques Technology Co Ltd
- 12.1.5.1. Company Overview
- 12.1.5.2. Products
- 12.1.5.3. Company Financials
- 12.1.5.4. SWOT Analysis
- 12.1.6 MPI Chemie BV
- 12.1.6.1. Company Overview
- 12.1.6.2. Products
- 12.1.6.3. Company Financials
- 12.1.6.4. SWOT Analysis
- 12.1.7 Italmatch Chemicals SpA
- 12.1.7.1. Company Overview
- 12.1.7.2. Products
- 12.1.7.3. Company Financials
- 12.1.7.4. SWOT Analysis
- 12.1.8 LANXESS
- 12.1.8.1. Company Overview
- 12.1.8.2. Products
- 12.1.8.3. Company Financials
- 12.1.8.4. SWOT Analysis
- 12.1.9 Nippon Carbide Indestries Co Inc (Sanwa Chemical Industry Co Ltd)
- 12.1.9.1. Company Overview
- 12.1.9.2. Products
- 12.1.9.3. Company Financials
- 12.1.9.4. SWOT Analysis
- 12.1.10 BASF SE
- 12.1.10.1. Company Overview
- 12.1.10.2. Products
- 12.1.10.3. Company Financials
- 12.1.10.4. SWOT Analysis
- 12.1.11 Rin Kagaku Kogyo Co Ltd
- 12.1.11.1. Company Overview
- 12.1.11.2. Products
- 12.1.11.3. Company Financials
- 12.1.11.4. SWOT Analysis
- 12.1.12 Shandong Brother Sci &Tech Co Ltd
- 12.1.12.1. Company Overview
- 12.1.12.2. Products
- 12.1.12.3. Company Financials
- 12.1.12.4. SWOT Analysis
- 12.1.13 Nabaltec AG
- 12.1.13.1. Company Overview
- 12.1.13.2. Products
- 12.1.13.3. Company Financials
- 12.1.13.4. SWOT Analysis
- 12.1.14 Thor
- 12.1.14.1. Company Overview
- 12.1.14.2. Products
- 12.1.14.3. Company Financials
- 12.1.14.4. SWOT Analysis
- 12.1.15 Eti Maden
- 12.1.15.1. Company Overview
- 12.1.15.2. Products
- 12.1.15.3. Company Financials
- 12.1.15.4. SWOT Analysis
- 12.1.16 Apexical Inc
- 12.1.16.1. Company Overview
- 12.1.16.2. Products
- 12.1.16.3. Company Financials
- 12.1.16.4. SWOT Analysis
- 12.1.17 NYACOL Nano Technologies Inc
- 12.1.17.1. Company Overview
- 12.1.17.2. Products
- 12.1.17.3. Company Financials
- 12.1.17.4. SWOT Analysis
- 12.1.18 Huber Engineered Materials
- 12.1.18.1. Company Overview
- 12.1.18.2. Products
- 12.1.18.3. Company Financials
- 12.1.18.4. SWOT Analysis
- 12.1.19 Daihachi Chemical Industry Co Ltd
- 12.1.19.1. Company Overview
- 12.1.19.2. Products
- 12.1.19.3. Company Financials
- 12.1.19.4. SWOT Analysis
- 12.1.1 ICL
- 12.2. Market Entropy
- 12.2.1 Company's Key Areas Served
- 12.2.2 Recent Developments
- 12.3. Company Market Share Analysis 2025
- 12.3.1 Top 5 Companies Market Share Analysis
- 12.3.2 Top 3 Companies Market Share Analysis
- 12.4. List of Potential Customers
- 13. Research Methodology
List of Figures
- Figure 1: Global Non-Halogenated Flame Retardants Chemicals Industry Revenue Breakdown (billion, %) by Region 2025 & 2033
- Figure 2: Global Non-Halogenated Flame Retardants Chemicals Industry Volume Breakdown (K Tons, %) by Region 2025 & 2033
- Figure 3: Asia Pacific Non-Halogenated Flame Retardants Chemicals Industry Revenue (billion), by Type 2025 & 2033
- Figure 4: Asia Pacific Non-Halogenated Flame Retardants Chemicals Industry Volume (K Tons), by Type 2025 & 2033
- Figure 5: Asia Pacific Non-Halogenated Flame Retardants Chemicals Industry Revenue Share (%), by Type 2025 & 2033
- Figure 6: Asia Pacific Non-Halogenated Flame Retardants Chemicals Industry Volume Share (%), by Type 2025 & 2033
- Figure 7: Asia Pacific Non-Halogenated Flame Retardants Chemicals Industry Revenue (billion), by End-user Industry 2025 & 2033
- Figure 8: Asia Pacific Non-Halogenated Flame Retardants Chemicals Industry Volume (K Tons), by End-user Industry 2025 & 2033
- Figure 9: Asia Pacific Non-Halogenated Flame Retardants Chemicals Industry Revenue Share (%), by End-user Industry 2025 & 2033
- Figure 10: Asia Pacific Non-Halogenated Flame Retardants Chemicals Industry Volume Share (%), by End-user Industry 2025 & 2033
- Figure 11: Asia Pacific Non-Halogenated Flame Retardants Chemicals Industry Revenue (billion), by Country 2025 & 2033
- Figure 12: Asia Pacific Non-Halogenated Flame Retardants Chemicals Industry Volume (K Tons), by Country 2025 & 2033
- Figure 13: Asia Pacific Non-Halogenated Flame Retardants Chemicals Industry Revenue Share (%), by Country 2025 & 2033
- Figure 14: Asia Pacific Non-Halogenated Flame Retardants Chemicals Industry Volume Share (%), by Country 2025 & 2033
- Figure 15: North America Non-Halogenated Flame Retardants Chemicals Industry Revenue (billion), by Type 2025 & 2033
- Figure 16: North America Non-Halogenated Flame Retardants Chemicals Industry Volume (K Tons), by Type 2025 & 2033
- Figure 17: North America Non-Halogenated Flame Retardants Chemicals Industry Revenue Share (%), by Type 2025 & 2033
- Figure 18: North America Non-Halogenated Flame Retardants Chemicals Industry Volume Share (%), by Type 2025 & 2033
- Figure 19: North America Non-Halogenated Flame Retardants Chemicals Industry Revenue (billion), by End-user Industry 2025 & 2033
- Figure 20: North America Non-Halogenated Flame Retardants Chemicals Industry Volume (K Tons), by End-user Industry 2025 & 2033
- Figure 21: North America Non-Halogenated Flame Retardants Chemicals Industry Revenue Share (%), by End-user Industry 2025 & 2033
- Figure 22: North America Non-Halogenated Flame Retardants Chemicals Industry Volume Share (%), by End-user Industry 2025 & 2033
- Figure 23: North America Non-Halogenated Flame Retardants Chemicals Industry Revenue (billion), by Country 2025 & 2033
- Figure 24: North America Non-Halogenated Flame Retardants Chemicals Industry Volume (K Tons), by Country 2025 & 2033
- Figure 25: North America Non-Halogenated Flame Retardants Chemicals Industry Revenue Share (%), by Country 2025 & 2033
- Figure 26: North America Non-Halogenated Flame Retardants Chemicals Industry Volume Share (%), by Country 2025 & 2033
- Figure 27: Europe Non-Halogenated Flame Retardants Chemicals Industry Revenue (billion), by Type 2025 & 2033
- Figure 28: Europe Non-Halogenated Flame Retardants Chemicals Industry Volume (K Tons), by Type 2025 & 2033
- Figure 29: Europe Non-Halogenated Flame Retardants Chemicals Industry Revenue Share (%), by Type 2025 & 2033
- Figure 30: Europe Non-Halogenated Flame Retardants Chemicals Industry Volume Share (%), by Type 2025 & 2033
- Figure 31: Europe Non-Halogenated Flame Retardants Chemicals Industry Revenue (billion), by End-user Industry 2025 & 2033
- Figure 32: Europe Non-Halogenated Flame Retardants Chemicals Industry Volume (K Tons), by End-user Industry 2025 & 2033
- Figure 33: Europe Non-Halogenated Flame Retardants Chemicals Industry Revenue Share (%), by End-user Industry 2025 & 2033
- Figure 34: Europe Non-Halogenated Flame Retardants Chemicals Industry Volume Share (%), by End-user Industry 2025 & 2033
- Figure 35: Europe Non-Halogenated Flame Retardants Chemicals Industry Revenue (billion), by Country 2025 & 2033
- Figure 36: Europe Non-Halogenated Flame Retardants Chemicals Industry Volume (K Tons), by Country 2025 & 2033
- Figure 37: Europe Non-Halogenated Flame Retardants Chemicals Industry Revenue Share (%), by Country 2025 & 2033
- Figure 38: Europe Non-Halogenated Flame Retardants Chemicals Industry Volume Share (%), by Country 2025 & 2033
- Figure 39: South America Non-Halogenated Flame Retardants Chemicals Industry Revenue (billion), by Type 2025 & 2033
- Figure 40: South America Non-Halogenated Flame Retardants Chemicals Industry Volume (K Tons), by Type 2025 & 2033
- Figure 41: South America Non-Halogenated Flame Retardants Chemicals Industry Revenue Share (%), by Type 2025 & 2033
- Figure 42: South America Non-Halogenated Flame Retardants Chemicals Industry Volume Share (%), by Type 2025 & 2033
- Figure 43: South America Non-Halogenated Flame Retardants Chemicals Industry Revenue (billion), by End-user Industry 2025 & 2033
- Figure 44: South America Non-Halogenated Flame Retardants Chemicals Industry Volume (K Tons), by End-user Industry 2025 & 2033
- Figure 45: South America Non-Halogenated Flame Retardants Chemicals Industry Revenue Share (%), by End-user Industry 2025 & 2033
- Figure 46: South America Non-Halogenated Flame Retardants Chemicals Industry Volume Share (%), by End-user Industry 2025 & 2033
- Figure 47: South America Non-Halogenated Flame Retardants Chemicals Industry Revenue (billion), by Country 2025 & 2033
- Figure 48: South America Non-Halogenated Flame Retardants Chemicals Industry Volume (K Tons), by Country 2025 & 2033
- Figure 49: South America Non-Halogenated Flame Retardants Chemicals Industry Revenue Share (%), by Country 2025 & 2033
- Figure 50: South America Non-Halogenated Flame Retardants Chemicals Industry Volume Share (%), by Country 2025 & 2033
- Figure 51: Middle East and Africa Non-Halogenated Flame Retardants Chemicals Industry Revenue (billion), by Type 2025 & 2033
- Figure 52: Middle East and Africa Non-Halogenated Flame Retardants Chemicals Industry Volume (K Tons), by Type 2025 & 2033
- Figure 53: Middle East and Africa Non-Halogenated Flame Retardants Chemicals Industry Revenue Share (%), by Type 2025 & 2033
- Figure 54: Middle East and Africa Non-Halogenated Flame Retardants Chemicals Industry Volume Share (%), by Type 2025 & 2033
- Figure 55: Middle East and Africa Non-Halogenated Flame Retardants Chemicals Industry Revenue (billion), by End-user Industry 2025 & 2033
- Figure 56: Middle East and Africa Non-Halogenated Flame Retardants Chemicals Industry Volume (K Tons), by End-user Industry 2025 & 2033
- Figure 57: Middle East and Africa Non-Halogenated Flame Retardants Chemicals Industry Revenue Share (%), by End-user Industry 2025 & 2033
- Figure 58: Middle East and Africa Non-Halogenated Flame Retardants Chemicals Industry Volume Share (%), by End-user Industry 2025 & 2033
- Figure 59: Middle East and Africa Non-Halogenated Flame Retardants Chemicals Industry Revenue (billion), by Country 2025 & 2033
- Figure 60: Middle East and Africa Non-Halogenated Flame Retardants Chemicals Industry Volume (K Tons), by Country 2025 & 2033
- Figure 61: Middle East and Africa Non-Halogenated Flame Retardants Chemicals Industry Revenue Share (%), by Country 2025 & 2033
- Figure 62: Middle East and Africa Non-Halogenated Flame Retardants Chemicals Industry Volume Share (%), by Country 2025 & 2033
List of Tables
- Table 1: Global Non-Halogenated Flame Retardants Chemicals Industry Revenue billion Forecast, by Type 2020 & 2033
- Table 2: Global Non-Halogenated Flame Retardants Chemicals Industry Volume K Tons Forecast, by Type 2020 & 2033
- Table 3: Global Non-Halogenated Flame Retardants Chemicals Industry Revenue billion Forecast, by End-user Industry 2020 & 2033
- Table 4: Global Non-Halogenated Flame Retardants Chemicals Industry Volume K Tons Forecast, by End-user Industry 2020 & 2033
- Table 5: Global Non-Halogenated Flame Retardants Chemicals Industry Revenue billion Forecast, by Region 2020 & 2033
- Table 6: Global Non-Halogenated Flame Retardants Chemicals Industry Volume K Tons Forecast, by Region 2020 & 2033
- Table 7: Global Non-Halogenated Flame Retardants Chemicals Industry Revenue billion Forecast, by Type 2020 & 2033
- Table 8: Global Non-Halogenated Flame Retardants Chemicals Industry Volume K Tons Forecast, by Type 2020 & 2033
- Table 9: Global Non-Halogenated Flame Retardants Chemicals Industry Revenue billion Forecast, by End-user Industry 2020 & 2033
- Table 10: Global Non-Halogenated Flame Retardants Chemicals Industry Volume K Tons Forecast, by End-user Industry 2020 & 2033
- Table 11: Global Non-Halogenated Flame Retardants Chemicals Industry Revenue billion Forecast, by Country 2020 & 2033
- Table 12: Global Non-Halogenated Flame Retardants Chemicals Industry Volume K Tons Forecast, by Country 2020 & 2033
- Table 13: China Non-Halogenated Flame Retardants Chemicals Industry Revenue (billion) Forecast, by Application 2020 & 2033
- Table 14: China Non-Halogenated Flame Retardants Chemicals Industry Volume (K Tons) Forecast, by Application 2020 & 2033
- Table 15: India Non-Halogenated Flame Retardants Chemicals Industry Revenue (billion) Forecast, by Application 2020 & 2033
- Table 16: India Non-Halogenated Flame Retardants Chemicals Industry Volume (K Tons) Forecast, by Application 2020 & 2033
- Table 17: Japan Non-Halogenated Flame Retardants Chemicals Industry Revenue (billion) Forecast, by Application 2020 & 2033
- Table 18: Japan Non-Halogenated Flame Retardants Chemicals Industry Volume (K Tons) Forecast, by Application 2020 & 2033
- Table 19: South Korea Non-Halogenated Flame Retardants Chemicals Industry Revenue (billion) Forecast, by Application 2020 & 2033
- Table 20: South Korea Non-Halogenated Flame Retardants Chemicals Industry Volume (K Tons) Forecast, by Application 2020 & 2033
- Table 21: Rest of Asia Pacific Non-Halogenated Flame Retardants Chemicals Industry Revenue (billion) Forecast, by Application 2020 & 2033
- Table 22: Rest of Asia Pacific Non-Halogenated Flame Retardants Chemicals Industry Volume (K Tons) Forecast, by Application 2020 & 2033
- Table 23: Global Non-Halogenated Flame Retardants Chemicals Industry Revenue billion Forecast, by Type 2020 & 2033
- Table 24: Global Non-Halogenated Flame Retardants Chemicals Industry Volume K Tons Forecast, by Type 2020 & 2033
- Table 25: Global Non-Halogenated Flame Retardants Chemicals Industry Revenue billion Forecast, by End-user Industry 2020 & 2033
- Table 26: Global Non-Halogenated Flame Retardants Chemicals Industry Volume K Tons Forecast, by End-user Industry 2020 & 2033
- Table 27: Global Non-Halogenated Flame Retardants Chemicals Industry Revenue billion Forecast, by Country 2020 & 2033
- Table 28: Global Non-Halogenated Flame Retardants Chemicals Industry Volume K Tons Forecast, by Country 2020 & 2033
- Table 29: United States Non-Halogenated Flame Retardants Chemicals Industry Revenue (billion) Forecast, by Application 2020 & 2033
- Table 30: United States Non-Halogenated Flame Retardants Chemicals Industry Volume (K Tons) Forecast, by Application 2020 & 2033
- Table 31: Canada Non-Halogenated Flame Retardants Chemicals Industry Revenue (billion) Forecast, by Application 2020 & 2033
- Table 32: Canada Non-Halogenated Flame Retardants Chemicals Industry Volume (K Tons) Forecast, by Application 2020 & 2033
- Table 33: Mexico Non-Halogenated Flame Retardants Chemicals Industry Revenue (billion) Forecast, by Application 2020 & 2033
- Table 34: Mexico Non-Halogenated Flame Retardants Chemicals Industry Volume (K Tons) Forecast, by Application 2020 & 2033
- Table 35: Global Non-Halogenated Flame Retardants Chemicals Industry Revenue billion Forecast, by Type 2020 & 2033
- Table 36: Global Non-Halogenated Flame Retardants Chemicals Industry Volume K Tons Forecast, by Type 2020 & 2033
- Table 37: Global Non-Halogenated Flame Retardants Chemicals Industry Revenue billion Forecast, by End-user Industry 2020 & 2033
- Table 38: Global Non-Halogenated Flame Retardants Chemicals Industry Volume K Tons Forecast, by End-user Industry 2020 & 2033
- Table 39: Global Non-Halogenated Flame Retardants Chemicals Industry Revenue billion Forecast, by Country 2020 & 2033
- Table 40: Global Non-Halogenated Flame Retardants Chemicals Industry Volume K Tons Forecast, by Country 2020 & 2033
- Table 41: Germany Non-Halogenated Flame Retardants Chemicals Industry Revenue (billion) Forecast, by Application 2020 & 2033
- Table 42: Germany Non-Halogenated Flame Retardants Chemicals Industry Volume (K Tons) Forecast, by Application 2020 & 2033
- Table 43: United Kingdom Non-Halogenated Flame Retardants Chemicals Industry Revenue (billion) Forecast, by Application 2020 & 2033
- Table 44: United Kingdom Non-Halogenated Flame Retardants Chemicals Industry Volume (K Tons) Forecast, by Application 2020 & 2033
- Table 45: Italy Non-Halogenated Flame Retardants Chemicals Industry Revenue (billion) Forecast, by Application 2020 & 2033
- Table 46: Italy Non-Halogenated Flame Retardants Chemicals Industry Volume (K Tons) Forecast, by Application 2020 & 2033
- Table 47: France Non-Halogenated Flame Retardants Chemicals Industry Revenue (billion) Forecast, by Application 2020 & 2033
- Table 48: France Non-Halogenated Flame Retardants Chemicals Industry Volume (K Tons) Forecast, by Application 2020 & 2033
- Table 49: Rest of Europe Non-Halogenated Flame Retardants Chemicals Industry Revenue (billion) Forecast, by Application 2020 & 2033
- Table 50: Rest of Europe Non-Halogenated Flame Retardants Chemicals Industry Volume (K Tons) Forecast, by Application 2020 & 2033
- Table 51: Global Non-Halogenated Flame Retardants Chemicals Industry Revenue billion Forecast, by Type 2020 & 2033
- Table 52: Global Non-Halogenated Flame Retardants Chemicals Industry Volume K Tons Forecast, by Type 2020 & 2033
- Table 53: Global Non-Halogenated Flame Retardants Chemicals Industry Revenue billion Forecast, by End-user Industry 2020 & 2033
- Table 54: Global Non-Halogenated Flame Retardants Chemicals Industry Volume K Tons Forecast, by End-user Industry 2020 & 2033
- Table 55: Global Non-Halogenated Flame Retardants Chemicals Industry Revenue billion Forecast, by Country 2020 & 2033
- Table 56: Global Non-Halogenated Flame Retardants Chemicals Industry Volume K Tons Forecast, by Country 2020 & 2033
- Table 57: Brazil Non-Halogenated Flame Retardants Chemicals Industry Revenue (billion) Forecast, by Application 2020 & 2033
- Table 58: Brazil Non-Halogenated Flame Retardants Chemicals Industry Volume (K Tons) Forecast, by Application 2020 & 2033
- Table 59: Argentina Non-Halogenated Flame Retardants Chemicals Industry Revenue (billion) Forecast, by Application 2020 & 2033
- Table 60: Argentina Non-Halogenated Flame Retardants Chemicals Industry Volume (K Tons) Forecast, by Application 2020 & 2033
- Table 61: Rest of South America Non-Halogenated Flame Retardants Chemicals Industry Revenue (billion) Forecast, by Application 2020 & 2033
- Table 62: Rest of South America Non-Halogenated Flame Retardants Chemicals Industry Volume (K Tons) Forecast, by Application 2020 & 2033
- Table 63: Global Non-Halogenated Flame Retardants Chemicals Industry Revenue billion Forecast, by Type 2020 & 2033
- Table 64: Global Non-Halogenated Flame Retardants Chemicals Industry Volume K Tons Forecast, by Type 2020 & 2033
- Table 65: Global Non-Halogenated Flame Retardants Chemicals Industry Revenue billion Forecast, by End-user Industry 2020 & 2033
- Table 66: Global Non-Halogenated Flame Retardants Chemicals Industry Volume K Tons Forecast, by End-user Industry 2020 & 2033
- Table 67: Global Non-Halogenated Flame Retardants Chemicals Industry Revenue billion Forecast, by Country 2020 & 2033
- Table 68: Global Non-Halogenated Flame Retardants Chemicals Industry Volume K Tons Forecast, by Country 2020 & 2033
- Table 69: Saudi Arabia Non-Halogenated Flame Retardants Chemicals Industry Revenue (billion) Forecast, by Application 2020 & 2033
- Table 70: Saudi Arabia Non-Halogenated Flame Retardants Chemicals Industry Volume (K Tons) Forecast, by Application 2020 & 2033
- Table 71: South Africa Non-Halogenated Flame Retardants Chemicals Industry Revenue (billion) Forecast, by Application 2020 & 2033
- Table 72: South Africa Non-Halogenated Flame Retardants Chemicals Industry Volume (K Tons) Forecast, by Application 2020 & 2033
- Table 73: Rest of Middle East and Africa Non-Halogenated Flame Retardants Chemicals Industry Revenue (billion) Forecast, by Application 2020 & 2033
- Table 74: Rest of Middle East and Africa Non-Halogenated Flame Retardants Chemicals Industry Volume (K Tons) Forecast, by Application 2020 & 2033
Frequently Asked Questions
1. What is the projected Compound Annual Growth Rate (CAGR) of the Non-Halogenated Flame Retardants Chemicals Industry?
The projected CAGR is approximately 12.02%.
2. Which companies are prominent players in the Non-Halogenated Flame Retardants Chemicals Industry?
Key companies in the market include ICL, DIC Corporation, TOR Minerals, Clariant, Jiangsu Jacques Technology Co Ltd, MPI Chemie BV, Italmatch Chemicals SpA, LANXESS, Nippon Carbide Indestries Co Inc (Sanwa Chemical Industry Co Ltd), BASF SE, Rin Kagaku Kogyo Co Ltd, Shandong Brother Sci &Tech Co Ltd, Nabaltec AG, Thor, Eti Maden, Apexical Inc, NYACOL Nano Technologies Inc, Huber Engineered Materials, Daihachi Chemical Industry Co Ltd.
3. What are the main segments of the Non-Halogenated Flame Retardants Chemicals Industry?
The market segments include Type, End-user Industry.
4. Can you provide details about the market size?
The market size is estimated to be USD 10.59 billion as of 2022.
5. What are some drivers contributing to market growth?
; Environmental and Health Concerns Regarding Brominated and Other Flame Retardants; Increasing Infrastructure Activities in Asia-Pacific; Rising Consumer Electrical and Electronic Goods Manufacturing.
6. What are the notable trends driving market growth?
Increasing Demand from the Buildings and Construction Industry.
7. Are there any restraints impacting market growth?
; Non-suitability of Hydroxides to High Temperature Applications.
8. Can you provide examples of recent developments in the market?
N/A
9. What pricing options are available for accessing the report?
Pricing options include single-user, multi-user, and enterprise licenses priced at USD 4750, USD 5250, and USD 8750 respectively.
10. Is the market size provided in terms of value or volume?
The market size is provided in terms of value, measured in billion and volume, measured in K Tons.
11. Are there any specific market keywords associated with the report?
Yes, the market keyword associated with the report is "Non-Halogenated Flame Retardants Chemicals Industry," which aids in identifying and referencing the specific market segment covered.
12. How do I determine which pricing option suits my needs best?
The pricing options vary based on user requirements and access needs. Individual users may opt for single-user licenses, while businesses requiring broader access may choose multi-user or enterprise licenses for cost-effective access to the report.
13. Are there any additional resources or data provided in the Non-Halogenated Flame Retardants Chemicals Industry report?
While the report offers comprehensive insights, it's advisable to review the specific contents or supplementary materials provided to ascertain if additional resources or data are available.
14. How can I stay updated on further developments or reports in the Non-Halogenated Flame Retardants Chemicals Industry?
To stay informed about further developments, trends, and reports in the Non-Halogenated Flame Retardants Chemicals Industry, consider subscribing to industry newsletters, following relevant companies and organizations, or regularly checking reputable industry news sources and publications.
Methodology
Step 1 - Identification of Relevant Samples Size from Population Database


Step 2 - Approaches for Defining Global Market Size (Value, Volume* & Price*)

Note*: In applicable scenarios
Step 3 - Data Sources
Primary Research
- Web Analytics
- Survey Reports
- Research Institute
- Latest Research Reports
- Opinion Leaders
Secondary Research
- Annual Reports
- White Paper
- Latest Press Release
- Industry Association
- Paid Database
- Investor Presentations

Step 4 - Data Triangulation
Involves using different sources of information in order to increase the validity of a study
These sources are likely to be stakeholders in a program - participants, other researchers, program staff, other community members, and so on.
Then we put all data in single framework & apply various statistical tools to find out the dynamic on the market.
During the analysis stage, feedback from the stakeholder groups would be compared to determine areas of agreement as well as areas of divergence