

Key Insights
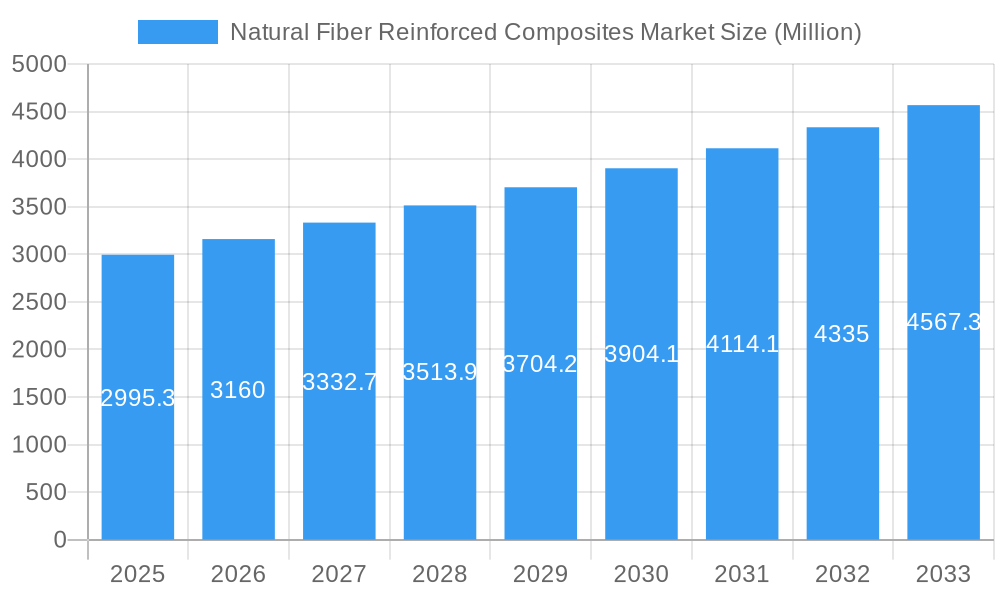
The global Natural Fiber Reinforced Composites (NFRC) market, valued at $2,995.3 million in 2025, is projected to experience robust growth, driven by increasing demand for sustainable and eco-friendly materials across diverse industries. A Compound Annual Growth Rate (CAGR) of 5.3% from 2025 to 2033 signifies a significant market expansion, fueled by several key factors. The automotive sector's push for lightweight vehicles to improve fuel efficiency is a major driver, along with the construction industry's adoption of NFRCs for their durability and renewable attributes. Growing awareness of environmental concerns and the increasing regulatory pressure to reduce carbon footprints are further bolstering the market's growth trajectory. The segmentation reveals a dynamic landscape, with wood fiber composites currently holding a significant market share within the fiber category, while thermoplastics are leading in the polymer segment. The aerospace industry, known for its stringent material requirements, is witnessing a gradual adoption of NFRCs, while the building and construction sector remains a dominant end-user, showcasing the versatility of these composites. However, challenges such as the variability in natural fiber properties and the need for advanced processing techniques to achieve consistent performance are potential restraints to be addressed for wider market penetration.

Natural Fiber Reinforced Composites Market Market Size (In Billion)
Technological advancements are continually improving the performance and consistency of NFRCs, mitigating some of these restraints. Research and development efforts are focused on optimizing fiber treatment processes, enhancing the compatibility between fibers and polymers, and developing novel composite designs. This is leading to the creation of high-performance NFRCs that can compete with traditional materials in terms of strength, durability, and cost-effectiveness. The geographic distribution shows strong growth potential in the Asia-Pacific region, driven by rapid industrialization and increasing infrastructure development in countries like China and India. North America and Europe, while mature markets, continue to contribute significantly, largely due to established automotive and aerospace industries. The competitive landscape is characterized by a mix of established players and emerging companies, all vying for market share through innovation and strategic partnerships, contributing to a highly dynamic and evolving NFRC market.
Natural Fiber Reinforced Composites Market Company Market Share
Natural Fiber Reinforced Composites Market: A Comprehensive Report (2019-2033)
This comprehensive report provides a detailed analysis of the Natural Fiber Reinforced Composites market, offering invaluable insights for stakeholders seeking to navigate this dynamic landscape. The report covers the period 2019-2033, with a base year of 2025 and a forecast period of 2025-2033. The market is projected to reach xx Million by 2033, exhibiting a CAGR of xx% during the forecast period. This report explores market dynamics, industry trends, leading segments, key players, and future opportunities, providing actionable intelligence for informed decision-making.
Natural Fiber Reinforced Composites Market Market Dynamics & Concentration
The Natural Fiber Reinforced Composites market is characterized by moderate concentration, with several key players holding significant market share. However, the market is witnessing increased competition from new entrants, particularly in niche segments. Innovation is a crucial driver, fueled by the need for sustainable, lightweight, and cost-effective materials. Stringent environmental regulations are pushing the adoption of natural fiber composites, while fluctuating raw material prices and technological advancements present ongoing challenges. The market also faces competition from traditional materials such as metals and plastics. Recent M&A activities have been focused on expanding product portfolios and geographical reach. The number of M&A deals in the last five years stands at xx, indicating a moderately active consolidation phase.
- Market Share: The top 5 players collectively hold approximately xx% of the market share.
- Innovation Drivers: Sustainability concerns, lightweighting needs in various industries, and cost advantages over traditional materials.
- Regulatory Framework: Increasingly stringent environmental regulations are driving the adoption of natural fiber composites.
- Product Substitutes: Traditional materials like metals and plastics pose significant competition.
- End-User Trends: Growing demand from the building & construction, automotive, and renewable energy sectors.
- M&A Activities: xx M&A deals in the last five years reflect a focus on market consolidation and expansion.
Natural Fiber Reinforced Composites Market Industry Trends & Analysis
The Natural Fiber Reinforced Composites market is experiencing robust growth, driven by several factors. Increasing awareness of environmental sustainability is boosting demand for eco-friendly materials, while advancements in processing techniques are enhancing the performance characteristics of these composites. Consumer preference for sustainable products is a key factor, particularly in sectors like building and construction. Competitive dynamics are characterized by both established players and emerging companies focusing on innovation and market penetration. The global market size reached xx Million in 2024 and is expected to grow at a CAGR of xx% from 2025 to 2033. Market penetration is highest in the building and construction sector, with significant growth potential in automotive and aerospace applications. Technological disruptions, such as the development of advanced bio-based resins, are further accelerating market expansion.
Leading Markets & Segments in Natural Fiber Reinforced Composites Market
The building and construction sector represents the largest end-user industry for natural fiber reinforced composites, driven by the need for sustainable and cost-effective building materials. Within fiber types, wood fiber composites hold the largest market share, followed by non-wood fiber composites. Thermoplastics are the dominant polymer type due to their ease of processing and recyclability. Geographically, North America and Europe currently lead the market, but Asia-Pacific is projected to show significant growth due to increasing infrastructure development and industrialization.
- Key Drivers in Building & Construction: Growing construction activity, stringent building codes promoting sustainable materials, and increasing consumer preference for eco-friendly homes.
- Key Drivers in Automotive: Demand for lightweight vehicles to improve fuel efficiency and reduce emissions.
- Dominance Analysis: The building and construction sector's dominance is attributed to high volume consumption and consistent demand for sustainable materials. North America and Europe benefit from established infrastructure and environmental regulations.
Natural Fiber Reinforced Composites Market Product Developments
Recent product innovations focus on enhancing the performance and versatility of natural fiber reinforced composites. New resin systems and processing techniques are improving mechanical properties, durability, and dimensional stability. Applications are expanding beyond traditional sectors into high-growth areas like wind energy and medical devices. Key competitive advantages include sustainability, cost-effectiveness, and superior properties compared to some traditional materials. Technological trends are focused on improving the strength-to-weight ratio and water resistance of the composites.
Key Drivers of Natural Fiber Reinforced Composites Market Growth
Several factors contribute to the market's growth trajectory. Technological advancements in resin formulations and processing are continuously improving the performance and applications of these composites. Favorable government policies and incentives promoting sustainable materials are driving adoption. Furthermore, the growing demand for lightweight and sustainable materials across various end-use sectors is fueling market expansion. Cost-effectiveness compared to some traditional materials also presents a significant advantage.
Challenges in the Natural Fiber Reinforced Composites Market Market
The market faces several challenges, including the variability in the quality of natural fibers, impacting the consistency of composite properties. Supply chain disruptions can lead to price fluctuations and production delays. Competition from established materials and the need for further technological advancements to overcome certain performance limitations are also key considerations. The market also faces challenges related to standardization and certification processes.
Emerging Opportunities in Natural Fiber Reinforced Composites Market
Significant opportunities exist for growth, particularly in developing innovative applications in emerging sectors like aerospace and renewable energy. Strategic partnerships between material suppliers, manufacturers, and end-users are crucial for expanding market reach. Technological breakthroughs in bio-based resins and fiber modification techniques are poised to enhance the properties and expand the applications of these composites. The exploration of new fiber sources and improved processing methods presents further opportunities for market expansion.
Leading Players in the Natural Fiber Reinforced Composites Market Sector
- Beologic
- Amorim Cork Composites SA
- BPREG Composites
- JELU-WERK J Ehrler GmbH & Co KG
- Green Dot Bioplastics
- TECNARO GmbH
- Trex Company Inc
- Fiberon
- UPM
- GreenGran BN
- Wuhu Haoxuan Wood Plastic Composite Co Ltd
- FKuR
- Flexform Technologies
- UFP Technologies Inc
- Oldcastle APG
- The AZEK Company Inc
Key Milestones in Natural Fiber Reinforced Composites Market Industry
- June 2023: Trex Company introduced Trex Select T-Rail, a wood composite railing system expanding market reach with competitive pricing.
- February 2023: Trex Company launched Trex Signature Decking, a premium wood composite decking series enhancing its product portfolio and targeting a high-end market segment.
Strategic Outlook for Natural Fiber Reinforced Composites Market Market
The Natural Fiber Reinforced Composites market holds immense potential for future growth. Strategic investments in research and development, focusing on improved material properties and processing techniques, will be crucial for maintaining a competitive edge. Expanding into new applications and geographical markets, along with strategic partnerships and collaborations, will drive long-term market expansion. The focus on sustainability and cost-effectiveness positions this market for significant growth in the coming years.
Natural Fiber Reinforced Composites Market Segmentation
-
1. Fiber
- 1.1. Wood Fiber Composites
-
1.2. Non-wood Fiber Composites
- 1.2.1. Cotton
- 1.2.2. Flax
- 1.2.3. Kenaf
- 1.2.4. Hemp
- 1.2.5. Other No
-
2. Polymer
- 2.1. Thermosets
-
2.2. Thermoplastics
- 2.2.1. Polyethylene
- 2.2.2. Polypropylene
- 2.2.3. Poly Vinyl Chloride
- 2.2.4. Other Th
-
3. End-user Industry
- 3.1. Aerospace
- 3.2. Automotive
- 3.3. Marine
- 3.4. Building and Construction
- 3.5. Electrical and Electronics
- 3.6. Sports
- 3.7. Other En
Natural Fiber Reinforced Composites Market Segmentation By Geography
-
1. Asia Pacific
- 1.1. China
- 1.2. India
- 1.3. Japan
- 1.4. South Korea
- 1.5. Malaysia
- 1.6. Thailand
- 1.7. Indonesia
- 1.8. Vietnam
- 1.9. Rest of Asia Pacific
-
2. North America
- 2.1. United States
- 2.2. Canada
- 2.3. Mexico
-
3. Europe
- 3.1. Germany
- 3.2. United Kingdom
- 3.3. France
- 3.4. Italy
- 3.5. Spain
- 3.6. Nordic Countries
- 3.7. Turkey
- 3.8. Russia
- 3.9. Rest of Europe
-
4. South America
- 4.1. Brazil
- 4.2. Argentina
- 4.3. Colombia
- 4.4. Rest of South America
-
5. Middle East and Africa
- 5.1. Saudi Arabia
- 5.2. Qatar
- 5.3. United Arab Emirates
- 5.4. Nigeria
- 5.5. Egypt
- 5.6. South Africa
- 5.7. Rest of Middle East and Africa

Natural Fiber Reinforced Composites Market Regional Market Share
Geographic Coverage of Natural Fiber Reinforced Composites Market
Natural Fiber Reinforced Composites Market REPORT HIGHLIGHTS
| Aspects | Details |
|---|---|
| Study Period | 2020-2034 |
| Base Year | 2025 |
| Estimated Year | 2026 |
| Forecast Period | 2026-2034 |
| Historical Period | 2020-2025 |
| Growth Rate | CAGR of 5.3% from 2020-2034 |
| Segmentation |
|
Table of Contents
- 1. Introduction
- 1.1. Research Scope
- 1.2. Market Segmentation
- 1.3. Research Methodology
- 1.4. Definitions and Assumptions
- 2. Executive Summary
- 2.1. Introduction
- 3. Market Dynamics
- 3.1. Introduction
- 3.2. Market Drivers
- 3.2.1. Increasing Demand for Bio-based Composites; Growth in the Automotive Industry Worldwide
- 3.3. Market Restrains
- 3.3.1 Moisture Adsorption
- 3.3.2 Restricted Processing Temperature
- 3.3.3 and Incompatibility with Most of the Polymer Matrices; Degradation Issue Due to Exposure to the External Environment
- 3.4. Market Trends
- 3.4.1. The Construction Industry is Expected to Dominate the Market
- 4. Market Factor Analysis
- 4.1. Porters Five Forces
- 4.2. Supply/Value Chain
- 4.3. PESTEL analysis
- 4.4. Market Entropy
- 4.5. Patent/Trademark Analysis
- 5. Global Natural Fiber Reinforced Composites Market Analysis, Insights and Forecast, 2020-2032
- 5.1. Market Analysis, Insights and Forecast - by Fiber
- 5.1.1. Wood Fiber Composites
- 5.1.2. Non-wood Fiber Composites
- 5.1.2.1. Cotton
- 5.1.2.2. Flax
- 5.1.2.3. Kenaf
- 5.1.2.4. Hemp
- 5.1.2.5. Other No
- 5.2. Market Analysis, Insights and Forecast - by Polymer
- 5.2.1. Thermosets
- 5.2.2. Thermoplastics
- 5.2.2.1. Polyethylene
- 5.2.2.2. Polypropylene
- 5.2.2.3. Poly Vinyl Chloride
- 5.2.2.4. Other Th
- 5.3. Market Analysis, Insights and Forecast - by End-user Industry
- 5.3.1. Aerospace
- 5.3.2. Automotive
- 5.3.3. Marine
- 5.3.4. Building and Construction
- 5.3.5. Electrical and Electronics
- 5.3.6. Sports
- 5.3.7. Other En
- 5.4. Market Analysis, Insights and Forecast - by Region
- 5.4.1. Asia Pacific
- 5.4.2. North America
- 5.4.3. Europe
- 5.4.4. South America
- 5.4.5. Middle East and Africa
- 5.1. Market Analysis, Insights and Forecast - by Fiber
- 6. Asia Pacific Natural Fiber Reinforced Composites Market Analysis, Insights and Forecast, 2020-2032
- 6.1. Market Analysis, Insights and Forecast - by Fiber
- 6.1.1. Wood Fiber Composites
- 6.1.2. Non-wood Fiber Composites
- 6.1.2.1. Cotton
- 6.1.2.2. Flax
- 6.1.2.3. Kenaf
- 6.1.2.4. Hemp
- 6.1.2.5. Other No
- 6.2. Market Analysis, Insights and Forecast - by Polymer
- 6.2.1. Thermosets
- 6.2.2. Thermoplastics
- 6.2.2.1. Polyethylene
- 6.2.2.2. Polypropylene
- 6.2.2.3. Poly Vinyl Chloride
- 6.2.2.4. Other Th
- 6.3. Market Analysis, Insights and Forecast - by End-user Industry
- 6.3.1. Aerospace
- 6.3.2. Automotive
- 6.3.3. Marine
- 6.3.4. Building and Construction
- 6.3.5. Electrical and Electronics
- 6.3.6. Sports
- 6.3.7. Other En
- 6.1. Market Analysis, Insights and Forecast - by Fiber
- 7. North America Natural Fiber Reinforced Composites Market Analysis, Insights and Forecast, 2020-2032
- 7.1. Market Analysis, Insights and Forecast - by Fiber
- 7.1.1. Wood Fiber Composites
- 7.1.2. Non-wood Fiber Composites
- 7.1.2.1. Cotton
- 7.1.2.2. Flax
- 7.1.2.3. Kenaf
- 7.1.2.4. Hemp
- 7.1.2.5. Other No
- 7.2. Market Analysis, Insights and Forecast - by Polymer
- 7.2.1. Thermosets
- 7.2.2. Thermoplastics
- 7.2.2.1. Polyethylene
- 7.2.2.2. Polypropylene
- 7.2.2.3. Poly Vinyl Chloride
- 7.2.2.4. Other Th
- 7.3. Market Analysis, Insights and Forecast - by End-user Industry
- 7.3.1. Aerospace
- 7.3.2. Automotive
- 7.3.3. Marine
- 7.3.4. Building and Construction
- 7.3.5. Electrical and Electronics
- 7.3.6. Sports
- 7.3.7. Other En
- 7.1. Market Analysis, Insights and Forecast - by Fiber
- 8. Europe Natural Fiber Reinforced Composites Market Analysis, Insights and Forecast, 2020-2032
- 8.1. Market Analysis, Insights and Forecast - by Fiber
- 8.1.1. Wood Fiber Composites
- 8.1.2. Non-wood Fiber Composites
- 8.1.2.1. Cotton
- 8.1.2.2. Flax
- 8.1.2.3. Kenaf
- 8.1.2.4. Hemp
- 8.1.2.5. Other No
- 8.2. Market Analysis, Insights and Forecast - by Polymer
- 8.2.1. Thermosets
- 8.2.2. Thermoplastics
- 8.2.2.1. Polyethylene
- 8.2.2.2. Polypropylene
- 8.2.2.3. Poly Vinyl Chloride
- 8.2.2.4. Other Th
- 8.3. Market Analysis, Insights and Forecast - by End-user Industry
- 8.3.1. Aerospace
- 8.3.2. Automotive
- 8.3.3. Marine
- 8.3.4. Building and Construction
- 8.3.5. Electrical and Electronics
- 8.3.6. Sports
- 8.3.7. Other En
- 8.1. Market Analysis, Insights and Forecast - by Fiber
- 9. South America Natural Fiber Reinforced Composites Market Analysis, Insights and Forecast, 2020-2032
- 9.1. Market Analysis, Insights and Forecast - by Fiber
- 9.1.1. Wood Fiber Composites
- 9.1.2. Non-wood Fiber Composites
- 9.1.2.1. Cotton
- 9.1.2.2. Flax
- 9.1.2.3. Kenaf
- 9.1.2.4. Hemp
- 9.1.2.5. Other No
- 9.2. Market Analysis, Insights and Forecast - by Polymer
- 9.2.1. Thermosets
- 9.2.2. Thermoplastics
- 9.2.2.1. Polyethylene
- 9.2.2.2. Polypropylene
- 9.2.2.3. Poly Vinyl Chloride
- 9.2.2.4. Other Th
- 9.3. Market Analysis, Insights and Forecast - by End-user Industry
- 9.3.1. Aerospace
- 9.3.2. Automotive
- 9.3.3. Marine
- 9.3.4. Building and Construction
- 9.3.5. Electrical and Electronics
- 9.3.6. Sports
- 9.3.7. Other En
- 9.1. Market Analysis, Insights and Forecast - by Fiber
- 10. Middle East and Africa Natural Fiber Reinforced Composites Market Analysis, Insights and Forecast, 2020-2032
- 10.1. Market Analysis, Insights and Forecast - by Fiber
- 10.1.1. Wood Fiber Composites
- 10.1.2. Non-wood Fiber Composites
- 10.1.2.1. Cotton
- 10.1.2.2. Flax
- 10.1.2.3. Kenaf
- 10.1.2.4. Hemp
- 10.1.2.5. Other No
- 10.2. Market Analysis, Insights and Forecast - by Polymer
- 10.2.1. Thermosets
- 10.2.2. Thermoplastics
- 10.2.2.1. Polyethylene
- 10.2.2.2. Polypropylene
- 10.2.2.3. Poly Vinyl Chloride
- 10.2.2.4. Other Th
- 10.3. Market Analysis, Insights and Forecast - by End-user Industry
- 10.3.1. Aerospace
- 10.3.2. Automotive
- 10.3.3. Marine
- 10.3.4. Building and Construction
- 10.3.5. Electrical and Electronics
- 10.3.6. Sports
- 10.3.7. Other En
- 10.1. Market Analysis, Insights and Forecast - by Fiber
- 11. Competitive Analysis
- 11.1. Global Market Share Analysis 2025
- 11.2. Company Profiles
- 11.2.1 Beologic
- 11.2.1.1. Overview
- 11.2.1.2. Products
- 11.2.1.3. SWOT Analysis
- 11.2.1.4. Recent Developments
- 11.2.1.5. Financials (Based on Availability)
- 11.2.2 Amorim Cork Composites SA
- 11.2.2.1. Overview
- 11.2.2.2. Products
- 11.2.2.3. SWOT Analysis
- 11.2.2.4. Recent Developments
- 11.2.2.5. Financials (Based on Availability)
- 11.2.3 BPREG Composites
- 11.2.3.1. Overview
- 11.2.3.2. Products
- 11.2.3.3. SWOT Analysis
- 11.2.3.4. Recent Developments
- 11.2.3.5. Financials (Based on Availability)
- 11.2.4 JELU-WERK J Ehrler GmbH & Co KG
- 11.2.4.1. Overview
- 11.2.4.2. Products
- 11.2.4.3. SWOT Analysis
- 11.2.4.4. Recent Developments
- 11.2.4.5. Financials (Based on Availability)
- 11.2.5 Green Dot Bioplastics
- 11.2.5.1. Overview
- 11.2.5.2. Products
- 11.2.5.3. SWOT Analysis
- 11.2.5.4. Recent Developments
- 11.2.5.5. Financials (Based on Availability)
- 11.2.6 TECNARO GmbH
- 11.2.6.1. Overview
- 11.2.6.2. Products
- 11.2.6.3. SWOT Analysis
- 11.2.6.4. Recent Developments
- 11.2.6.5. Financials (Based on Availability)
- 11.2.7 Trex Company Inc
- 11.2.7.1. Overview
- 11.2.7.2. Products
- 11.2.7.3. SWOT Analysis
- 11.2.7.4. Recent Developments
- 11.2.7.5. Financials (Based on Availability)
- 11.2.8 Fiberon
- 11.2.8.1. Overview
- 11.2.8.2. Products
- 11.2.8.3. SWOT Analysis
- 11.2.8.4. Recent Developments
- 11.2.8.5. Financials (Based on Availability)
- 11.2.9 UPM
- 11.2.9.1. Overview
- 11.2.9.2. Products
- 11.2.9.3. SWOT Analysis
- 11.2.9.4. Recent Developments
- 11.2.9.5. Financials (Based on Availability)
- 11.2.10 GreenGran BN
- 11.2.10.1. Overview
- 11.2.10.2. Products
- 11.2.10.3. SWOT Analysis
- 11.2.10.4. Recent Developments
- 11.2.10.5. Financials (Based on Availability)
- 11.2.11 Wuhu Haoxuan Wood Plastic Composite Co Ltd
- 11.2.11.1. Overview
- 11.2.11.2. Products
- 11.2.11.3. SWOT Analysis
- 11.2.11.4. Recent Developments
- 11.2.11.5. Financials (Based on Availability)
- 11.2.12 FKuR
- 11.2.12.1. Overview
- 11.2.12.2. Products
- 11.2.12.3. SWOT Analysis
- 11.2.12.4. Recent Developments
- 11.2.12.5. Financials (Based on Availability)
- 11.2.13 Flexform Technologies
- 11.2.13.1. Overview
- 11.2.13.2. Products
- 11.2.13.3. SWOT Analysis
- 11.2.13.4. Recent Developments
- 11.2.13.5. Financials (Based on Availability)
- 11.2.14 UFP Technologies Inc
- 11.2.14.1. Overview
- 11.2.14.2. Products
- 11.2.14.3. SWOT Analysis
- 11.2.14.4. Recent Developments
- 11.2.14.5. Financials (Based on Availability)
- 11.2.15 Oldcastle APG
- 11.2.15.1. Overview
- 11.2.15.2. Products
- 11.2.15.3. SWOT Analysis
- 11.2.15.4. Recent Developments
- 11.2.15.5. Financials (Based on Availability)
- 11.2.16 The AZEK Company Inc
- 11.2.16.1. Overview
- 11.2.16.2. Products
- 11.2.16.3. SWOT Analysis
- 11.2.16.4. Recent Developments
- 11.2.16.5. Financials (Based on Availability)
- 11.2.1 Beologic
List of Figures
- Figure 1: Global Natural Fiber Reinforced Composites Market Revenue Breakdown (Million, %) by Region 2025 & 2033
- Figure 2: Global Natural Fiber Reinforced Composites Market Volume Breakdown (K Tons, %) by Region 2025 & 2033
- Figure 3: Asia Pacific Natural Fiber Reinforced Composites Market Revenue (Million), by Fiber 2025 & 2033
- Figure 4: Asia Pacific Natural Fiber Reinforced Composites Market Volume (K Tons), by Fiber 2025 & 2033
- Figure 5: Asia Pacific Natural Fiber Reinforced Composites Market Revenue Share (%), by Fiber 2025 & 2033
- Figure 6: Asia Pacific Natural Fiber Reinforced Composites Market Volume Share (%), by Fiber 2025 & 2033
- Figure 7: Asia Pacific Natural Fiber Reinforced Composites Market Revenue (Million), by Polymer 2025 & 2033
- Figure 8: Asia Pacific Natural Fiber Reinforced Composites Market Volume (K Tons), by Polymer 2025 & 2033
- Figure 9: Asia Pacific Natural Fiber Reinforced Composites Market Revenue Share (%), by Polymer 2025 & 2033
- Figure 10: Asia Pacific Natural Fiber Reinforced Composites Market Volume Share (%), by Polymer 2025 & 2033
- Figure 11: Asia Pacific Natural Fiber Reinforced Composites Market Revenue (Million), by End-user Industry 2025 & 2033
- Figure 12: Asia Pacific Natural Fiber Reinforced Composites Market Volume (K Tons), by End-user Industry 2025 & 2033
- Figure 13: Asia Pacific Natural Fiber Reinforced Composites Market Revenue Share (%), by End-user Industry 2025 & 2033
- Figure 14: Asia Pacific Natural Fiber Reinforced Composites Market Volume Share (%), by End-user Industry 2025 & 2033
- Figure 15: Asia Pacific Natural Fiber Reinforced Composites Market Revenue (Million), by Country 2025 & 2033
- Figure 16: Asia Pacific Natural Fiber Reinforced Composites Market Volume (K Tons), by Country 2025 & 2033
- Figure 17: Asia Pacific Natural Fiber Reinforced Composites Market Revenue Share (%), by Country 2025 & 2033
- Figure 18: Asia Pacific Natural Fiber Reinforced Composites Market Volume Share (%), by Country 2025 & 2033
- Figure 19: North America Natural Fiber Reinforced Composites Market Revenue (Million), by Fiber 2025 & 2033
- Figure 20: North America Natural Fiber Reinforced Composites Market Volume (K Tons), by Fiber 2025 & 2033
- Figure 21: North America Natural Fiber Reinforced Composites Market Revenue Share (%), by Fiber 2025 & 2033
- Figure 22: North America Natural Fiber Reinforced Composites Market Volume Share (%), by Fiber 2025 & 2033
- Figure 23: North America Natural Fiber Reinforced Composites Market Revenue (Million), by Polymer 2025 & 2033
- Figure 24: North America Natural Fiber Reinforced Composites Market Volume (K Tons), by Polymer 2025 & 2033
- Figure 25: North America Natural Fiber Reinforced Composites Market Revenue Share (%), by Polymer 2025 & 2033
- Figure 26: North America Natural Fiber Reinforced Composites Market Volume Share (%), by Polymer 2025 & 2033
- Figure 27: North America Natural Fiber Reinforced Composites Market Revenue (Million), by End-user Industry 2025 & 2033
- Figure 28: North America Natural Fiber Reinforced Composites Market Volume (K Tons), by End-user Industry 2025 & 2033
- Figure 29: North America Natural Fiber Reinforced Composites Market Revenue Share (%), by End-user Industry 2025 & 2033
- Figure 30: North America Natural Fiber Reinforced Composites Market Volume Share (%), by End-user Industry 2025 & 2033
- Figure 31: North America Natural Fiber Reinforced Composites Market Revenue (Million), by Country 2025 & 2033
- Figure 32: North America Natural Fiber Reinforced Composites Market Volume (K Tons), by Country 2025 & 2033
- Figure 33: North America Natural Fiber Reinforced Composites Market Revenue Share (%), by Country 2025 & 2033
- Figure 34: North America Natural Fiber Reinforced Composites Market Volume Share (%), by Country 2025 & 2033
- Figure 35: Europe Natural Fiber Reinforced Composites Market Revenue (Million), by Fiber 2025 & 2033
- Figure 36: Europe Natural Fiber Reinforced Composites Market Volume (K Tons), by Fiber 2025 & 2033
- Figure 37: Europe Natural Fiber Reinforced Composites Market Revenue Share (%), by Fiber 2025 & 2033
- Figure 38: Europe Natural Fiber Reinforced Composites Market Volume Share (%), by Fiber 2025 & 2033
- Figure 39: Europe Natural Fiber Reinforced Composites Market Revenue (Million), by Polymer 2025 & 2033
- Figure 40: Europe Natural Fiber Reinforced Composites Market Volume (K Tons), by Polymer 2025 & 2033
- Figure 41: Europe Natural Fiber Reinforced Composites Market Revenue Share (%), by Polymer 2025 & 2033
- Figure 42: Europe Natural Fiber Reinforced Composites Market Volume Share (%), by Polymer 2025 & 2033
- Figure 43: Europe Natural Fiber Reinforced Composites Market Revenue (Million), by End-user Industry 2025 & 2033
- Figure 44: Europe Natural Fiber Reinforced Composites Market Volume (K Tons), by End-user Industry 2025 & 2033
- Figure 45: Europe Natural Fiber Reinforced Composites Market Revenue Share (%), by End-user Industry 2025 & 2033
- Figure 46: Europe Natural Fiber Reinforced Composites Market Volume Share (%), by End-user Industry 2025 & 2033
- Figure 47: Europe Natural Fiber Reinforced Composites Market Revenue (Million), by Country 2025 & 2033
- Figure 48: Europe Natural Fiber Reinforced Composites Market Volume (K Tons), by Country 2025 & 2033
- Figure 49: Europe Natural Fiber Reinforced Composites Market Revenue Share (%), by Country 2025 & 2033
- Figure 50: Europe Natural Fiber Reinforced Composites Market Volume Share (%), by Country 2025 & 2033
- Figure 51: South America Natural Fiber Reinforced Composites Market Revenue (Million), by Fiber 2025 & 2033
- Figure 52: South America Natural Fiber Reinforced Composites Market Volume (K Tons), by Fiber 2025 & 2033
- Figure 53: South America Natural Fiber Reinforced Composites Market Revenue Share (%), by Fiber 2025 & 2033
- Figure 54: South America Natural Fiber Reinforced Composites Market Volume Share (%), by Fiber 2025 & 2033
- Figure 55: South America Natural Fiber Reinforced Composites Market Revenue (Million), by Polymer 2025 & 2033
- Figure 56: South America Natural Fiber Reinforced Composites Market Volume (K Tons), by Polymer 2025 & 2033
- Figure 57: South America Natural Fiber Reinforced Composites Market Revenue Share (%), by Polymer 2025 & 2033
- Figure 58: South America Natural Fiber Reinforced Composites Market Volume Share (%), by Polymer 2025 & 2033
- Figure 59: South America Natural Fiber Reinforced Composites Market Revenue (Million), by End-user Industry 2025 & 2033
- Figure 60: South America Natural Fiber Reinforced Composites Market Volume (K Tons), by End-user Industry 2025 & 2033
- Figure 61: South America Natural Fiber Reinforced Composites Market Revenue Share (%), by End-user Industry 2025 & 2033
- Figure 62: South America Natural Fiber Reinforced Composites Market Volume Share (%), by End-user Industry 2025 & 2033
- Figure 63: South America Natural Fiber Reinforced Composites Market Revenue (Million), by Country 2025 & 2033
- Figure 64: South America Natural Fiber Reinforced Composites Market Volume (K Tons), by Country 2025 & 2033
- Figure 65: South America Natural Fiber Reinforced Composites Market Revenue Share (%), by Country 2025 & 2033
- Figure 66: South America Natural Fiber Reinforced Composites Market Volume Share (%), by Country 2025 & 2033
- Figure 67: Middle East and Africa Natural Fiber Reinforced Composites Market Revenue (Million), by Fiber 2025 & 2033
- Figure 68: Middle East and Africa Natural Fiber Reinforced Composites Market Volume (K Tons), by Fiber 2025 & 2033
- Figure 69: Middle East and Africa Natural Fiber Reinforced Composites Market Revenue Share (%), by Fiber 2025 & 2033
- Figure 70: Middle East and Africa Natural Fiber Reinforced Composites Market Volume Share (%), by Fiber 2025 & 2033
- Figure 71: Middle East and Africa Natural Fiber Reinforced Composites Market Revenue (Million), by Polymer 2025 & 2033
- Figure 72: Middle East and Africa Natural Fiber Reinforced Composites Market Volume (K Tons), by Polymer 2025 & 2033
- Figure 73: Middle East and Africa Natural Fiber Reinforced Composites Market Revenue Share (%), by Polymer 2025 & 2033
- Figure 74: Middle East and Africa Natural Fiber Reinforced Composites Market Volume Share (%), by Polymer 2025 & 2033
- Figure 75: Middle East and Africa Natural Fiber Reinforced Composites Market Revenue (Million), by End-user Industry 2025 & 2033
- Figure 76: Middle East and Africa Natural Fiber Reinforced Composites Market Volume (K Tons), by End-user Industry 2025 & 2033
- Figure 77: Middle East and Africa Natural Fiber Reinforced Composites Market Revenue Share (%), by End-user Industry 2025 & 2033
- Figure 78: Middle East and Africa Natural Fiber Reinforced Composites Market Volume Share (%), by End-user Industry 2025 & 2033
- Figure 79: Middle East and Africa Natural Fiber Reinforced Composites Market Revenue (Million), by Country 2025 & 2033
- Figure 80: Middle East and Africa Natural Fiber Reinforced Composites Market Volume (K Tons), by Country 2025 & 2033
- Figure 81: Middle East and Africa Natural Fiber Reinforced Composites Market Revenue Share (%), by Country 2025 & 2033
- Figure 82: Middle East and Africa Natural Fiber Reinforced Composites Market Volume Share (%), by Country 2025 & 2033
List of Tables
- Table 1: Global Natural Fiber Reinforced Composites Market Revenue Million Forecast, by Fiber 2020 & 2033
- Table 2: Global Natural Fiber Reinforced Composites Market Volume K Tons Forecast, by Fiber 2020 & 2033
- Table 3: Global Natural Fiber Reinforced Composites Market Revenue Million Forecast, by Polymer 2020 & 2033
- Table 4: Global Natural Fiber Reinforced Composites Market Volume K Tons Forecast, by Polymer 2020 & 2033
- Table 5: Global Natural Fiber Reinforced Composites Market Revenue Million Forecast, by End-user Industry 2020 & 2033
- Table 6: Global Natural Fiber Reinforced Composites Market Volume K Tons Forecast, by End-user Industry 2020 & 2033
- Table 7: Global Natural Fiber Reinforced Composites Market Revenue Million Forecast, by Region 2020 & 2033
- Table 8: Global Natural Fiber Reinforced Composites Market Volume K Tons Forecast, by Region 2020 & 2033
- Table 9: Global Natural Fiber Reinforced Composites Market Revenue Million Forecast, by Fiber 2020 & 2033
- Table 10: Global Natural Fiber Reinforced Composites Market Volume K Tons Forecast, by Fiber 2020 & 2033
- Table 11: Global Natural Fiber Reinforced Composites Market Revenue Million Forecast, by Polymer 2020 & 2033
- Table 12: Global Natural Fiber Reinforced Composites Market Volume K Tons Forecast, by Polymer 2020 & 2033
- Table 13: Global Natural Fiber Reinforced Composites Market Revenue Million Forecast, by End-user Industry 2020 & 2033
- Table 14: Global Natural Fiber Reinforced Composites Market Volume K Tons Forecast, by End-user Industry 2020 & 2033
- Table 15: Global Natural Fiber Reinforced Composites Market Revenue Million Forecast, by Country 2020 & 2033
- Table 16: Global Natural Fiber Reinforced Composites Market Volume K Tons Forecast, by Country 2020 & 2033
- Table 17: China Natural Fiber Reinforced Composites Market Revenue (Million) Forecast, by Application 2020 & 2033
- Table 18: China Natural Fiber Reinforced Composites Market Volume (K Tons) Forecast, by Application 2020 & 2033
- Table 19: India Natural Fiber Reinforced Composites Market Revenue (Million) Forecast, by Application 2020 & 2033
- Table 20: India Natural Fiber Reinforced Composites Market Volume (K Tons) Forecast, by Application 2020 & 2033
- Table 21: Japan Natural Fiber Reinforced Composites Market Revenue (Million) Forecast, by Application 2020 & 2033
- Table 22: Japan Natural Fiber Reinforced Composites Market Volume (K Tons) Forecast, by Application 2020 & 2033
- Table 23: South Korea Natural Fiber Reinforced Composites Market Revenue (Million) Forecast, by Application 2020 & 2033
- Table 24: South Korea Natural Fiber Reinforced Composites Market Volume (K Tons) Forecast, by Application 2020 & 2033
- Table 25: Malaysia Natural Fiber Reinforced Composites Market Revenue (Million) Forecast, by Application 2020 & 2033
- Table 26: Malaysia Natural Fiber Reinforced Composites Market Volume (K Tons) Forecast, by Application 2020 & 2033
- Table 27: Thailand Natural Fiber Reinforced Composites Market Revenue (Million) Forecast, by Application 2020 & 2033
- Table 28: Thailand Natural Fiber Reinforced Composites Market Volume (K Tons) Forecast, by Application 2020 & 2033
- Table 29: Indonesia Natural Fiber Reinforced Composites Market Revenue (Million) Forecast, by Application 2020 & 2033
- Table 30: Indonesia Natural Fiber Reinforced Composites Market Volume (K Tons) Forecast, by Application 2020 & 2033
- Table 31: Vietnam Natural Fiber Reinforced Composites Market Revenue (Million) Forecast, by Application 2020 & 2033
- Table 32: Vietnam Natural Fiber Reinforced Composites Market Volume (K Tons) Forecast, by Application 2020 & 2033
- Table 33: Rest of Asia Pacific Natural Fiber Reinforced Composites Market Revenue (Million) Forecast, by Application 2020 & 2033
- Table 34: Rest of Asia Pacific Natural Fiber Reinforced Composites Market Volume (K Tons) Forecast, by Application 2020 & 2033
- Table 35: Global Natural Fiber Reinforced Composites Market Revenue Million Forecast, by Fiber 2020 & 2033
- Table 36: Global Natural Fiber Reinforced Composites Market Volume K Tons Forecast, by Fiber 2020 & 2033
- Table 37: Global Natural Fiber Reinforced Composites Market Revenue Million Forecast, by Polymer 2020 & 2033
- Table 38: Global Natural Fiber Reinforced Composites Market Volume K Tons Forecast, by Polymer 2020 & 2033
- Table 39: Global Natural Fiber Reinforced Composites Market Revenue Million Forecast, by End-user Industry 2020 & 2033
- Table 40: Global Natural Fiber Reinforced Composites Market Volume K Tons Forecast, by End-user Industry 2020 & 2033
- Table 41: Global Natural Fiber Reinforced Composites Market Revenue Million Forecast, by Country 2020 & 2033
- Table 42: Global Natural Fiber Reinforced Composites Market Volume K Tons Forecast, by Country 2020 & 2033
- Table 43: United States Natural Fiber Reinforced Composites Market Revenue (Million) Forecast, by Application 2020 & 2033
- Table 44: United States Natural Fiber Reinforced Composites Market Volume (K Tons) Forecast, by Application 2020 & 2033
- Table 45: Canada Natural Fiber Reinforced Composites Market Revenue (Million) Forecast, by Application 2020 & 2033
- Table 46: Canada Natural Fiber Reinforced Composites Market Volume (K Tons) Forecast, by Application 2020 & 2033
- Table 47: Mexico Natural Fiber Reinforced Composites Market Revenue (Million) Forecast, by Application 2020 & 2033
- Table 48: Mexico Natural Fiber Reinforced Composites Market Volume (K Tons) Forecast, by Application 2020 & 2033
- Table 49: Global Natural Fiber Reinforced Composites Market Revenue Million Forecast, by Fiber 2020 & 2033
- Table 50: Global Natural Fiber Reinforced Composites Market Volume K Tons Forecast, by Fiber 2020 & 2033
- Table 51: Global Natural Fiber Reinforced Composites Market Revenue Million Forecast, by Polymer 2020 & 2033
- Table 52: Global Natural Fiber Reinforced Composites Market Volume K Tons Forecast, by Polymer 2020 & 2033
- Table 53: Global Natural Fiber Reinforced Composites Market Revenue Million Forecast, by End-user Industry 2020 & 2033
- Table 54: Global Natural Fiber Reinforced Composites Market Volume K Tons Forecast, by End-user Industry 2020 & 2033
- Table 55: Global Natural Fiber Reinforced Composites Market Revenue Million Forecast, by Country 2020 & 2033
- Table 56: Global Natural Fiber Reinforced Composites Market Volume K Tons Forecast, by Country 2020 & 2033
- Table 57: Germany Natural Fiber Reinforced Composites Market Revenue (Million) Forecast, by Application 2020 & 2033
- Table 58: Germany Natural Fiber Reinforced Composites Market Volume (K Tons) Forecast, by Application 2020 & 2033
- Table 59: United Kingdom Natural Fiber Reinforced Composites Market Revenue (Million) Forecast, by Application 2020 & 2033
- Table 60: United Kingdom Natural Fiber Reinforced Composites Market Volume (K Tons) Forecast, by Application 2020 & 2033
- Table 61: France Natural Fiber Reinforced Composites Market Revenue (Million) Forecast, by Application 2020 & 2033
- Table 62: France Natural Fiber Reinforced Composites Market Volume (K Tons) Forecast, by Application 2020 & 2033
- Table 63: Italy Natural Fiber Reinforced Composites Market Revenue (Million) Forecast, by Application 2020 & 2033
- Table 64: Italy Natural Fiber Reinforced Composites Market Volume (K Tons) Forecast, by Application 2020 & 2033
- Table 65: Spain Natural Fiber Reinforced Composites Market Revenue (Million) Forecast, by Application 2020 & 2033
- Table 66: Spain Natural Fiber Reinforced Composites Market Volume (K Tons) Forecast, by Application 2020 & 2033
- Table 67: Nordic Countries Natural Fiber Reinforced Composites Market Revenue (Million) Forecast, by Application 2020 & 2033
- Table 68: Nordic Countries Natural Fiber Reinforced Composites Market Volume (K Tons) Forecast, by Application 2020 & 2033
- Table 69: Turkey Natural Fiber Reinforced Composites Market Revenue (Million) Forecast, by Application 2020 & 2033
- Table 70: Turkey Natural Fiber Reinforced Composites Market Volume (K Tons) Forecast, by Application 2020 & 2033
- Table 71: Russia Natural Fiber Reinforced Composites Market Revenue (Million) Forecast, by Application 2020 & 2033
- Table 72: Russia Natural Fiber Reinforced Composites Market Volume (K Tons) Forecast, by Application 2020 & 2033
- Table 73: Rest of Europe Natural Fiber Reinforced Composites Market Revenue (Million) Forecast, by Application 2020 & 2033
- Table 74: Rest of Europe Natural Fiber Reinforced Composites Market Volume (K Tons) Forecast, by Application 2020 & 2033
- Table 75: Global Natural Fiber Reinforced Composites Market Revenue Million Forecast, by Fiber 2020 & 2033
- Table 76: Global Natural Fiber Reinforced Composites Market Volume K Tons Forecast, by Fiber 2020 & 2033
- Table 77: Global Natural Fiber Reinforced Composites Market Revenue Million Forecast, by Polymer 2020 & 2033
- Table 78: Global Natural Fiber Reinforced Composites Market Volume K Tons Forecast, by Polymer 2020 & 2033
- Table 79: Global Natural Fiber Reinforced Composites Market Revenue Million Forecast, by End-user Industry 2020 & 2033
- Table 80: Global Natural Fiber Reinforced Composites Market Volume K Tons Forecast, by End-user Industry 2020 & 2033
- Table 81: Global Natural Fiber Reinforced Composites Market Revenue Million Forecast, by Country 2020 & 2033
- Table 82: Global Natural Fiber Reinforced Composites Market Volume K Tons Forecast, by Country 2020 & 2033
- Table 83: Brazil Natural Fiber Reinforced Composites Market Revenue (Million) Forecast, by Application 2020 & 2033
- Table 84: Brazil Natural Fiber Reinforced Composites Market Volume (K Tons) Forecast, by Application 2020 & 2033
- Table 85: Argentina Natural Fiber Reinforced Composites Market Revenue (Million) Forecast, by Application 2020 & 2033
- Table 86: Argentina Natural Fiber Reinforced Composites Market Volume (K Tons) Forecast, by Application 2020 & 2033
- Table 87: Colombia Natural Fiber Reinforced Composites Market Revenue (Million) Forecast, by Application 2020 & 2033
- Table 88: Colombia Natural Fiber Reinforced Composites Market Volume (K Tons) Forecast, by Application 2020 & 2033
- Table 89: Rest of South America Natural Fiber Reinforced Composites Market Revenue (Million) Forecast, by Application 2020 & 2033
- Table 90: Rest of South America Natural Fiber Reinforced Composites Market Volume (K Tons) Forecast, by Application 2020 & 2033
- Table 91: Global Natural Fiber Reinforced Composites Market Revenue Million Forecast, by Fiber 2020 & 2033
- Table 92: Global Natural Fiber Reinforced Composites Market Volume K Tons Forecast, by Fiber 2020 & 2033
- Table 93: Global Natural Fiber Reinforced Composites Market Revenue Million Forecast, by Polymer 2020 & 2033
- Table 94: Global Natural Fiber Reinforced Composites Market Volume K Tons Forecast, by Polymer 2020 & 2033
- Table 95: Global Natural Fiber Reinforced Composites Market Revenue Million Forecast, by End-user Industry 2020 & 2033
- Table 96: Global Natural Fiber Reinforced Composites Market Volume K Tons Forecast, by End-user Industry 2020 & 2033
- Table 97: Global Natural Fiber Reinforced Composites Market Revenue Million Forecast, by Country 2020 & 2033
- Table 98: Global Natural Fiber Reinforced Composites Market Volume K Tons Forecast, by Country 2020 & 2033
- Table 99: Saudi Arabia Natural Fiber Reinforced Composites Market Revenue (Million) Forecast, by Application 2020 & 2033
- Table 100: Saudi Arabia Natural Fiber Reinforced Composites Market Volume (K Tons) Forecast, by Application 2020 & 2033
- Table 101: Qatar Natural Fiber Reinforced Composites Market Revenue (Million) Forecast, by Application 2020 & 2033
- Table 102: Qatar Natural Fiber Reinforced Composites Market Volume (K Tons) Forecast, by Application 2020 & 2033
- Table 103: United Arab Emirates Natural Fiber Reinforced Composites Market Revenue (Million) Forecast, by Application 2020 & 2033
- Table 104: United Arab Emirates Natural Fiber Reinforced Composites Market Volume (K Tons) Forecast, by Application 2020 & 2033
- Table 105: Nigeria Natural Fiber Reinforced Composites Market Revenue (Million) Forecast, by Application 2020 & 2033
- Table 106: Nigeria Natural Fiber Reinforced Composites Market Volume (K Tons) Forecast, by Application 2020 & 2033
- Table 107: Egypt Natural Fiber Reinforced Composites Market Revenue (Million) Forecast, by Application 2020 & 2033
- Table 108: Egypt Natural Fiber Reinforced Composites Market Volume (K Tons) Forecast, by Application 2020 & 2033
- Table 109: South Africa Natural Fiber Reinforced Composites Market Revenue (Million) Forecast, by Application 2020 & 2033
- Table 110: South Africa Natural Fiber Reinforced Composites Market Volume (K Tons) Forecast, by Application 2020 & 2033
- Table 111: Rest of Middle East and Africa Natural Fiber Reinforced Composites Market Revenue (Million) Forecast, by Application 2020 & 2033
- Table 112: Rest of Middle East and Africa Natural Fiber Reinforced Composites Market Volume (K Tons) Forecast, by Application 2020 & 2033
Frequently Asked Questions
1. What is the projected Compound Annual Growth Rate (CAGR) of the Natural Fiber Reinforced Composites Market?
The projected CAGR is approximately 5.3%.
2. Which companies are prominent players in the Natural Fiber Reinforced Composites Market?
Key companies in the market include Beologic, Amorim Cork Composites SA, BPREG Composites, JELU-WERK J Ehrler GmbH & Co KG, Green Dot Bioplastics, TECNARO GmbH, Trex Company Inc, Fiberon, UPM, GreenGran BN, Wuhu Haoxuan Wood Plastic Composite Co Ltd, FKuR, Flexform Technologies, UFP Technologies Inc, Oldcastle APG, The AZEK Company Inc.
3. What are the main segments of the Natural Fiber Reinforced Composites Market?
The market segments include Fiber, Polymer, End-user Industry.
4. Can you provide details about the market size?
The market size is estimated to be USD 2,995.3 Million as of 2022.
5. What are some drivers contributing to market growth?
Increasing Demand for Bio-based Composites; Growth in the Automotive Industry Worldwide.
6. What are the notable trends driving market growth?
The Construction Industry is Expected to Dominate the Market.
7. Are there any restraints impacting market growth?
Moisture Adsorption. Restricted Processing Temperature. and Incompatibility with Most of the Polymer Matrices; Degradation Issue Due to Exposure to the External Environment.
8. Can you provide examples of recent developments in the market?
June 2023: Trex Company introduced Trex Select T-Rail. The wood composite railing system, which includes a popular T-shaped top rail, is intended to make the beauty and convenience of Trex's high-performance wood composite railing available to a wider audience at prices that compete head-to-head with PVC vinyl railing.
9. What pricing options are available for accessing the report?
Pricing options include single-user, multi-user, and enterprise licenses priced at USD 4750, USD 5250, and USD 8750 respectively.
10. Is the market size provided in terms of value or volume?
The market size is provided in terms of value, measured in Million and volume, measured in K Tons.
11. Are there any specific market keywords associated with the report?
Yes, the market keyword associated with the report is "Natural Fiber Reinforced Composites Market," which aids in identifying and referencing the specific market segment covered.
12. How do I determine which pricing option suits my needs best?
The pricing options vary based on user requirements and access needs. Individual users may opt for single-user licenses, while businesses requiring broader access may choose multi-user or enterprise licenses for cost-effective access to the report.
13. Are there any additional resources or data provided in the Natural Fiber Reinforced Composites Market report?
While the report offers comprehensive insights, it's advisable to review the specific contents or supplementary materials provided to ascertain if additional resources or data are available.
14. How can I stay updated on further developments or reports in the Natural Fiber Reinforced Composites Market?
To stay informed about further developments, trends, and reports in the Natural Fiber Reinforced Composites Market, consider subscribing to industry newsletters, following relevant companies and organizations, or regularly checking reputable industry news sources and publications.
Methodology
Step 1 - Identification of Relevant Samples Size from Population Database


Step 2 - Approaches for Defining Global Market Size (Value, Volume* & Price*)

Note*: In applicable scenarios
Step 3 - Data Sources
Primary Research
- Web Analytics
- Survey Reports
- Research Institute
- Latest Research Reports
- Opinion Leaders
Secondary Research
- Annual Reports
- White Paper
- Latest Press Release
- Industry Association
- Paid Database
- Investor Presentations

Step 4 - Data Triangulation
Involves using different sources of information in order to increase the validity of a study
These sources are likely to be stakeholders in a program - participants, other researchers, program staff, other community members, and so on.
Then we put all data in single framework & apply various statistical tools to find out the dynamic on the market.
During the analysis stage, feedback from the stakeholder groups would be compared to determine areas of agreement as well as areas of divergence