

Key Insights
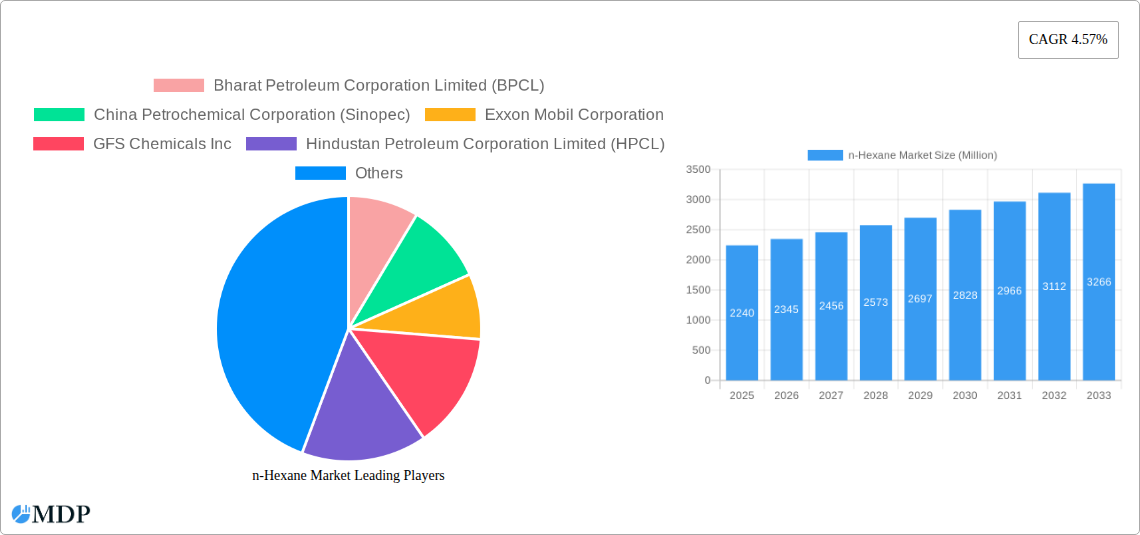
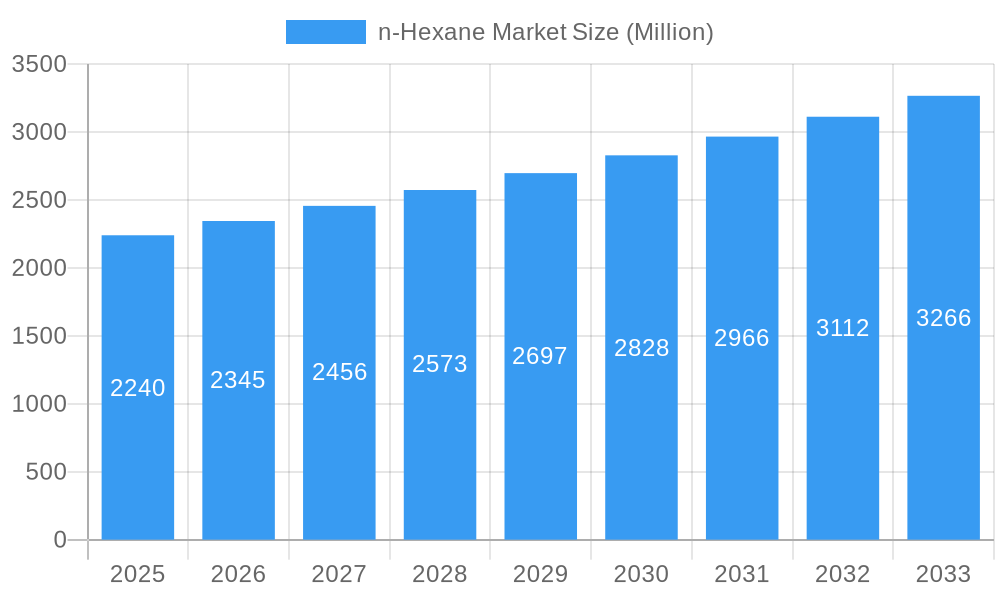
The n-Hexane market, valued at $2.24 billion in 2025, is projected to experience steady growth, driven by its crucial role as a solvent in various industries. A Compound Annual Growth Rate (CAGR) of 4.57% from 2025 to 2033 indicates a robust market expansion, primarily fueled by the increasing demand from the adhesives and coatings sector, which utilizes n-hexane for its superior solvent properties. The rising production of polymers and the expanding pharmaceutical industry further contribute to the market's growth trajectory. While competitive pressures from alternative solvents exist, the established applications and relatively low cost of n-hexane are expected to maintain its strong market position. Major players like Bharat Petroleum Corporation Limited (BPCL), Sinopec, Exxon Mobil, and others are actively shaping the market landscape through strategic expansions and technological advancements. The market will likely see further consolidation in the forecast period as companies seek to leverage economies of scale and expand their global reach. Geographic expansion, particularly in developing economies witnessing rapid industrialization, presents significant growth opportunities. However, stringent environmental regulations concerning volatile organic compounds (VOCs) and the inherent flammability of n-hexane pose potential restraints, requiring manufacturers to invest in safer handling and processing techniques.
n-Hexane Market Market Size (In Billion)
The forecast period (2025-2033) will witness strategic shifts within the n-hexane market, likely leading to mergers and acquisitions among key players. Technological advancements aiming to enhance safety and reduce environmental impact will gain prominence. Regional variations in demand will be influenced by industrial development patterns and government regulations. North America and Asia-Pacific are expected to be key regions driving market growth, given their significant contributions to the global chemical and manufacturing sectors. The overall market outlook remains positive, though the growth rate is likely to moderate in the later years of the forecast period due to a potential plateauing of demand in mature markets and the continued implementation of stricter environmental regulations.
n-Hexane Market Company Market Share
Unlock Growth Potential: A Comprehensive Analysis of the n-Hexane Market (2019-2033)
This in-depth report provides a comprehensive analysis of the n-Hexane market, offering actionable insights for industry stakeholders seeking to navigate this dynamic landscape. Covering the period from 2019 to 2033, with a base year of 2025 and a forecast period of 2025-2033, this report dissects market dynamics, trends, leading players, and future opportunities. Maximize your understanding of the n-Hexane market and gain a competitive edge with this essential resource.
n-Hexane Market Dynamics & Concentration
This section analyzes the competitive landscape of the n-Hexane market, examining factors influencing market concentration, innovation, regulations, and M&A activities. The market is characterized by a moderate level of concentration, with several major players holding significant market share. The estimated global market size in 2025 is valued at xx Million. Innovation in production technologies and downstream applications remains a key driver, while regulatory frameworks regarding emissions and safety influence market dynamics. Product substitution from alternative solvents is a growing factor, though n-Hexane continues to maintain its dominance in several key applications.
- Market Concentration: The top five players account for an estimated xx% of the global market share in 2025. This concentration is expected to remain relatively stable throughout the forecast period, though smaller players may see growth opportunities through niche applications.
- Innovation Drivers: Ongoing research focuses on improving production efficiency, enhancing purity, and exploring new applications. This drives further market expansion.
- Regulatory Frameworks: Environmental regulations regarding VOC emissions are a significant factor, influencing production methods and end-use applications.
- Product Substitutes: Alternative solvents pose a potential threat, however n-Hexane's inherent properties maintain its relevance in several key industries.
- End-User Trends: Demand is driven largely by the adhesives, paints, and coatings industries, with growth influenced by construction and automotive sector activities.
- M&A Activities: Over the historical period (2019-2024), xx M&A deals were recorded in the n-Hexane market, signaling consolidation and strategic expansion within the sector.
n-Hexane Market Industry Trends & Analysis
This section offers a deep dive into the key trends shaping the n-Hexane market. The market exhibits a robust growth trajectory, driven by factors such as rising demand from key end-use sectors and advancements in production techniques. The Compound Annual Growth Rate (CAGR) for the n-Hexane market during the forecast period (2025-2033) is projected at xx%. Market penetration in emerging economies is also a key trend, with developing nations representing significant future growth opportunities. Technological advancements in refining and extraction processes contribute to increased efficiency and lower production costs. Competitive dynamics are characterized by both price competition and innovation-led differentiation.
Leading Markets & Segments in n-Hexane Market
The Asia-Pacific region is currently the leading market for n-Hexane, driven by robust growth in the adhesives and coatings sectors within countries like China and India. Other significant markets include North America and Europe. The dominance of the Asia-Pacific region is primarily attributed to the following factors:
- Rapid Industrialization: The region's booming construction and automotive industries fuel demand.
- Favorable Economic Policies: Government initiatives supporting industrial growth create a positive environment for n-Hexane consumption.
- Expanding Infrastructure: Development of infrastructure projects necessitates increased use of adhesives and coatings, driving n-Hexane demand.
Within segments, the adhesives and coatings sector accounts for the largest share of n-Hexane consumption. The strong growth in construction activities in the Asia-Pacific region greatly contributes to this dominance.
n-Hexane Market Product Developments
Recent product developments have focused on enhancing n-Hexane's purity and developing specialized grades for specific applications. These innovations target improved performance and reduced environmental impact. Companies are investing in technologies to minimize impurities and enhance solvent properties, resulting in improved efficiency and safety for end-users. This focus on product refinement provides a competitive edge in the market.
Key Drivers of n-Hexane Market Growth
Several key factors are driving the growth of the n-Hexane market:
- Expanding End-Use Sectors: The continued growth of the construction, automotive, and packaging industries drives significant demand for n-Hexane-based products.
- Technological Advancements: Improvements in production processes and extraction techniques enhance efficiency and reduce costs.
- Favorable Economic Conditions: Positive economic growth in several regions translates to increased investment in infrastructure and industrial projects.
Challenges in the n-Hexane Market
The n-Hexane market faces challenges including:
- Stringent Environmental Regulations: Regulations concerning VOC emissions necessitate adoption of cleaner production methods and affect production costs.
- Fluctuations in Crude Oil Prices: As n-Hexane is a petroleum derivative, its price is sensitive to crude oil price volatility.
- Intense Competition: The market includes several established players, resulting in price pressures and the need for product differentiation.
Emerging Opportunities in n-Hexane Market
The long-term growth of the n-Hexane market is driven by several opportunities:
- Growth in Emerging Economies: Expanding industrialization in developing countries presents significant untapped potential.
- Development of New Applications: Research into novel uses for n-Hexane, beyond traditional applications, could broaden its market reach.
- Strategic Partnerships and Collaborations: Joint ventures and partnerships foster innovation and market expansion.
Leading Players in the n-Hexane Market Sector
- Bharat Petroleum Corporation Limited (BPCL)
- China Petrochemical Corporation (Sinopec)
- Exxon Mobil Corporation
- GFS Chemicals Inc
- Hindustan Petroleum Corporation Limited (HPCL)
- Indian Oil Corporation Ltd
- Jun Yuan Petroleum Group
- Liaoning Yufeng Chemical Co Ltd
- Phillips 66 Company
- Rompetrol
- Shell plc
- Shenyang Huifeng Petrochemical Co Ltd
- Sumitomo Chemical Co Ltd
- THAI OIL GROUP *List Not Exhaustive
Key Milestones in n-Hexane Market Industry
- March 2022: Phillips 66 announced its merger with Phillips 66 Partners, consolidating its position in the market and potentially influencing supply chain dynamics. This merger increased market share for Phillips 66 and optimized operations.
Strategic Outlook for n-Hexane Market Market
The future of the n-Hexane market is promising, with sustained growth projected throughout the forecast period. Companies adopting a strategic focus on innovation, sustainable practices, and market expansion in emerging economies are well-positioned to capture significant market share. Investments in research and development and strategic partnerships will be key to long-term success in this dynamic sector.
n-Hexane Market Segmentation
-
1. Type
- 1.1. n-Hexane
- 1.2. Isohexane
- 1.3. Neohexane
-
2. Grade
- 2.1. Polymer Grade
- 2.2. Food Grade
- 2.3. Other Grades
-
3. Application
- 3.1. Industrial Solvents
- 3.2. Edible Oil Extractant
- 3.3. Cleansing and Degreasing
- 3.4. Other Ap
n-Hexane Market Segmentation By Geography
-
1. Asia Pacific
- 1.1. China
- 1.2. India
- 1.3. Japan
- 1.4. South Korea
- 1.5. Malaysia
- 1.6. Thailand
- 1.7. Indonesia
- 1.8. Vietnam
- 1.9. Rest of Asia Pacific
-
2. North America
- 2.1. United States
- 2.2. Canada
- 2.3. Mexico
-
3. Europe
- 3.1. Germany
- 3.2. United Kingdom
- 3.3. Italy
- 3.4. France
- 3.5. Spain
- 3.6. NORDIC
- 3.7. Turkey
- 3.8. Russia
- 3.9. Rest of Europe
-
4. South America
- 4.1. Brazil
- 4.2. Argentina
- 4.3. Colombia
- 4.4. Rest of South America
-
5. Middle East and Africa
- 5.1. Saudi Arabia
- 5.2. South Africa
- 5.3. Nigeria
- 5.4. Qatar
- 5.5. Egypt
- 5.6. United Arab Emirates
- 5.7. Rest of Middle East and Africa
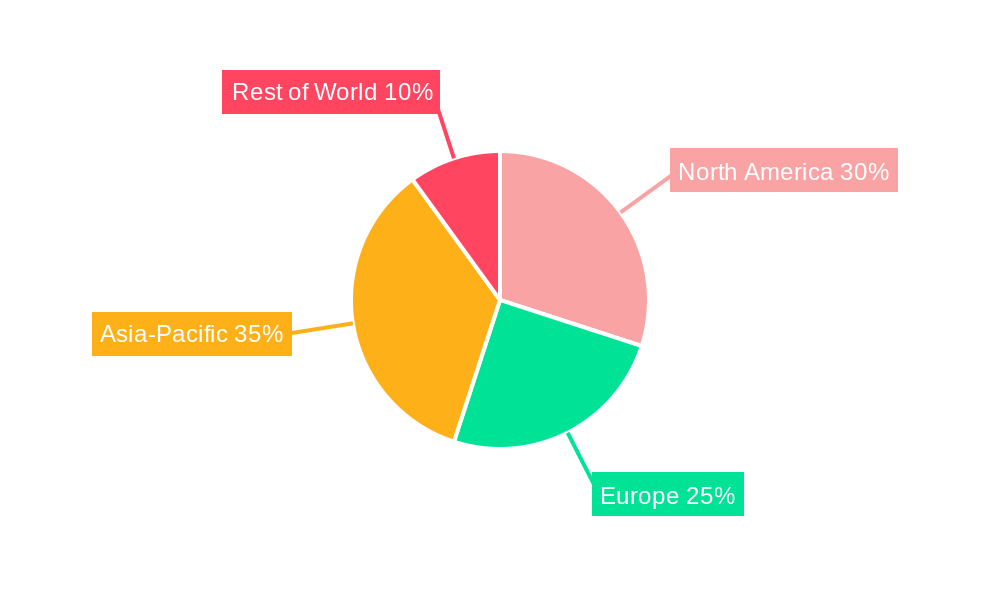
n-Hexane Market Regional Market Share
Geographic Coverage of n-Hexane Market
n-Hexane Market REPORT HIGHLIGHTS
| Aspects | Details |
|---|---|
| Study Period | 2020-2034 |
| Base Year | 2025 |
| Estimated Year | 2026 |
| Forecast Period | 2026-2034 |
| Historical Period | 2020-2025 |
| Growth Rate | CAGR of 4.57% from 2020-2034 |
| Segmentation |
|
Table of Contents
- 1. Introduction
- 1.1. Research Scope
- 1.2. Market Segmentation
- 1.3. Research Methodology
- 1.4. Definitions and Assumptions
- 2. Executive Summary
- 2.1. Introduction
- 3. Market Dynamics
- 3.1. Introduction
- 3.2. Market Drivers
- 3.2.1. Growing Demand from Petrochemical Industries; Increasing Demand for Edible Oil Extraction; Other Drivers
- 3.3. Market Restrains
- 3.3.1. Growing Demand from Petrochemical Industries; Increasing Demand for Edible Oil Extraction; Other Drivers
- 3.4. Market Trends
- 3.4.1. Edible Oil Extraction to Dominate the Market
- 4. Market Factor Analysis
- 4.1. Porters Five Forces
- 4.2. Supply/Value Chain
- 4.3. PESTEL analysis
- 4.4. Market Entropy
- 4.5. Patent/Trademark Analysis
- 5. Global n-Hexane Market Analysis, Insights and Forecast, 2020-2032
- 5.1. Market Analysis, Insights and Forecast - by Type
- 5.1.1. n-Hexane
- 5.1.2. Isohexane
- 5.1.3. Neohexane
- 5.2. Market Analysis, Insights and Forecast - by Grade
- 5.2.1. Polymer Grade
- 5.2.2. Food Grade
- 5.2.3. Other Grades
- 5.3. Market Analysis, Insights and Forecast - by Application
- 5.3.1. Industrial Solvents
- 5.3.2. Edible Oil Extractant
- 5.3.3. Cleansing and Degreasing
- 5.3.4. Other Ap
- 5.4. Market Analysis, Insights and Forecast - by Region
- 5.4.1. Asia Pacific
- 5.4.2. North America
- 5.4.3. Europe
- 5.4.4. South America
- 5.4.5. Middle East and Africa
- 5.1. Market Analysis, Insights and Forecast - by Type
- 6. Asia Pacific n-Hexane Market Analysis, Insights and Forecast, 2020-2032
- 6.1. Market Analysis, Insights and Forecast - by Type
- 6.1.1. n-Hexane
- 6.1.2. Isohexane
- 6.1.3. Neohexane
- 6.2. Market Analysis, Insights and Forecast - by Grade
- 6.2.1. Polymer Grade
- 6.2.2. Food Grade
- 6.2.3. Other Grades
- 6.3. Market Analysis, Insights and Forecast - by Application
- 6.3.1. Industrial Solvents
- 6.3.2. Edible Oil Extractant
- 6.3.3. Cleansing and Degreasing
- 6.3.4. Other Ap
- 6.1. Market Analysis, Insights and Forecast - by Type
- 7. North America n-Hexane Market Analysis, Insights and Forecast, 2020-2032
- 7.1. Market Analysis, Insights and Forecast - by Type
- 7.1.1. n-Hexane
- 7.1.2. Isohexane
- 7.1.3. Neohexane
- 7.2. Market Analysis, Insights and Forecast - by Grade
- 7.2.1. Polymer Grade
- 7.2.2. Food Grade
- 7.2.3. Other Grades
- 7.3. Market Analysis, Insights and Forecast - by Application
- 7.3.1. Industrial Solvents
- 7.3.2. Edible Oil Extractant
- 7.3.3. Cleansing and Degreasing
- 7.3.4. Other Ap
- 7.1. Market Analysis, Insights and Forecast - by Type
- 8. Europe n-Hexane Market Analysis, Insights and Forecast, 2020-2032
- 8.1. Market Analysis, Insights and Forecast - by Type
- 8.1.1. n-Hexane
- 8.1.2. Isohexane
- 8.1.3. Neohexane
- 8.2. Market Analysis, Insights and Forecast - by Grade
- 8.2.1. Polymer Grade
- 8.2.2. Food Grade
- 8.2.3. Other Grades
- 8.3. Market Analysis, Insights and Forecast - by Application
- 8.3.1. Industrial Solvents
- 8.3.2. Edible Oil Extractant
- 8.3.3. Cleansing and Degreasing
- 8.3.4. Other Ap
- 8.1. Market Analysis, Insights and Forecast - by Type
- 9. South America n-Hexane Market Analysis, Insights and Forecast, 2020-2032
- 9.1. Market Analysis, Insights and Forecast - by Type
- 9.1.1. n-Hexane
- 9.1.2. Isohexane
- 9.1.3. Neohexane
- 9.2. Market Analysis, Insights and Forecast - by Grade
- 9.2.1. Polymer Grade
- 9.2.2. Food Grade
- 9.2.3. Other Grades
- 9.3. Market Analysis, Insights and Forecast - by Application
- 9.3.1. Industrial Solvents
- 9.3.2. Edible Oil Extractant
- 9.3.3. Cleansing and Degreasing
- 9.3.4. Other Ap
- 9.1. Market Analysis, Insights and Forecast - by Type
- 10. Middle East and Africa n-Hexane Market Analysis, Insights and Forecast, 2020-2032
- 10.1. Market Analysis, Insights and Forecast - by Type
- 10.1.1. n-Hexane
- 10.1.2. Isohexane
- 10.1.3. Neohexane
- 10.2. Market Analysis, Insights and Forecast - by Grade
- 10.2.1. Polymer Grade
- 10.2.2. Food Grade
- 10.2.3. Other Grades
- 10.3. Market Analysis, Insights and Forecast - by Application
- 10.3.1. Industrial Solvents
- 10.3.2. Edible Oil Extractant
- 10.3.3. Cleansing and Degreasing
- 10.3.4. Other Ap
- 10.1. Market Analysis, Insights and Forecast - by Type
- 11. Competitive Analysis
- 11.1. Global Market Share Analysis 2025
- 11.2. Company Profiles
- 11.2.1 Bharat Petroleum Corporation Limited (BPCL)
- 11.2.1.1. Overview
- 11.2.1.2. Products
- 11.2.1.3. SWOT Analysis
- 11.2.1.4. Recent Developments
- 11.2.1.5. Financials (Based on Availability)
- 11.2.2 China Petrochemical Corporation (Sinopec)
- 11.2.2.1. Overview
- 11.2.2.2. Products
- 11.2.2.3. SWOT Analysis
- 11.2.2.4. Recent Developments
- 11.2.2.5. Financials (Based on Availability)
- 11.2.3 Exxon Mobil Corporation
- 11.2.3.1. Overview
- 11.2.3.2. Products
- 11.2.3.3. SWOT Analysis
- 11.2.3.4. Recent Developments
- 11.2.3.5. Financials (Based on Availability)
- 11.2.4 GFS Chemicals Inc
- 11.2.4.1. Overview
- 11.2.4.2. Products
- 11.2.4.3. SWOT Analysis
- 11.2.4.4. Recent Developments
- 11.2.4.5. Financials (Based on Availability)
- 11.2.5 Hindustan Petroleum Corporation Limited (HPCL)
- 11.2.5.1. Overview
- 11.2.5.2. Products
- 11.2.5.3. SWOT Analysis
- 11.2.5.4. Recent Developments
- 11.2.5.5. Financials (Based on Availability)
- 11.2.6 Indian Oil Corporation Ltd
- 11.2.6.1. Overview
- 11.2.6.2. Products
- 11.2.6.3. SWOT Analysis
- 11.2.6.4. Recent Developments
- 11.2.6.5. Financials (Based on Availability)
- 11.2.7 Jun Yuan Petroleum Group
- 11.2.7.1. Overview
- 11.2.7.2. Products
- 11.2.7.3. SWOT Analysis
- 11.2.7.4. Recent Developments
- 11.2.7.5. Financials (Based on Availability)
- 11.2.8 Liaoning Yufeng Chemical Co Ltd
- 11.2.8.1. Overview
- 11.2.8.2. Products
- 11.2.8.3. SWOT Analysis
- 11.2.8.4. Recent Developments
- 11.2.8.5. Financials (Based on Availability)
- 11.2.9 Phillips 66 Company
- 11.2.9.1. Overview
- 11.2.9.2. Products
- 11.2.9.3. SWOT Analysis
- 11.2.9.4. Recent Developments
- 11.2.9.5. Financials (Based on Availability)
- 11.2.10 Rompetrol
- 11.2.10.1. Overview
- 11.2.10.2. Products
- 11.2.10.3. SWOT Analysis
- 11.2.10.4. Recent Developments
- 11.2.10.5. Financials (Based on Availability)
- 11.2.11 Shell plc
- 11.2.11.1. Overview
- 11.2.11.2. Products
- 11.2.11.3. SWOT Analysis
- 11.2.11.4. Recent Developments
- 11.2.11.5. Financials (Based on Availability)
- 11.2.12 Shenyang Huifeng Petrochemical Co Ltd
- 11.2.12.1. Overview
- 11.2.12.2. Products
- 11.2.12.3. SWOT Analysis
- 11.2.12.4. Recent Developments
- 11.2.12.5. Financials (Based on Availability)
- 11.2.13 Sumitomo Chemical Co Ltd
- 11.2.13.1. Overview
- 11.2.13.2. Products
- 11.2.13.3. SWOT Analysis
- 11.2.13.4. Recent Developments
- 11.2.13.5. Financials (Based on Availability)
- 11.2.14 THAI OIL GROUP*List Not Exhaustive
- 11.2.14.1. Overview
- 11.2.14.2. Products
- 11.2.14.3. SWOT Analysis
- 11.2.14.4. Recent Developments
- 11.2.14.5. Financials (Based on Availability)
- 11.2.1 Bharat Petroleum Corporation Limited (BPCL)
List of Figures
- Figure 1: Global n-Hexane Market Revenue Breakdown (Million, %) by Region 2025 & 2033
- Figure 2: Global n-Hexane Market Volume Breakdown (Billion, %) by Region 2025 & 2033
- Figure 3: Asia Pacific n-Hexane Market Revenue (Million), by Type 2025 & 2033
- Figure 4: Asia Pacific n-Hexane Market Volume (Billion), by Type 2025 & 2033
- Figure 5: Asia Pacific n-Hexane Market Revenue Share (%), by Type 2025 & 2033
- Figure 6: Asia Pacific n-Hexane Market Volume Share (%), by Type 2025 & 2033
- Figure 7: Asia Pacific n-Hexane Market Revenue (Million), by Grade 2025 & 2033
- Figure 8: Asia Pacific n-Hexane Market Volume (Billion), by Grade 2025 & 2033
- Figure 9: Asia Pacific n-Hexane Market Revenue Share (%), by Grade 2025 & 2033
- Figure 10: Asia Pacific n-Hexane Market Volume Share (%), by Grade 2025 & 2033
- Figure 11: Asia Pacific n-Hexane Market Revenue (Million), by Application 2025 & 2033
- Figure 12: Asia Pacific n-Hexane Market Volume (Billion), by Application 2025 & 2033
- Figure 13: Asia Pacific n-Hexane Market Revenue Share (%), by Application 2025 & 2033
- Figure 14: Asia Pacific n-Hexane Market Volume Share (%), by Application 2025 & 2033
- Figure 15: Asia Pacific n-Hexane Market Revenue (Million), by Country 2025 & 2033
- Figure 16: Asia Pacific n-Hexane Market Volume (Billion), by Country 2025 & 2033
- Figure 17: Asia Pacific n-Hexane Market Revenue Share (%), by Country 2025 & 2033
- Figure 18: Asia Pacific n-Hexane Market Volume Share (%), by Country 2025 & 2033
- Figure 19: North America n-Hexane Market Revenue (Million), by Type 2025 & 2033
- Figure 20: North America n-Hexane Market Volume (Billion), by Type 2025 & 2033
- Figure 21: North America n-Hexane Market Revenue Share (%), by Type 2025 & 2033
- Figure 22: North America n-Hexane Market Volume Share (%), by Type 2025 & 2033
- Figure 23: North America n-Hexane Market Revenue (Million), by Grade 2025 & 2033
- Figure 24: North America n-Hexane Market Volume (Billion), by Grade 2025 & 2033
- Figure 25: North America n-Hexane Market Revenue Share (%), by Grade 2025 & 2033
- Figure 26: North America n-Hexane Market Volume Share (%), by Grade 2025 & 2033
- Figure 27: North America n-Hexane Market Revenue (Million), by Application 2025 & 2033
- Figure 28: North America n-Hexane Market Volume (Billion), by Application 2025 & 2033
- Figure 29: North America n-Hexane Market Revenue Share (%), by Application 2025 & 2033
- Figure 30: North America n-Hexane Market Volume Share (%), by Application 2025 & 2033
- Figure 31: North America n-Hexane Market Revenue (Million), by Country 2025 & 2033
- Figure 32: North America n-Hexane Market Volume (Billion), by Country 2025 & 2033
- Figure 33: North America n-Hexane Market Revenue Share (%), by Country 2025 & 2033
- Figure 34: North America n-Hexane Market Volume Share (%), by Country 2025 & 2033
- Figure 35: Europe n-Hexane Market Revenue (Million), by Type 2025 & 2033
- Figure 36: Europe n-Hexane Market Volume (Billion), by Type 2025 & 2033
- Figure 37: Europe n-Hexane Market Revenue Share (%), by Type 2025 & 2033
- Figure 38: Europe n-Hexane Market Volume Share (%), by Type 2025 & 2033
- Figure 39: Europe n-Hexane Market Revenue (Million), by Grade 2025 & 2033
- Figure 40: Europe n-Hexane Market Volume (Billion), by Grade 2025 & 2033
- Figure 41: Europe n-Hexane Market Revenue Share (%), by Grade 2025 & 2033
- Figure 42: Europe n-Hexane Market Volume Share (%), by Grade 2025 & 2033
- Figure 43: Europe n-Hexane Market Revenue (Million), by Application 2025 & 2033
- Figure 44: Europe n-Hexane Market Volume (Billion), by Application 2025 & 2033
- Figure 45: Europe n-Hexane Market Revenue Share (%), by Application 2025 & 2033
- Figure 46: Europe n-Hexane Market Volume Share (%), by Application 2025 & 2033
- Figure 47: Europe n-Hexane Market Revenue (Million), by Country 2025 & 2033
- Figure 48: Europe n-Hexane Market Volume (Billion), by Country 2025 & 2033
- Figure 49: Europe n-Hexane Market Revenue Share (%), by Country 2025 & 2033
- Figure 50: Europe n-Hexane Market Volume Share (%), by Country 2025 & 2033
- Figure 51: South America n-Hexane Market Revenue (Million), by Type 2025 & 2033
- Figure 52: South America n-Hexane Market Volume (Billion), by Type 2025 & 2033
- Figure 53: South America n-Hexane Market Revenue Share (%), by Type 2025 & 2033
- Figure 54: South America n-Hexane Market Volume Share (%), by Type 2025 & 2033
- Figure 55: South America n-Hexane Market Revenue (Million), by Grade 2025 & 2033
- Figure 56: South America n-Hexane Market Volume (Billion), by Grade 2025 & 2033
- Figure 57: South America n-Hexane Market Revenue Share (%), by Grade 2025 & 2033
- Figure 58: South America n-Hexane Market Volume Share (%), by Grade 2025 & 2033
- Figure 59: South America n-Hexane Market Revenue (Million), by Application 2025 & 2033
- Figure 60: South America n-Hexane Market Volume (Billion), by Application 2025 & 2033
- Figure 61: South America n-Hexane Market Revenue Share (%), by Application 2025 & 2033
- Figure 62: South America n-Hexane Market Volume Share (%), by Application 2025 & 2033
- Figure 63: South America n-Hexane Market Revenue (Million), by Country 2025 & 2033
- Figure 64: South America n-Hexane Market Volume (Billion), by Country 2025 & 2033
- Figure 65: South America n-Hexane Market Revenue Share (%), by Country 2025 & 2033
- Figure 66: South America n-Hexane Market Volume Share (%), by Country 2025 & 2033
- Figure 67: Middle East and Africa n-Hexane Market Revenue (Million), by Type 2025 & 2033
- Figure 68: Middle East and Africa n-Hexane Market Volume (Billion), by Type 2025 & 2033
- Figure 69: Middle East and Africa n-Hexane Market Revenue Share (%), by Type 2025 & 2033
- Figure 70: Middle East and Africa n-Hexane Market Volume Share (%), by Type 2025 & 2033
- Figure 71: Middle East and Africa n-Hexane Market Revenue (Million), by Grade 2025 & 2033
- Figure 72: Middle East and Africa n-Hexane Market Volume (Billion), by Grade 2025 & 2033
- Figure 73: Middle East and Africa n-Hexane Market Revenue Share (%), by Grade 2025 & 2033
- Figure 74: Middle East and Africa n-Hexane Market Volume Share (%), by Grade 2025 & 2033
- Figure 75: Middle East and Africa n-Hexane Market Revenue (Million), by Application 2025 & 2033
- Figure 76: Middle East and Africa n-Hexane Market Volume (Billion), by Application 2025 & 2033
- Figure 77: Middle East and Africa n-Hexane Market Revenue Share (%), by Application 2025 & 2033
- Figure 78: Middle East and Africa n-Hexane Market Volume Share (%), by Application 2025 & 2033
- Figure 79: Middle East and Africa n-Hexane Market Revenue (Million), by Country 2025 & 2033
- Figure 80: Middle East and Africa n-Hexane Market Volume (Billion), by Country 2025 & 2033
- Figure 81: Middle East and Africa n-Hexane Market Revenue Share (%), by Country 2025 & 2033
- Figure 82: Middle East and Africa n-Hexane Market Volume Share (%), by Country 2025 & 2033
List of Tables
- Table 1: Global n-Hexane Market Revenue Million Forecast, by Type 2020 & 2033
- Table 2: Global n-Hexane Market Volume Billion Forecast, by Type 2020 & 2033
- Table 3: Global n-Hexane Market Revenue Million Forecast, by Grade 2020 & 2033
- Table 4: Global n-Hexane Market Volume Billion Forecast, by Grade 2020 & 2033
- Table 5: Global n-Hexane Market Revenue Million Forecast, by Application 2020 & 2033
- Table 6: Global n-Hexane Market Volume Billion Forecast, by Application 2020 & 2033
- Table 7: Global n-Hexane Market Revenue Million Forecast, by Region 2020 & 2033
- Table 8: Global n-Hexane Market Volume Billion Forecast, by Region 2020 & 2033
- Table 9: Global n-Hexane Market Revenue Million Forecast, by Type 2020 & 2033
- Table 10: Global n-Hexane Market Volume Billion Forecast, by Type 2020 & 2033
- Table 11: Global n-Hexane Market Revenue Million Forecast, by Grade 2020 & 2033
- Table 12: Global n-Hexane Market Volume Billion Forecast, by Grade 2020 & 2033
- Table 13: Global n-Hexane Market Revenue Million Forecast, by Application 2020 & 2033
- Table 14: Global n-Hexane Market Volume Billion Forecast, by Application 2020 & 2033
- Table 15: Global n-Hexane Market Revenue Million Forecast, by Country 2020 & 2033
- Table 16: Global n-Hexane Market Volume Billion Forecast, by Country 2020 & 2033
- Table 17: China n-Hexane Market Revenue (Million) Forecast, by Application 2020 & 2033
- Table 18: China n-Hexane Market Volume (Billion) Forecast, by Application 2020 & 2033
- Table 19: India n-Hexane Market Revenue (Million) Forecast, by Application 2020 & 2033
- Table 20: India n-Hexane Market Volume (Billion) Forecast, by Application 2020 & 2033
- Table 21: Japan n-Hexane Market Revenue (Million) Forecast, by Application 2020 & 2033
- Table 22: Japan n-Hexane Market Volume (Billion) Forecast, by Application 2020 & 2033
- Table 23: South Korea n-Hexane Market Revenue (Million) Forecast, by Application 2020 & 2033
- Table 24: South Korea n-Hexane Market Volume (Billion) Forecast, by Application 2020 & 2033
- Table 25: Malaysia n-Hexane Market Revenue (Million) Forecast, by Application 2020 & 2033
- Table 26: Malaysia n-Hexane Market Volume (Billion) Forecast, by Application 2020 & 2033
- Table 27: Thailand n-Hexane Market Revenue (Million) Forecast, by Application 2020 & 2033
- Table 28: Thailand n-Hexane Market Volume (Billion) Forecast, by Application 2020 & 2033
- Table 29: Indonesia n-Hexane Market Revenue (Million) Forecast, by Application 2020 & 2033
- Table 30: Indonesia n-Hexane Market Volume (Billion) Forecast, by Application 2020 & 2033
- Table 31: Vietnam n-Hexane Market Revenue (Million) Forecast, by Application 2020 & 2033
- Table 32: Vietnam n-Hexane Market Volume (Billion) Forecast, by Application 2020 & 2033
- Table 33: Rest of Asia Pacific n-Hexane Market Revenue (Million) Forecast, by Application 2020 & 2033
- Table 34: Rest of Asia Pacific n-Hexane Market Volume (Billion) Forecast, by Application 2020 & 2033
- Table 35: Global n-Hexane Market Revenue Million Forecast, by Type 2020 & 2033
- Table 36: Global n-Hexane Market Volume Billion Forecast, by Type 2020 & 2033
- Table 37: Global n-Hexane Market Revenue Million Forecast, by Grade 2020 & 2033
- Table 38: Global n-Hexane Market Volume Billion Forecast, by Grade 2020 & 2033
- Table 39: Global n-Hexane Market Revenue Million Forecast, by Application 2020 & 2033
- Table 40: Global n-Hexane Market Volume Billion Forecast, by Application 2020 & 2033
- Table 41: Global n-Hexane Market Revenue Million Forecast, by Country 2020 & 2033
- Table 42: Global n-Hexane Market Volume Billion Forecast, by Country 2020 & 2033
- Table 43: United States n-Hexane Market Revenue (Million) Forecast, by Application 2020 & 2033
- Table 44: United States n-Hexane Market Volume (Billion) Forecast, by Application 2020 & 2033
- Table 45: Canada n-Hexane Market Revenue (Million) Forecast, by Application 2020 & 2033
- Table 46: Canada n-Hexane Market Volume (Billion) Forecast, by Application 2020 & 2033
- Table 47: Mexico n-Hexane Market Revenue (Million) Forecast, by Application 2020 & 2033
- Table 48: Mexico n-Hexane Market Volume (Billion) Forecast, by Application 2020 & 2033
- Table 49: Global n-Hexane Market Revenue Million Forecast, by Type 2020 & 2033
- Table 50: Global n-Hexane Market Volume Billion Forecast, by Type 2020 & 2033
- Table 51: Global n-Hexane Market Revenue Million Forecast, by Grade 2020 & 2033
- Table 52: Global n-Hexane Market Volume Billion Forecast, by Grade 2020 & 2033
- Table 53: Global n-Hexane Market Revenue Million Forecast, by Application 2020 & 2033
- Table 54: Global n-Hexane Market Volume Billion Forecast, by Application 2020 & 2033
- Table 55: Global n-Hexane Market Revenue Million Forecast, by Country 2020 & 2033
- Table 56: Global n-Hexane Market Volume Billion Forecast, by Country 2020 & 2033
- Table 57: Germany n-Hexane Market Revenue (Million) Forecast, by Application 2020 & 2033
- Table 58: Germany n-Hexane Market Volume (Billion) Forecast, by Application 2020 & 2033
- Table 59: United Kingdom n-Hexane Market Revenue (Million) Forecast, by Application 2020 & 2033
- Table 60: United Kingdom n-Hexane Market Volume (Billion) Forecast, by Application 2020 & 2033
- Table 61: Italy n-Hexane Market Revenue (Million) Forecast, by Application 2020 & 2033
- Table 62: Italy n-Hexane Market Volume (Billion) Forecast, by Application 2020 & 2033
- Table 63: France n-Hexane Market Revenue (Million) Forecast, by Application 2020 & 2033
- Table 64: France n-Hexane Market Volume (Billion) Forecast, by Application 2020 & 2033
- Table 65: Spain n-Hexane Market Revenue (Million) Forecast, by Application 2020 & 2033
- Table 66: Spain n-Hexane Market Volume (Billion) Forecast, by Application 2020 & 2033
- Table 67: NORDIC n-Hexane Market Revenue (Million) Forecast, by Application 2020 & 2033
- Table 68: NORDIC n-Hexane Market Volume (Billion) Forecast, by Application 2020 & 2033
- Table 69: Turkey n-Hexane Market Revenue (Million) Forecast, by Application 2020 & 2033
- Table 70: Turkey n-Hexane Market Volume (Billion) Forecast, by Application 2020 & 2033
- Table 71: Russia n-Hexane Market Revenue (Million) Forecast, by Application 2020 & 2033
- Table 72: Russia n-Hexane Market Volume (Billion) Forecast, by Application 2020 & 2033
- Table 73: Rest of Europe n-Hexane Market Revenue (Million) Forecast, by Application 2020 & 2033
- Table 74: Rest of Europe n-Hexane Market Volume (Billion) Forecast, by Application 2020 & 2033
- Table 75: Global n-Hexane Market Revenue Million Forecast, by Type 2020 & 2033
- Table 76: Global n-Hexane Market Volume Billion Forecast, by Type 2020 & 2033
- Table 77: Global n-Hexane Market Revenue Million Forecast, by Grade 2020 & 2033
- Table 78: Global n-Hexane Market Volume Billion Forecast, by Grade 2020 & 2033
- Table 79: Global n-Hexane Market Revenue Million Forecast, by Application 2020 & 2033
- Table 80: Global n-Hexane Market Volume Billion Forecast, by Application 2020 & 2033
- Table 81: Global n-Hexane Market Revenue Million Forecast, by Country 2020 & 2033
- Table 82: Global n-Hexane Market Volume Billion Forecast, by Country 2020 & 2033
- Table 83: Brazil n-Hexane Market Revenue (Million) Forecast, by Application 2020 & 2033
- Table 84: Brazil n-Hexane Market Volume (Billion) Forecast, by Application 2020 & 2033
- Table 85: Argentina n-Hexane Market Revenue (Million) Forecast, by Application 2020 & 2033
- Table 86: Argentina n-Hexane Market Volume (Billion) Forecast, by Application 2020 & 2033
- Table 87: Colombia n-Hexane Market Revenue (Million) Forecast, by Application 2020 & 2033
- Table 88: Colombia n-Hexane Market Volume (Billion) Forecast, by Application 2020 & 2033
- Table 89: Rest of South America n-Hexane Market Revenue (Million) Forecast, by Application 2020 & 2033
- Table 90: Rest of South America n-Hexane Market Volume (Billion) Forecast, by Application 2020 & 2033
- Table 91: Global n-Hexane Market Revenue Million Forecast, by Type 2020 & 2033
- Table 92: Global n-Hexane Market Volume Billion Forecast, by Type 2020 & 2033
- Table 93: Global n-Hexane Market Revenue Million Forecast, by Grade 2020 & 2033
- Table 94: Global n-Hexane Market Volume Billion Forecast, by Grade 2020 & 2033
- Table 95: Global n-Hexane Market Revenue Million Forecast, by Application 2020 & 2033
- Table 96: Global n-Hexane Market Volume Billion Forecast, by Application 2020 & 2033
- Table 97: Global n-Hexane Market Revenue Million Forecast, by Country 2020 & 2033
- Table 98: Global n-Hexane Market Volume Billion Forecast, by Country 2020 & 2033
- Table 99: Saudi Arabia n-Hexane Market Revenue (Million) Forecast, by Application 2020 & 2033
- Table 100: Saudi Arabia n-Hexane Market Volume (Billion) Forecast, by Application 2020 & 2033
- Table 101: South Africa n-Hexane Market Revenue (Million) Forecast, by Application 2020 & 2033
- Table 102: South Africa n-Hexane Market Volume (Billion) Forecast, by Application 2020 & 2033
- Table 103: Nigeria n-Hexane Market Revenue (Million) Forecast, by Application 2020 & 2033
- Table 104: Nigeria n-Hexane Market Volume (Billion) Forecast, by Application 2020 & 2033
- Table 105: Qatar n-Hexane Market Revenue (Million) Forecast, by Application 2020 & 2033
- Table 106: Qatar n-Hexane Market Volume (Billion) Forecast, by Application 2020 & 2033
- Table 107: Egypt n-Hexane Market Revenue (Million) Forecast, by Application 2020 & 2033
- Table 108: Egypt n-Hexane Market Volume (Billion) Forecast, by Application 2020 & 2033
- Table 109: United Arab Emirates n-Hexane Market Revenue (Million) Forecast, by Application 2020 & 2033
- Table 110: United Arab Emirates n-Hexane Market Volume (Billion) Forecast, by Application 2020 & 2033
- Table 111: Rest of Middle East and Africa n-Hexane Market Revenue (Million) Forecast, by Application 2020 & 2033
- Table 112: Rest of Middle East and Africa n-Hexane Market Volume (Billion) Forecast, by Application 2020 & 2033
Frequently Asked Questions
1. What is the projected Compound Annual Growth Rate (CAGR) of the n-Hexane Market?
The projected CAGR is approximately 4.57%.
2. Which companies are prominent players in the n-Hexane Market?
Key companies in the market include Bharat Petroleum Corporation Limited (BPCL), China Petrochemical Corporation (Sinopec), Exxon Mobil Corporation, GFS Chemicals Inc, Hindustan Petroleum Corporation Limited (HPCL), Indian Oil Corporation Ltd, Jun Yuan Petroleum Group, Liaoning Yufeng Chemical Co Ltd, Phillips 66 Company, Rompetrol, Shell plc, Shenyang Huifeng Petrochemical Co Ltd, Sumitomo Chemical Co Ltd, THAI OIL GROUP*List Not Exhaustive.
3. What are the main segments of the n-Hexane Market?
The market segments include Type, Grade, Application.
4. Can you provide details about the market size?
The market size is estimated to be USD 2.24 Million as of 2022.
5. What are some drivers contributing to market growth?
Growing Demand from Petrochemical Industries; Increasing Demand for Edible Oil Extraction; Other Drivers.
6. What are the notable trends driving market growth?
Edible Oil Extraction to Dominate the Market.
7. Are there any restraints impacting market growth?
Growing Demand from Petrochemical Industries; Increasing Demand for Edible Oil Extraction; Other Drivers.
8. Can you provide examples of recent developments in the market?
March 2022: Phillips 66 announced its merger with Phillips 66 Partners. The merger resulted in Phillips 66 acquiring all limited partnership interests in PSXP not already owned by Phillips 66 and its affiliates.
9. What pricing options are available for accessing the report?
Pricing options include single-user, multi-user, and enterprise licenses priced at USD 4750, USD 5250, and USD 8750 respectively.
10. Is the market size provided in terms of value or volume?
The market size is provided in terms of value, measured in Million and volume, measured in Billion.
11. Are there any specific market keywords associated with the report?
Yes, the market keyword associated with the report is "n-Hexane Market," which aids in identifying and referencing the specific market segment covered.
12. How do I determine which pricing option suits my needs best?
The pricing options vary based on user requirements and access needs. Individual users may opt for single-user licenses, while businesses requiring broader access may choose multi-user or enterprise licenses for cost-effective access to the report.
13. Are there any additional resources or data provided in the n-Hexane Market report?
While the report offers comprehensive insights, it's advisable to review the specific contents or supplementary materials provided to ascertain if additional resources or data are available.
14. How can I stay updated on further developments or reports in the n-Hexane Market?
To stay informed about further developments, trends, and reports in the n-Hexane Market, consider subscribing to industry newsletters, following relevant companies and organizations, or regularly checking reputable industry news sources and publications.
Methodology
Step 1 - Identification of Relevant Samples Size from Population Database


Step 2 - Approaches for Defining Global Market Size (Value, Volume* & Price*)

Note*: In applicable scenarios
Step 3 - Data Sources
Primary Research
- Web Analytics
- Survey Reports
- Research Institute
- Latest Research Reports
- Opinion Leaders
Secondary Research
- Annual Reports
- White Paper
- Latest Press Release
- Industry Association
- Paid Database
- Investor Presentations

Step 4 - Data Triangulation
Involves using different sources of information in order to increase the validity of a study
These sources are likely to be stakeholders in a program - participants, other researchers, program staff, other community members, and so on.
Then we put all data in single framework & apply various statistical tools to find out the dynamic on the market.
During the analysis stage, feedback from the stakeholder groups would be compared to determine areas of agreement as well as areas of divergence