

Key Insights
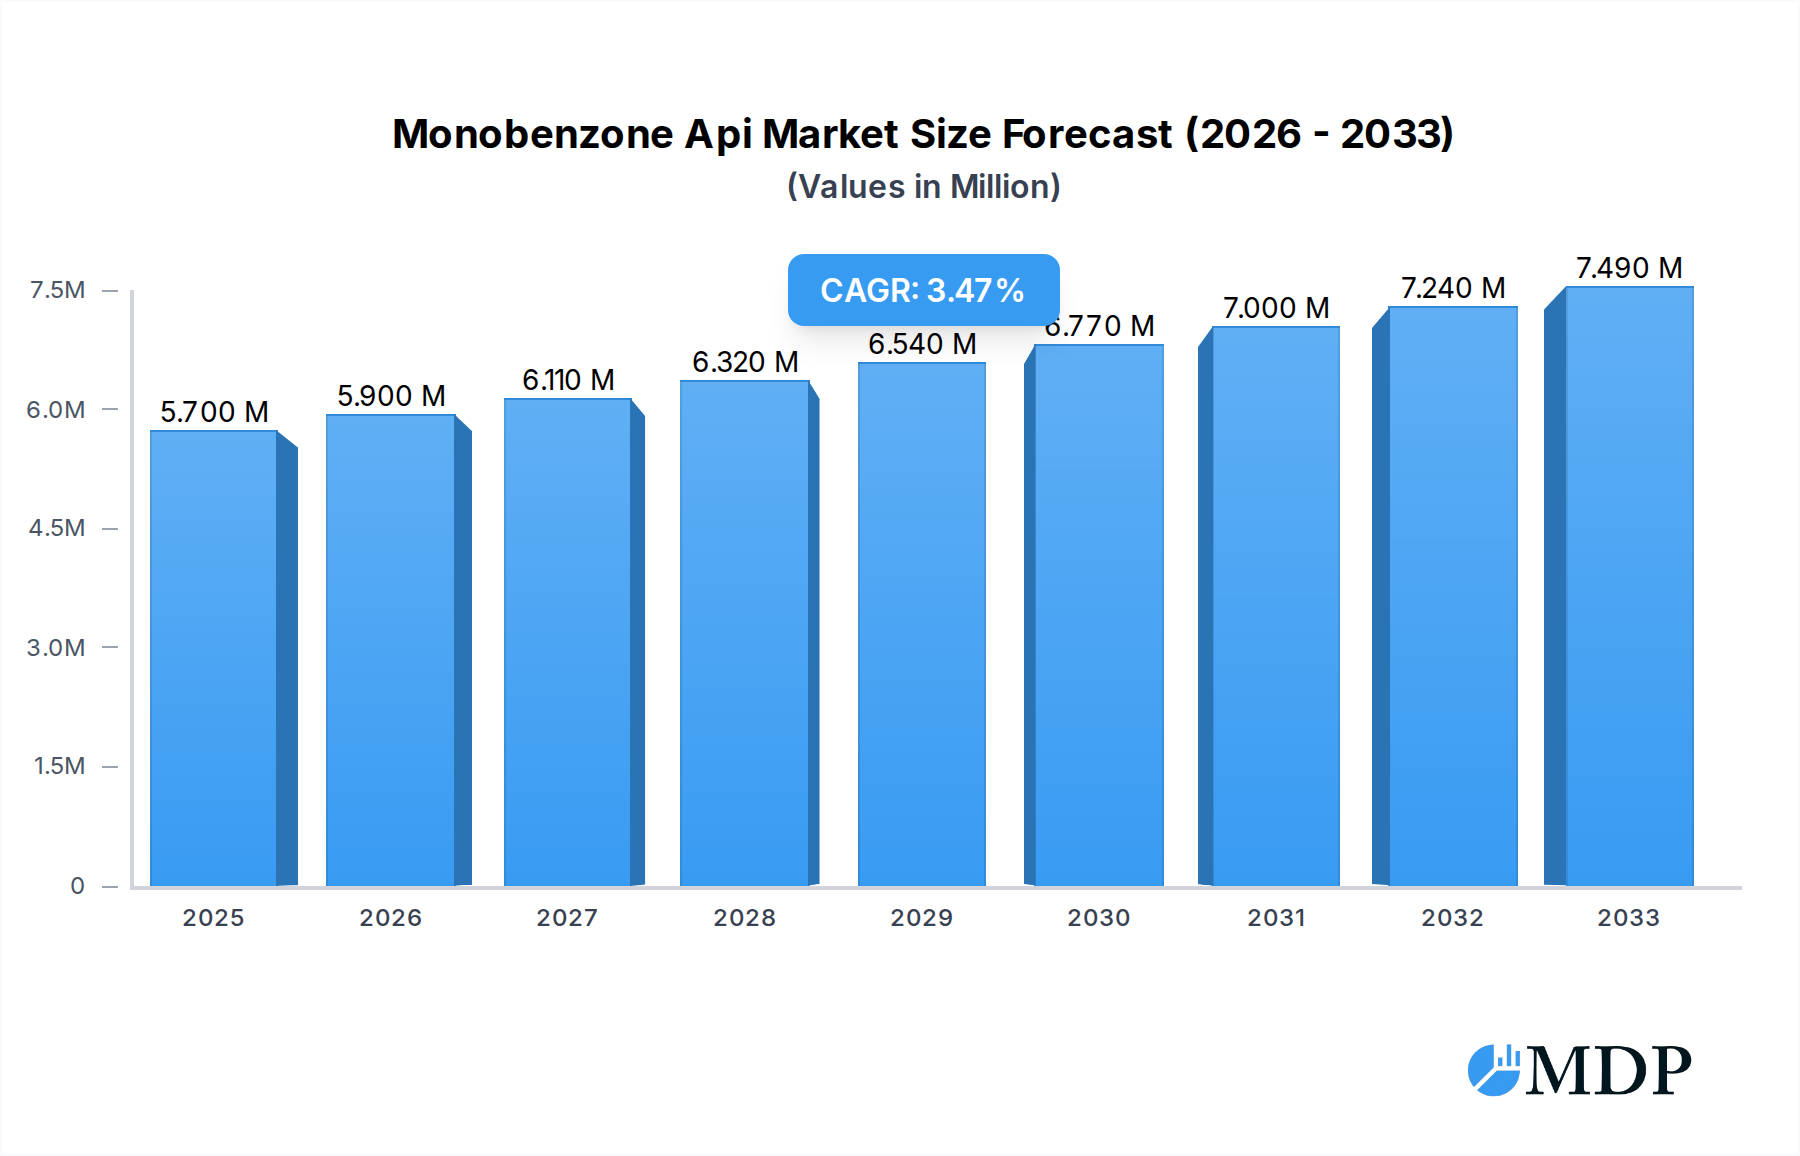
The Monobenzone API market is poised for steady expansion, projected to reach $5.7 million by 2025 with a Compound Annual Growth Rate (CAGR) of 3.6% through 2033. This growth is primarily propelled by the increasing demand within the pharmaceutical sector, where Monobenzone is a crucial active pharmaceutical ingredient for depigmentation treatments. The market benefits from ongoing research and development efforts focused on enhancing the efficacy and safety profiles of Monobenzone-based formulations, thereby broadening its therapeutic applications. Furthermore, advancements in manufacturing processes are contributing to improved product quality and accessibility, especially for high-purity grades like Min99% and Min98%, which are vital for pharmaceutical applications. Emerging economies, particularly in the Asia Pacific region, are expected to witness significant growth due to rising healthcare expenditures and a growing prevalence of dermatological conditions requiring depigmentation therapies.

Monobenzone Api Market Size (In Million)
Despite the positive outlook, the market faces certain restraints. These include stringent regulatory hurdles for drug approval, which can prolong product launch timelines and increase development costs. Additionally, the availability of alternative treatments for hyperpigmentation conditions, as well as potential side effects associated with Monobenzone use, could temper market growth. However, the inherent therapeutic advantages of Monobenzone API, coupled with ongoing innovation by key players such as Hubei Artec Biotechnology, Hangzhou Lin Ran Bio-tech, Wuhan Lullaby Pharmaceutical Chemical, and Xiangyang Furunda (Runtongda) Chemical, are expected to mitigate these challenges. The market is characterized by a concentration of key players, indicating a competitive landscape where strategic partnerships and product innovation will be crucial for sustained success. The forecast period anticipates a consistent upward trajectory, driven by a growing patient population seeking effective depigmentation solutions.
Monobenzone Api Company Market Share
Monobenzone API Market: Comprehensive Analysis and Future Outlook (2019-2033)
This in-depth report offers a detailed examination of the global Monobenzone API market, providing critical insights for pharmaceutical manufacturers, chemical suppliers, and industry stakeholders. Spanning a comprehensive study period from 2019 to 2033, with a base year of 2025, this analysis delves into market dynamics, growth drivers, leading segments, and future opportunities within this specialized sector.
Monobenzone API Market Dynamics & Concentration
The Monobenzone API market exhibits a moderate to high concentration, with a few key players dominating significant market share. Innovation drivers within this space are primarily fueled by advancements in manufacturing processes leading to higher purity grades (Min99%) and the continuous exploration of novel pharmaceutical applications. Regulatory frameworks, while generally supportive for pharmaceutical ingredients, can present stringent quality control and approval hurdles that influence market entry and expansion. Product substitutes, though limited, may emerge from alternative depigmentation treatments or cosmetic ingredients, necessitating continuous product differentiation. End-user trends point towards increasing demand for high-purity Monobenzone API in dermatological formulations and cosmetic applications, driven by a growing awareness of skin pigmentation disorders and cosmetic enhancement. Mergers and acquisition (M&A) activities are anticipated to play a strategic role in consolidating market share and expanding geographical reach. For instance, historical data indicates approximately XX M&A deals in the past five years, with leading companies like Hubei Artec Biotechnology and Hangzhou Lin Ran Bio-tech actively pursuing strategic acquisitions to bolster their portfolios. The market share distribution is currently estimated with major players holding collective market share of over 75%.
Monobenzone API Industry Trends & Analysis
The global Monobenzone API industry is poised for significant growth, driven by a confluence of factors including an expanding pharmaceutical sector, increasing prevalence of skin pigmentation disorders, and a burgeoning demand for cosmetic applications. The market is projected to witness a Compound Annual Growth Rate (CAGR) of approximately XX% over the forecast period of 2025–2033. Technological disruptions, particularly in the synthesis and purification of Monobenzone API, are leading to the availability of higher purity grades such as Min99%, which are crucial for pharmaceutical efficacy and safety. Consumer preferences are increasingly shifting towards evidence-based dermatological treatments and sophisticated cosmetic solutions, directly impacting the demand for high-quality APIs. Competitive dynamics within the industry are characterized by a focus on product quality, cost-effectiveness, and a robust supply chain. Market penetration for specialized Monobenzone API grades is expected to rise as research and development uncover new therapeutic and cosmetic applications. The historical period (2019–2024) saw a steady increase in market demand, with an estimated XX% growth driven by early adoption in niche dermatological treatments. The estimated market size for 2025 is projected to be in the range of XX million, with an anticipated growth to over XX million by 2033.
Leading Markets & Segments in Monobenzone API
The Monobenzone API market demonstrates distinct regional dominance and segment preference. North America currently leads as the dominant region, driven by a well-established pharmaceutical industry, advanced healthcare infrastructure, and a high consumer propensity for advanced dermatological treatments and cosmetic procedures. The United States, in particular, accounts for a substantial market share due to robust research and development activities and a strong regulatory framework that supports the approval of pharmaceutical-grade APIs.
Within the application segments, Pharmaceuticals represent the largest and most significant market, accounting for an estimated XX% of the total market share in 2025. This dominance is attributed to Monobenzone's established use in the treatment of vitiligo and other conditions causing localized hyperpigmentation. The demand for pharmaceutical-grade Monobenzone API, specifically Min99% purity, is paramount in this segment to ensure efficacy, patient safety, and compliance with stringent regulatory standards. Key drivers for this segment include:
- Increasing Prevalence of Pigmentation Disorders: Growing awareness and diagnosis of conditions like vitiligo are fueling demand for effective depigmentation treatments.
- Advanced Dermatological Research: Ongoing research into the mechanisms of pigmentation and the development of targeted therapies.
- Robust Healthcare Expenditure: High healthcare spending in developed nations supports the adoption of specialized treatments.
The Other application segment, encompassing cosmetic and research purposes, is also experiencing steady growth, projected to reach XX% of the market by 2033. This segment is driven by the demand for Monobenzone API in cosmetic formulations for skin lightening and specialized research applications. The Min98% purity grade finds significant traction in this segment due to its suitability for cosmetic applications and cost-effectiveness compared to higher purity grades. Key drivers for this segment include:
- Growing Cosmetic Industry: Expansion of the global beauty and personal care market, with a demand for skin-lightening and aesthetic enhancement products.
- Emerging Markets: Increasing disposable incomes in developing economies are driving consumer spending on cosmetic products.
- Research & Development: Utilization of Monobenzone API in scientific research exploring its pharmacological properties and potential new applications.
The Min99% type segment commands the highest value due to its stringent quality requirements for pharmaceutical use, representing approximately XX% of the market value in 2025. The Min98% segment, while slightly lower in value, offers a broader range of applications and is projected to witness considerable volume growth.
Monobenzone API Product Developments
Recent product developments in the Monobenzone API sector have focused on enhancing purity and optimizing manufacturing processes. Innovations are leading to the availability of ultra-pure Min99% Monobenzone API, crucial for advanced pharmaceutical formulations and clinical trials targeting specific dermatological conditions. Companies are also investing in green chemistry approaches to synthesize Monobenzone API more sustainably. These advancements not only improve product quality but also offer competitive advantages by meeting the evolving demands of the pharmaceutical and cosmetic industries for safe, effective, and environmentally responsible ingredients. The emphasis is on achieving superior bioavailability and reducing impurities for enhanced therapeutic outcomes.
Key Drivers of Monobenzone API Growth
The growth of the Monobenzone API market is propelled by several key factors. Technologically, advancements in synthetic chemistry and purification techniques are enabling the production of higher purity APIs, meeting stringent pharmaceutical standards. Economically, rising disposable incomes globally, particularly in emerging markets, are fueling demand for both advanced dermatological treatments and cosmetic products that utilize Monobenzone. Regulatory frameworks, while sometimes challenging, also drive growth by ensuring product quality and safety, thereby fostering trust among end-users and increasing adoption in regulated markets. The increasing prevalence of skin pigmentation disorders such as vitiligo is a significant epidemiological driver, creating a consistent need for effective depigmentation agents.
Challenges in the Monobenzone API Market
Despite robust growth prospects, the Monobenzone API market faces several challenges. Regulatory hurdles, including stringent approval processes and varying international standards for pharmaceutical ingredients, can impede market entry and product commercialization. Supply chain disruptions, particularly in sourcing raw materials and ensuring consistent production capacity, pose a significant risk, potentially leading to price volatility and shortages. Competitive pressures from alternative treatments and the ongoing development of new therapeutic approaches can also impact market share. Furthermore, the potential for adverse side effects associated with Monobenzone use necessitates rigorous research and development for safer application methods and formulations, requiring significant investment.
Emerging Opportunities in Monobenzone API
The Monobenzone API market is ripe with emerging opportunities. Technological breakthroughs in drug delivery systems and targeted therapy research could unlock new applications for Monobenzone API beyond its current uses, potentially in combination therapies. Strategic partnerships between API manufacturers and pharmaceutical companies are crucial for accelerating the development and commercialization of novel Monobenzone-based treatments. Market expansion into under-penetrated geographic regions with growing healthcare infrastructure and increasing consumer demand for dermatological solutions presents a significant growth avenue. Furthermore, the exploration of Monobenzone's potential in other therapeutic areas, driven by ongoing scientific research, could lead to diversification and increased market penetration.
Leading Players in the Monobenzone API Sector
- Hubei Artec Biotechnology
- Hangzhou Lin Ran Bio-tech
- Wuhan Lullaby Pharmaceutical Chemical
- Xiangyang Furunda (Runtongda) Chemical
Key Milestones in Monobenzone API Industry
- 2019: Increased research into novel synthesis pathways for higher purity Monobenzone API.
- 2020: Introduction of stricter quality control measures by regulatory bodies, enhancing pharmaceutical grade standards.
- 2021: Growing adoption of Monobenzone API in advanced cosmetic formulations beyond traditional dermatological uses.
- 2022: Significant investment in R&D by key players to explore new therapeutic applications and drug delivery methods.
- 2023: Expansion of manufacturing capacities by leading companies to meet rising global demand.
- 2024: Emergence of more sustainable and environmentally friendly production methods for Monobenzone API.
Strategic Outlook for Monobenzone API Market
The strategic outlook for the Monobenzone API market is exceptionally promising, driven by an upward trajectory in demand from both pharmaceutical and cosmetic sectors. Growth accelerators will include continued investment in research and development to broaden the therapeutic applications of Monobenzone and enhance its safety profile. Strategic collaborations between API manufacturers and research institutions will be pivotal in uncovering new market niches. Furthermore, market expansion into untapped geographical regions, coupled with a focus on product differentiation through high-purity grades like Min99%, will solidify competitive advantages and ensure sustained market growth. The market is expected to witness continuous innovation in manufacturing processes, leading to improved cost-efficiency and accessibility.
Monobenzone Api Segmentation
-
1. Application
- 1.1. Pharmaceuticals
- 1.2. Other
-
2. Type
- 2.1. Min99%
- 2.2. Min98%
Monobenzone Api Segmentation By Geography
-
1. North America
- 1.1. United States
- 1.2. Canada
- 1.3. Mexico
-
2. South America
- 2.1. Brazil
- 2.2. Argentina
- 2.3. Rest of South America
-
3. Europe
- 3.1. United Kingdom
- 3.2. Germany
- 3.3. France
- 3.4. Italy
- 3.5. Spain
- 3.6. Russia
- 3.7. Benelux
- 3.8. Nordics
- 3.9. Rest of Europe
-
4. Middle East & Africa
- 4.1. Turkey
- 4.2. Israel
- 4.3. GCC
- 4.4. North Africa
- 4.5. South Africa
- 4.6. Rest of Middle East & Africa
-
5. Asia Pacific
- 5.1. China
- 5.2. India
- 5.3. Japan
- 5.4. South Korea
- 5.5. ASEAN
- 5.6. Oceania
- 5.7. Rest of Asia Pacific
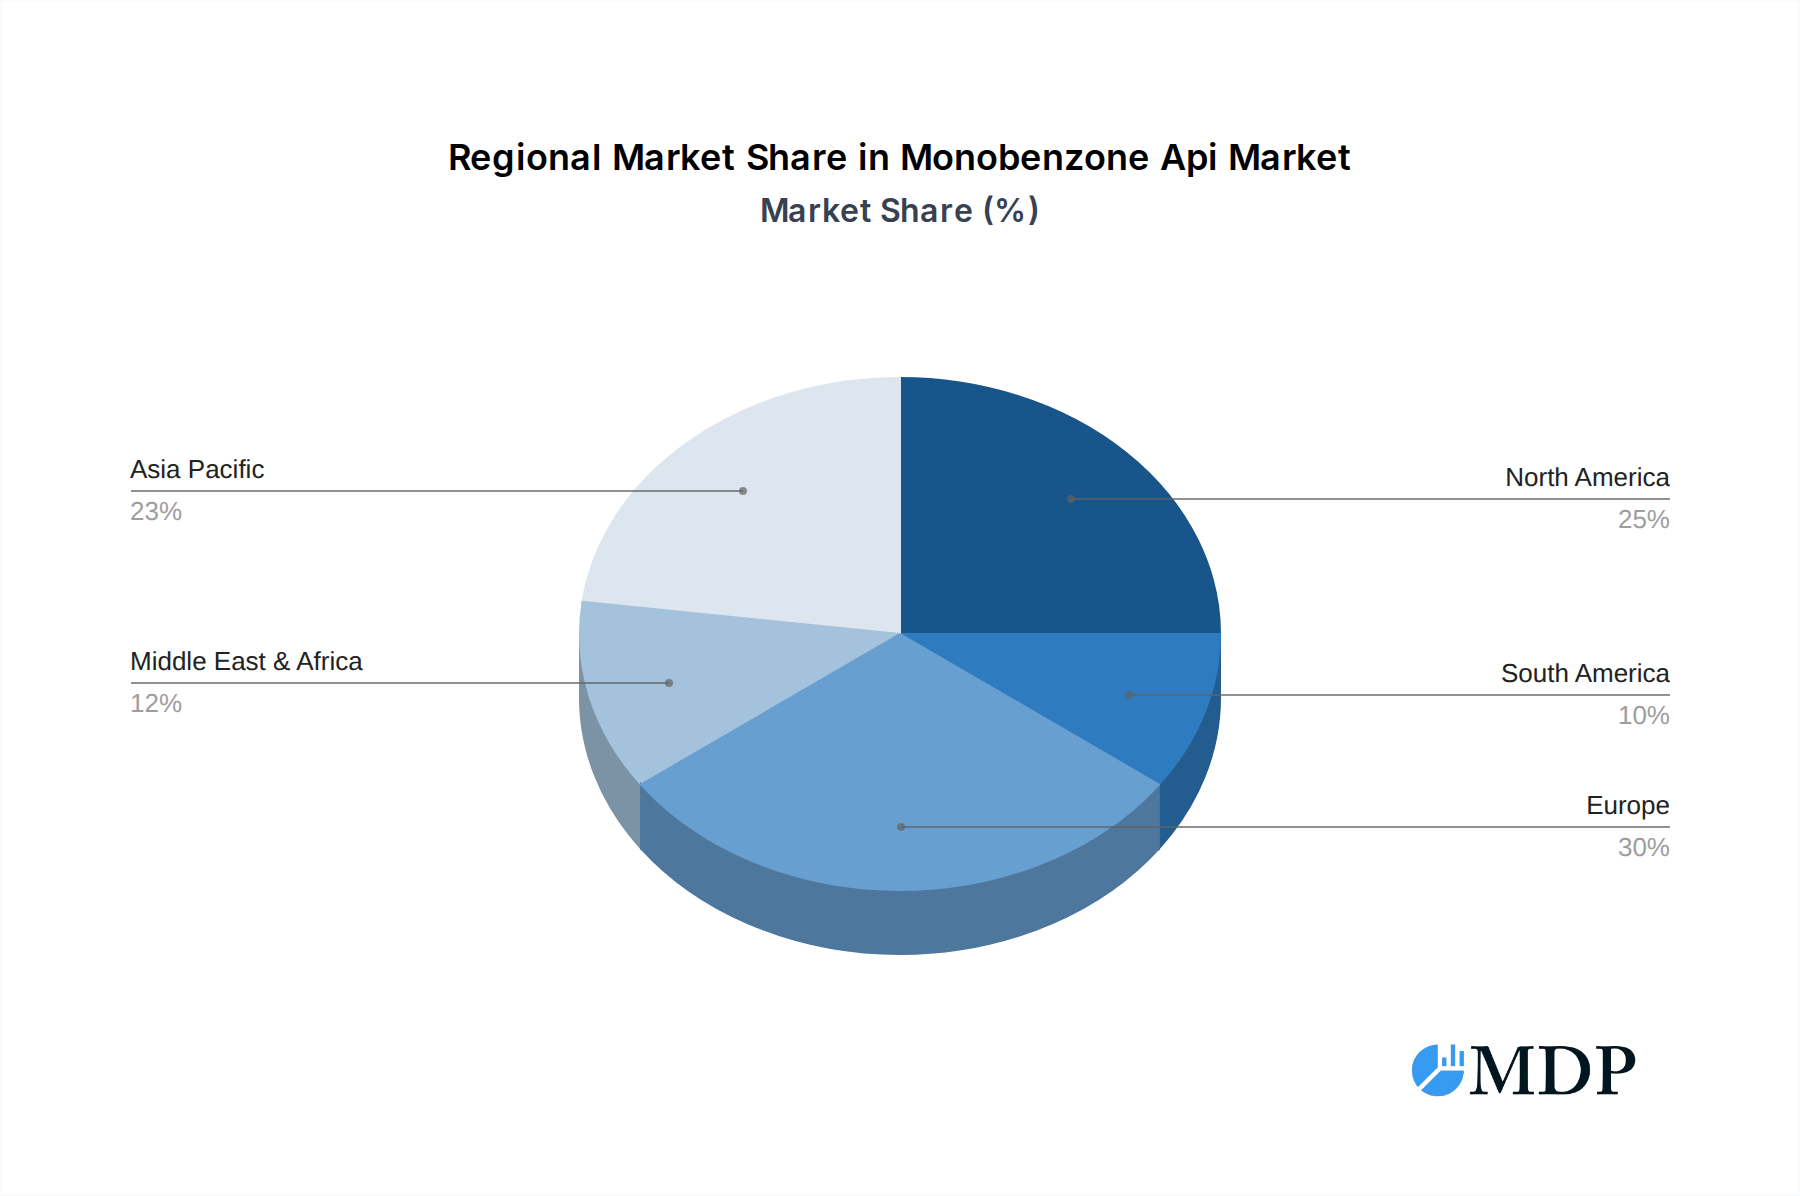
Monobenzone Api Regional Market Share
Geographic Coverage of Monobenzone Api
Monobenzone Api REPORT HIGHLIGHTS
| Aspects | Details |
|---|---|
| Study Period | 2020-2034 |
| Base Year | 2025 |
| Estimated Year | 2026 |
| Forecast Period | 2026-2034 |
| Historical Period | 2020-2025 |
| Growth Rate | CAGR of 3.6% from 2020-2034 |
| Segmentation |
|
Table of Contents
- 1. Introduction
- 1.1. Research Scope
- 1.2. Market Segmentation
- 1.3. Research Methodology
- 1.4. Definitions and Assumptions
- 2. Executive Summary
- 2.1. Introduction
- 3. Market Dynamics
- 3.1. Introduction
- 3.2. Market Drivers
- 3.3. Market Restrains
- 3.4. Market Trends
- 4. Market Factor Analysis
- 4.1. Porters Five Forces
- 4.2. Supply/Value Chain
- 4.3. PESTEL analysis
- 4.4. Market Entropy
- 4.5. Patent/Trademark Analysis
- 5. Global Monobenzone Api Analysis, Insights and Forecast, 2020-2032
- 5.1. Market Analysis, Insights and Forecast - by Application
- 5.1.1. Pharmaceuticals
- 5.1.2. Other
- 5.2. Market Analysis, Insights and Forecast - by Type
- 5.2.1. Min99%
- 5.2.2. Min98%
- 5.3. Market Analysis, Insights and Forecast - by Region
- 5.3.1. North America
- 5.3.2. South America
- 5.3.3. Europe
- 5.3.4. Middle East & Africa
- 5.3.5. Asia Pacific
- 5.1. Market Analysis, Insights and Forecast - by Application
- 6. North America Monobenzone Api Analysis, Insights and Forecast, 2020-2032
- 6.1. Market Analysis, Insights and Forecast - by Application
- 6.1.1. Pharmaceuticals
- 6.1.2. Other
- 6.2. Market Analysis, Insights and Forecast - by Type
- 6.2.1. Min99%
- 6.2.2. Min98%
- 6.1. Market Analysis, Insights and Forecast - by Application
- 7. South America Monobenzone Api Analysis, Insights and Forecast, 2020-2032
- 7.1. Market Analysis, Insights and Forecast - by Application
- 7.1.1. Pharmaceuticals
- 7.1.2. Other
- 7.2. Market Analysis, Insights and Forecast - by Type
- 7.2.1. Min99%
- 7.2.2. Min98%
- 7.1. Market Analysis, Insights and Forecast - by Application
- 8. Europe Monobenzone Api Analysis, Insights and Forecast, 2020-2032
- 8.1. Market Analysis, Insights and Forecast - by Application
- 8.1.1. Pharmaceuticals
- 8.1.2. Other
- 8.2. Market Analysis, Insights and Forecast - by Type
- 8.2.1. Min99%
- 8.2.2. Min98%
- 8.1. Market Analysis, Insights and Forecast - by Application
- 9. Middle East & Africa Monobenzone Api Analysis, Insights and Forecast, 2020-2032
- 9.1. Market Analysis, Insights and Forecast - by Application
- 9.1.1. Pharmaceuticals
- 9.1.2. Other
- 9.2. Market Analysis, Insights and Forecast - by Type
- 9.2.1. Min99%
- 9.2.2. Min98%
- 9.1. Market Analysis, Insights and Forecast - by Application
- 10. Asia Pacific Monobenzone Api Analysis, Insights and Forecast, 2020-2032
- 10.1. Market Analysis, Insights and Forecast - by Application
- 10.1.1. Pharmaceuticals
- 10.1.2. Other
- 10.2. Market Analysis, Insights and Forecast - by Type
- 10.2.1. Min99%
- 10.2.2. Min98%
- 10.1. Market Analysis, Insights and Forecast - by Application
- 11. Competitive Analysis
- 11.1. Global Market Share Analysis 2025
- 11.2. Company Profiles
- 11.2.1 Hubei Artec Biotechnology
- 11.2.1.1. Overview
- 11.2.1.2. Products
- 11.2.1.3. SWOT Analysis
- 11.2.1.4. Recent Developments
- 11.2.1.5. Financials (Based on Availability)
- 11.2.2 Hangzhou Lin Ran Bio-tech
- 11.2.2.1. Overview
- 11.2.2.2. Products
- 11.2.2.3. SWOT Analysis
- 11.2.2.4. Recent Developments
- 11.2.2.5. Financials (Based on Availability)
- 11.2.3 Wuhan Lullaby Pharmaceutical Chemical
- 11.2.3.1. Overview
- 11.2.3.2. Products
- 11.2.3.3. SWOT Analysis
- 11.2.3.4. Recent Developments
- 11.2.3.5. Financials (Based on Availability)
- 11.2.4 Xiangyang Furunda (Runtongda) Chemical
- 11.2.4.1. Overview
- 11.2.4.2. Products
- 11.2.4.3. SWOT Analysis
- 11.2.4.4. Recent Developments
- 11.2.4.5. Financials (Based on Availability)
- 11.2.1 Hubei Artec Biotechnology
List of Figures
- Figure 1: Global Monobenzone Api Revenue Breakdown (million, %) by Region 2025 & 2033
- Figure 2: North America Monobenzone Api Revenue (million), by Application 2025 & 2033
- Figure 3: North America Monobenzone Api Revenue Share (%), by Application 2025 & 2033
- Figure 4: North America Monobenzone Api Revenue (million), by Type 2025 & 2033
- Figure 5: North America Monobenzone Api Revenue Share (%), by Type 2025 & 2033
- Figure 6: North America Monobenzone Api Revenue (million), by Country 2025 & 2033
- Figure 7: North America Monobenzone Api Revenue Share (%), by Country 2025 & 2033
- Figure 8: South America Monobenzone Api Revenue (million), by Application 2025 & 2033
- Figure 9: South America Monobenzone Api Revenue Share (%), by Application 2025 & 2033
- Figure 10: South America Monobenzone Api Revenue (million), by Type 2025 & 2033
- Figure 11: South America Monobenzone Api Revenue Share (%), by Type 2025 & 2033
- Figure 12: South America Monobenzone Api Revenue (million), by Country 2025 & 2033
- Figure 13: South America Monobenzone Api Revenue Share (%), by Country 2025 & 2033
- Figure 14: Europe Monobenzone Api Revenue (million), by Application 2025 & 2033
- Figure 15: Europe Monobenzone Api Revenue Share (%), by Application 2025 & 2033
- Figure 16: Europe Monobenzone Api Revenue (million), by Type 2025 & 2033
- Figure 17: Europe Monobenzone Api Revenue Share (%), by Type 2025 & 2033
- Figure 18: Europe Monobenzone Api Revenue (million), by Country 2025 & 2033
- Figure 19: Europe Monobenzone Api Revenue Share (%), by Country 2025 & 2033
- Figure 20: Middle East & Africa Monobenzone Api Revenue (million), by Application 2025 & 2033
- Figure 21: Middle East & Africa Monobenzone Api Revenue Share (%), by Application 2025 & 2033
- Figure 22: Middle East & Africa Monobenzone Api Revenue (million), by Type 2025 & 2033
- Figure 23: Middle East & Africa Monobenzone Api Revenue Share (%), by Type 2025 & 2033
- Figure 24: Middle East & Africa Monobenzone Api Revenue (million), by Country 2025 & 2033
- Figure 25: Middle East & Africa Monobenzone Api Revenue Share (%), by Country 2025 & 2033
- Figure 26: Asia Pacific Monobenzone Api Revenue (million), by Application 2025 & 2033
- Figure 27: Asia Pacific Monobenzone Api Revenue Share (%), by Application 2025 & 2033
- Figure 28: Asia Pacific Monobenzone Api Revenue (million), by Type 2025 & 2033
- Figure 29: Asia Pacific Monobenzone Api Revenue Share (%), by Type 2025 & 2033
- Figure 30: Asia Pacific Monobenzone Api Revenue (million), by Country 2025 & 2033
- Figure 31: Asia Pacific Monobenzone Api Revenue Share (%), by Country 2025 & 2033
List of Tables
- Table 1: Global Monobenzone Api Revenue million Forecast, by Application 2020 & 2033
- Table 2: Global Monobenzone Api Revenue million Forecast, by Type 2020 & 2033
- Table 3: Global Monobenzone Api Revenue million Forecast, by Region 2020 & 2033
- Table 4: Global Monobenzone Api Revenue million Forecast, by Application 2020 & 2033
- Table 5: Global Monobenzone Api Revenue million Forecast, by Type 2020 & 2033
- Table 6: Global Monobenzone Api Revenue million Forecast, by Country 2020 & 2033
- Table 7: United States Monobenzone Api Revenue (million) Forecast, by Application 2020 & 2033
- Table 8: Canada Monobenzone Api Revenue (million) Forecast, by Application 2020 & 2033
- Table 9: Mexico Monobenzone Api Revenue (million) Forecast, by Application 2020 & 2033
- Table 10: Global Monobenzone Api Revenue million Forecast, by Application 2020 & 2033
- Table 11: Global Monobenzone Api Revenue million Forecast, by Type 2020 & 2033
- Table 12: Global Monobenzone Api Revenue million Forecast, by Country 2020 & 2033
- Table 13: Brazil Monobenzone Api Revenue (million) Forecast, by Application 2020 & 2033
- Table 14: Argentina Monobenzone Api Revenue (million) Forecast, by Application 2020 & 2033
- Table 15: Rest of South America Monobenzone Api Revenue (million) Forecast, by Application 2020 & 2033
- Table 16: Global Monobenzone Api Revenue million Forecast, by Application 2020 & 2033
- Table 17: Global Monobenzone Api Revenue million Forecast, by Type 2020 & 2033
- Table 18: Global Monobenzone Api Revenue million Forecast, by Country 2020 & 2033
- Table 19: United Kingdom Monobenzone Api Revenue (million) Forecast, by Application 2020 & 2033
- Table 20: Germany Monobenzone Api Revenue (million) Forecast, by Application 2020 & 2033
- Table 21: France Monobenzone Api Revenue (million) Forecast, by Application 2020 & 2033
- Table 22: Italy Monobenzone Api Revenue (million) Forecast, by Application 2020 & 2033
- Table 23: Spain Monobenzone Api Revenue (million) Forecast, by Application 2020 & 2033
- Table 24: Russia Monobenzone Api Revenue (million) Forecast, by Application 2020 & 2033
- Table 25: Benelux Monobenzone Api Revenue (million) Forecast, by Application 2020 & 2033
- Table 26: Nordics Monobenzone Api Revenue (million) Forecast, by Application 2020 & 2033
- Table 27: Rest of Europe Monobenzone Api Revenue (million) Forecast, by Application 2020 & 2033
- Table 28: Global Monobenzone Api Revenue million Forecast, by Application 2020 & 2033
- Table 29: Global Monobenzone Api Revenue million Forecast, by Type 2020 & 2033
- Table 30: Global Monobenzone Api Revenue million Forecast, by Country 2020 & 2033
- Table 31: Turkey Monobenzone Api Revenue (million) Forecast, by Application 2020 & 2033
- Table 32: Israel Monobenzone Api Revenue (million) Forecast, by Application 2020 & 2033
- Table 33: GCC Monobenzone Api Revenue (million) Forecast, by Application 2020 & 2033
- Table 34: North Africa Monobenzone Api Revenue (million) Forecast, by Application 2020 & 2033
- Table 35: South Africa Monobenzone Api Revenue (million) Forecast, by Application 2020 & 2033
- Table 36: Rest of Middle East & Africa Monobenzone Api Revenue (million) Forecast, by Application 2020 & 2033
- Table 37: Global Monobenzone Api Revenue million Forecast, by Application 2020 & 2033
- Table 38: Global Monobenzone Api Revenue million Forecast, by Type 2020 & 2033
- Table 39: Global Monobenzone Api Revenue million Forecast, by Country 2020 & 2033
- Table 40: China Monobenzone Api Revenue (million) Forecast, by Application 2020 & 2033
- Table 41: India Monobenzone Api Revenue (million) Forecast, by Application 2020 & 2033
- Table 42: Japan Monobenzone Api Revenue (million) Forecast, by Application 2020 & 2033
- Table 43: South Korea Monobenzone Api Revenue (million) Forecast, by Application 2020 & 2033
- Table 44: ASEAN Monobenzone Api Revenue (million) Forecast, by Application 2020 & 2033
- Table 45: Oceania Monobenzone Api Revenue (million) Forecast, by Application 2020 & 2033
- Table 46: Rest of Asia Pacific Monobenzone Api Revenue (million) Forecast, by Application 2020 & 2033
Frequently Asked Questions
1. What is the projected Compound Annual Growth Rate (CAGR) of the Monobenzone Api?
The projected CAGR is approximately 3.6%.
2. Which companies are prominent players in the Monobenzone Api?
Key companies in the market include Hubei Artec Biotechnology, Hangzhou Lin Ran Bio-tech, Wuhan Lullaby Pharmaceutical Chemical, Xiangyang Furunda (Runtongda) Chemical.
3. What are the main segments of the Monobenzone Api?
The market segments include Application, Type.
4. Can you provide details about the market size?
The market size is estimated to be USD 5.7 million as of 2022.
5. What are some drivers contributing to market growth?
N/A
6. What are the notable trends driving market growth?
N/A
7. Are there any restraints impacting market growth?
N/A
8. Can you provide examples of recent developments in the market?
N/A
9. What pricing options are available for accessing the report?
Pricing options include single-user, multi-user, and enterprise licenses priced at USD 4250.00, USD 6375.00, and USD 8500.00 respectively.
10. Is the market size provided in terms of value or volume?
The market size is provided in terms of value, measured in million.
11. Are there any specific market keywords associated with the report?
Yes, the market keyword associated with the report is "Monobenzone Api," which aids in identifying and referencing the specific market segment covered.
12. How do I determine which pricing option suits my needs best?
The pricing options vary based on user requirements and access needs. Individual users may opt for single-user licenses, while businesses requiring broader access may choose multi-user or enterprise licenses for cost-effective access to the report.
13. Are there any additional resources or data provided in the Monobenzone Api report?
While the report offers comprehensive insights, it's advisable to review the specific contents or supplementary materials provided to ascertain if additional resources or data are available.
14. How can I stay updated on further developments or reports in the Monobenzone Api?
To stay informed about further developments, trends, and reports in the Monobenzone Api, consider subscribing to industry newsletters, following relevant companies and organizations, or regularly checking reputable industry news sources and publications.
Methodology
Step 1 - Identification of Relevant Samples Size from Population Database


Step 2 - Approaches for Defining Global Market Size (Value, Volume* & Price*)

Note*: In applicable scenarios
Step 3 - Data Sources
Primary Research
- Web Analytics
- Survey Reports
- Research Institute
- Latest Research Reports
- Opinion Leaders
Secondary Research
- Annual Reports
- White Paper
- Latest Press Release
- Industry Association
- Paid Database
- Investor Presentations

Step 4 - Data Triangulation
Involves using different sources of information in order to increase the validity of a study
These sources are likely to be stakeholders in a program - participants, other researchers, program staff, other community members, and so on.
Then we put all data in single framework & apply various statistical tools to find out the dynamic on the market.
During the analysis stage, feedback from the stakeholder groups would be compared to determine areas of agreement as well as areas of divergence