

Key Insights
The Mono Ethylene Glycol (MEG) market is poised for substantial expansion, fueled by its essential role in antifreeze, polyester production, and coolant applications. This analysis, covering the period up to 2033, forecasts a robust Compound Annual Growth Rate (CAGR) of 6.5%. While the historical market size is not explicitly detailed, projections indicate a significant growth trajectory. The market is estimated to reach $42.6 billion by 2025, its base year, building upon steady increases from previous years. Key growth drivers include escalating demand from the construction and automotive sectors, increased global infrastructure development, and the rising adoption of polyester fibers in textiles and packaging. Furthermore, advancements in MEG production technology are enhancing efficiency and reducing costs, supporting market expansion.
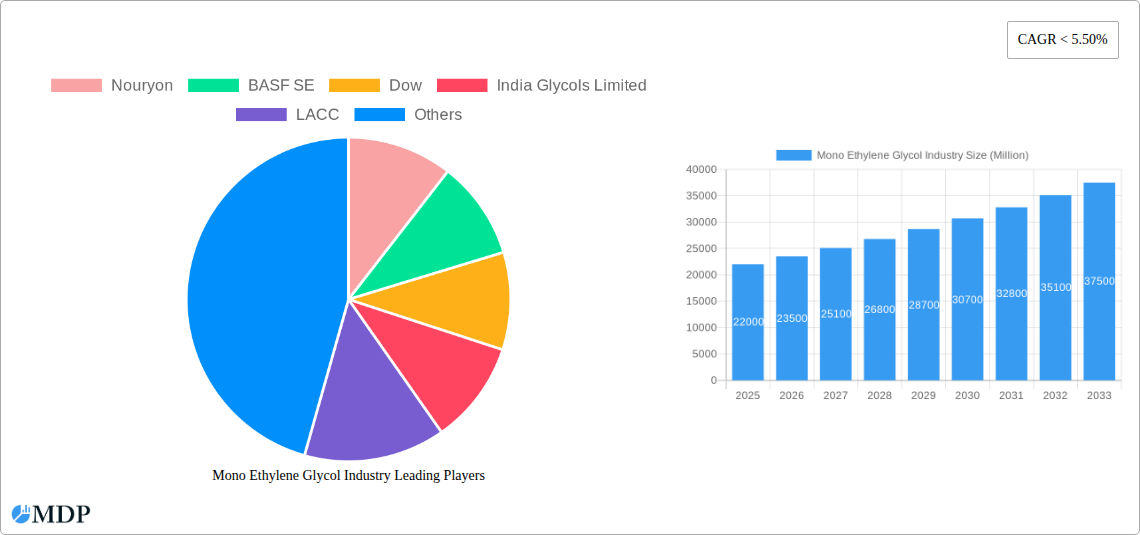
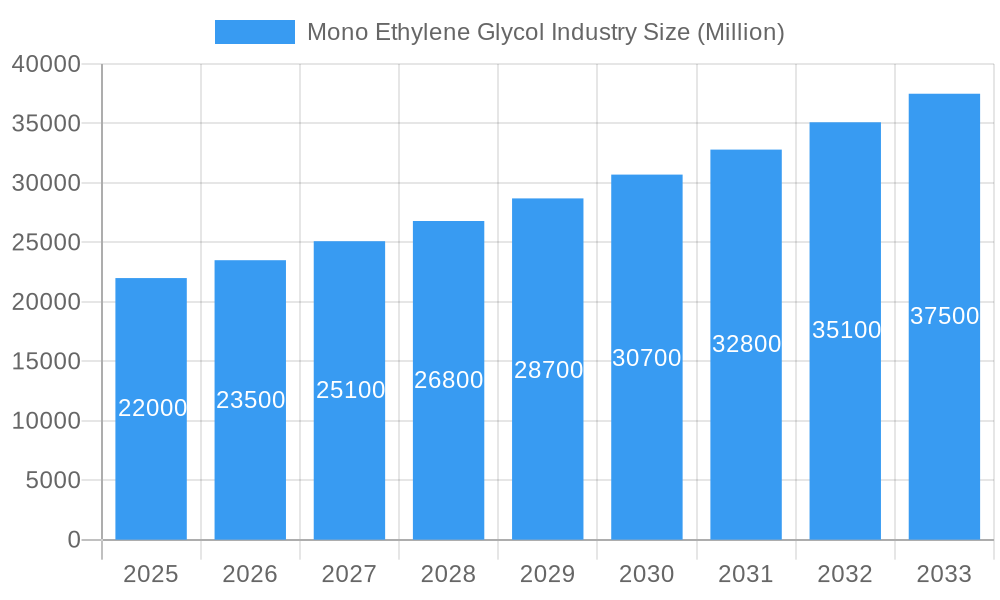
Mono Ethylene Glycol Industry Market Size (In Billion)
The forecast period (2025-2033) anticipates sustained growth, particularly driven by industrialization in emerging economies, especially within the Asia-Pacific region. Opportunities also arise from the growing demand for sustainable packaging and renewable energy solutions, where MEG plays a pivotal role. Continuous innovation in MEG production, including efficient catalytic processes and energy management, will bolster market competitiveness. Industry participants must proactively manage risks associated with raw material price volatility and evolving environmental regulations to ensure continued success.
Mono Ethylene Glycol Industry Company Market Share
Mono Ethylene Glycol (MEG) Industry Market Report: 2019-2033
This comprehensive report provides an in-depth analysis of the global Mono Ethylene Glycol (MEG) industry, offering invaluable insights for stakeholders, investors, and industry professionals. Covering the period from 2019 to 2033, with a focus on 2025, this report dissects market dynamics, trends, leading players, and future opportunities within the MEG sector. Download now to gain a competitive edge.
Mono Ethylene Glycol Industry Market Dynamics & Concentration
The global Mono Ethylene Glycol (MEG) market is characterized by a moderate level of concentration, with several multinational corporations holding significant market share. The industry exhibits considerable interplay between innovation, regulatory frameworks, and the presence of substitute products. Market share data for 2024 indicates that the top five players (Nouryon, BASF SE, Dow, LyondellBasell, and SABIC) collectively account for approximately xx% of the global MEG market. This concentration is influenced by economies of scale and substantial capital investment requirements in MEG production facilities.
- Innovation Drivers: Ongoing R&D efforts focus on enhancing MEG production efficiency, reducing environmental impact, and exploring new applications.
- Regulatory Frameworks: Stringent environmental regulations concerning emissions and waste disposal significantly impact production costs and operational practices.
- Product Substitutes: While MEG possesses unique properties, some applications may utilize alternative chemicals, creating competitive pressure.
- End-User Trends: Growing demand from the polyester fiber, antifreeze, and PET bottle industries drives MEG market growth.
- M&A Activities: The past five years have witnessed xx M&A deals in the MEG industry, primarily focused on consolidating market share and gaining access to new technologies.
Mono Ethylene Glycol Industry Industry Trends & Analysis
The MEG market experienced a CAGR of xx% during the historical period (2019-2024), driven by robust demand from key end-use sectors. This growth trajectory is projected to continue, with an estimated CAGR of xx% during the forecast period (2025-2033). The increasing demand for polyester fibers, particularly in the textile and apparel industries, significantly contributes to this positive outlook. Technological advancements in MEG production processes, aimed at improving efficiency and reducing costs, are further boosting market expansion. The market penetration of MEG in various applications remains high, with substantial scope for further growth in emerging economies. Competitive dynamics are characterized by price fluctuations influenced by raw material availability and global economic conditions.
Leading Markets & Segments in Mono Ethylene Glycol Industry
The Asia-Pacific region holds the dominant position in the global MEG market, accounting for approximately xx% of the total volume in 2024. This dominance is attributed to several factors:
- Key Drivers in Asia-Pacific:
- Rapid industrialization and urbanization.
- Strong growth in the textile and packaging industries.
- Favorable government policies supporting infrastructure development.
- Large-scale production facilities strategically located in the region.
The detailed dominance analysis shows that China and India are the major consumers within the Asia-Pacific region. Their burgeoning economies, rapid population growth, and increasing consumption of goods dependent on MEG (polyester fibers, PET bottles) contribute to their significant market share. Other regions, including North America and Europe, also exhibit substantial MEG consumption, albeit at a relatively lower scale than Asia-Pacific.
Mono Ethylene Glycol Industry Product Developments
Recent product developments in the MEG industry primarily revolve around improving production efficiency and reducing environmental impact. Innovations in process technology, such as the implementation of more energy-efficient reactors and improved separation techniques, are leading to cost reductions and enhanced sustainability. The focus on developing high-purity MEG to meet the increasingly stringent demands of sophisticated applications, like high-performance polyester fibers, also drives product innovation. The market fit of these new products is largely determined by their cost-effectiveness and ability to comply with environmental regulations.
Key Drivers of Mono Ethylene Glycol Industry Growth
Several factors fuel the growth of the MEG industry:
- Technological Advancements: Innovations in production processes lead to higher efficiency and lower costs.
- Economic Growth: Expanding economies, particularly in emerging markets, significantly increase demand for MEG-based products.
- Favorable Government Policies: Supportive policies promoting industrial development and infrastructure investment further stimulate market growth. For example, government initiatives focused on sustainable manufacturing processes are incentivizing MEG producers to adopt greener technologies.
Challenges in the Mono Ethylene Glycol Industry Market
The MEG industry faces several challenges:
- Fluctuating Raw Material Prices: The price volatility of ethylene, a key raw material, directly impacts MEG production costs.
- Intense Competition: The presence of numerous established players creates intense competition, leading to price pressures.
- Environmental Regulations: Compliance with stringent environmental norms necessitates investments in pollution control technologies, increasing operational costs. These regulatory hurdles lead to an increase in production costs by approximately xx%.
Emerging Opportunities in Mono Ethylene Glycol Industry
Long-term growth in the MEG industry is poised to be driven by several emerging opportunities:
The increasing demand for renewable and sustainable materials presents a significant growth avenue for MEG producers. Strategic partnerships focused on developing bio-based MEG production methods will be crucial for capitalizing on this trend. Market expansion into developing economies, where demand is steadily growing, offers substantial potential for industry participants. Furthermore, innovations focused on high-performance MEG applications will open new market segments.
Leading Players in the Mono Ethylene Glycol Industry Sector
- Nouryon
- BASF SE
- Dow
- India Glycols Limited
- LACC
- LyondellBasell Industries Holdings BV
- Mitsubishi Chemical Corporation
- Nan Ya Plastics Corporation
- Reliance Industries Limited
- Royal Dutch Shell PLC
- SABIC
- Solventis
- *List Not Exhaustive
Key Milestones in Mono Ethylene Glycol Industry Industry
- November 2021: SABIC announced the initial startup of Ethylene Glycol Plant -3, increasing MEG production capacity by 700,000 metric tons annually.
- January 2022: ExxonMobil and SABIC launched a new MEG unit with an annual capacity of 1.1 Million metric tons, significantly expanding Gulf Coast production.
Strategic Outlook for Mono Ethylene Glycol Industry Market
The future of the MEG market looks promising, driven by strong demand from key end-use sectors and continued technological advancements. Strategic partnerships focused on sustainability and expansion into new markets will be key to capturing significant growth opportunities. The focus on efficiency, cost reduction, and sustainable practices will play a critical role in shaping the future competitive landscape. The market is expected to experience continued growth, driven by an increasing global population and the growing demand for consumer goods and infrastructure projects.
Mono Ethylene Glycol Industry Segmentation
-
1. Application
- 1.1. Polyester Fiber
- 1.2. PET Bottle
- 1.3. PET Film
- 1.4. Antifreeze
- 1.5. Industrial
-
2. End-user Industry
- 2.1. Textile
- 2.2. Packaging
- 2.3. Plastic
- 2.4. Automotive and Transportation
- 2.5. Other End-user Industries (Electronics, Paints)
Mono Ethylene Glycol Industry Segmentation By Geography
-
1. Asia Pacific
- 1.1. China
- 1.2. India
- 1.3. Japan
- 1.4. South Korea
- 1.5. Rest of Asia Pacific
-
2. North America
- 2.1. US
- 2.2. Canada
- 2.3. Mexico
-
3. Europe
- 3.1. Germany
- 3.2. UK
- 3.3. Italy
- 3.4. France
- 3.5. Rest of Europe
-
4. South America
- 4.1. Brazil
- 4.2. Argentina
- 4.3. Rest of South America
- 5. Middle East
-
6. Saudi Arabia
- 6.1. South Africa
- 6.2. Rest of Middle East
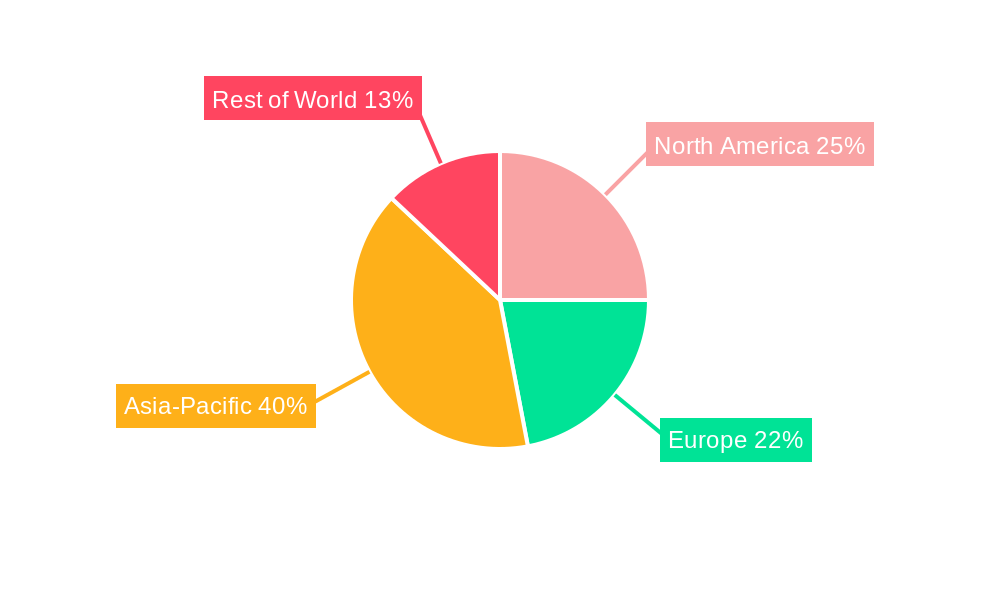
Mono Ethylene Glycol Industry Regional Market Share
Geographic Coverage of Mono Ethylene Glycol Industry
Mono Ethylene Glycol Industry REPORT HIGHLIGHTS
| Aspects | Details |
|---|---|
| Study Period | 2020-2034 |
| Base Year | 2025 |
| Estimated Year | 2026 |
| Forecast Period | 2026-2034 |
| Historical Period | 2020-2025 |
| Growth Rate | CAGR of 6.5% from 2020-2034 |
| Segmentation |
|
Table of Contents
- 1. Introduction
- 1.1. Research Scope
- 1.2. Market Segmentation
- 1.3. Research Objective
- 1.4. Definitions and Assumptions
- 2. Executive Summary
- 2.1. Market Snapshot
- 3. Market Dynamics
- 3.1. Market Drivers
- 3.2. Market Restrains
- 3.3. Market Trends
- 3.4. Market Opportunities
- 4. Market Factor Analysis
- 4.1. Porters Five Forces
- 4.1.1. Bargaining Power of Suppliers
- 4.1.2. Bargaining Power of Buyers
- 4.1.3. Threat of New Entrants
- 4.1.4. Threat of Substitutes
- 4.1.5. Competitive Rivalry
- 4.2. PESTEL analysis
- 4.3. BCG Analysis
- 4.3.1. Stars (High Growth, High Market Share)
- 4.3.2. Cash Cows (Low Growth, High Market Share)
- 4.3.3. Question Mark (High Growth, Low Market Share)
- 4.3.4. Dogs (Low Growth, Low Market Share)
- 4.4. Ansoff Matrix Analysis
- 4.5. Supply Chain Analysis
- 4.6. Regulatory Landscape
- 4.7. Current Market Potential and Opportunity Assessment (TAM–SAM–SOM Framework)
- 4.8. MDP Analyst Note
- 4.1. Porters Five Forces
- 5. Market Analysis, Insights and Forecast 2021-2033
- 5.1. Market Analysis, Insights and Forecast - by Application
- 5.1.1. Polyester Fiber
- 5.1.2. PET Bottle
- 5.1.3. PET Film
- 5.1.4. Antifreeze
- 5.1.5. Industrial
- 5.2. Market Analysis, Insights and Forecast - by End-user Industry
- 5.2.1. Textile
- 5.2.2. Packaging
- 5.2.3. Plastic
- 5.2.4. Automotive and Transportation
- 5.2.5. Other End-user Industries (Electronics, Paints)
- 5.3. Market Analysis, Insights and Forecast - by Region
- 5.3.1. Asia Pacific
- 5.3.2. North America
- 5.3.3. Europe
- 5.3.4. South America
- 5.3.5. Middle East
- 5.3.6. Saudi Arabia
- 5.1. Market Analysis, Insights and Forecast - by Application
- 6. Global Mono Ethylene Glycol Industry Analysis, Insights and Forecast, 2021-2033
- 6.1. Market Analysis, Insights and Forecast - by Application
- 6.1.1. Polyester Fiber
- 6.1.2. PET Bottle
- 6.1.3. PET Film
- 6.1.4. Antifreeze
- 6.1.5. Industrial
- 6.2. Market Analysis, Insights and Forecast - by End-user Industry
- 6.2.1. Textile
- 6.2.2. Packaging
- 6.2.3. Plastic
- 6.2.4. Automotive and Transportation
- 6.2.5. Other End-user Industries (Electronics, Paints)
- 6.1. Market Analysis, Insights and Forecast - by Application
- 7. Asia Pacific Mono Ethylene Glycol Industry Analysis, Insights and Forecast, 2020-2032
- 7.1. Market Analysis, Insights and Forecast - by Application
- 7.1.1. Polyester Fiber
- 7.1.2. PET Bottle
- 7.1.3. PET Film
- 7.1.4. Antifreeze
- 7.1.5. Industrial
- 7.2. Market Analysis, Insights and Forecast - by End-user Industry
- 7.2.1. Textile
- 7.2.2. Packaging
- 7.2.3. Plastic
- 7.2.4. Automotive and Transportation
- 7.2.5. Other End-user Industries (Electronics, Paints)
- 7.1. Market Analysis, Insights and Forecast - by Application
- 8. North America Mono Ethylene Glycol Industry Analysis, Insights and Forecast, 2020-2032
- 8.1. Market Analysis, Insights and Forecast - by Application
- 8.1.1. Polyester Fiber
- 8.1.2. PET Bottle
- 8.1.3. PET Film
- 8.1.4. Antifreeze
- 8.1.5. Industrial
- 8.2. Market Analysis, Insights and Forecast - by End-user Industry
- 8.2.1. Textile
- 8.2.2. Packaging
- 8.2.3. Plastic
- 8.2.4. Automotive and Transportation
- 8.2.5. Other End-user Industries (Electronics, Paints)
- 8.1. Market Analysis, Insights and Forecast - by Application
- 9. Europe Mono Ethylene Glycol Industry Analysis, Insights and Forecast, 2020-2032
- 9.1. Market Analysis, Insights and Forecast - by Application
- 9.1.1. Polyester Fiber
- 9.1.2. PET Bottle
- 9.1.3. PET Film
- 9.1.4. Antifreeze
- 9.1.5. Industrial
- 9.2. Market Analysis, Insights and Forecast - by End-user Industry
- 9.2.1. Textile
- 9.2.2. Packaging
- 9.2.3. Plastic
- 9.2.4. Automotive and Transportation
- 9.2.5. Other End-user Industries (Electronics, Paints)
- 9.1. Market Analysis, Insights and Forecast - by Application
- 10. South America Mono Ethylene Glycol Industry Analysis, Insights and Forecast, 2020-2032
- 10.1. Market Analysis, Insights and Forecast - by Application
- 10.1.1. Polyester Fiber
- 10.1.2. PET Bottle
- 10.1.3. PET Film
- 10.1.4. Antifreeze
- 10.1.5. Industrial
- 10.2. Market Analysis, Insights and Forecast - by End-user Industry
- 10.2.1. Textile
- 10.2.2. Packaging
- 10.2.3. Plastic
- 10.2.4. Automotive and Transportation
- 10.2.5. Other End-user Industries (Electronics, Paints)
- 10.1. Market Analysis, Insights and Forecast - by Application
- 11. Middle East Mono Ethylene Glycol Industry Analysis, Insights and Forecast, 2020-2032
- 11.1. Market Analysis, Insights and Forecast - by Application
- 11.1.1. Polyester Fiber
- 11.1.2. PET Bottle
- 11.1.3. PET Film
- 11.1.4. Antifreeze
- 11.1.5. Industrial
- 11.2. Market Analysis, Insights and Forecast - by End-user Industry
- 11.2.1. Textile
- 11.2.2. Packaging
- 11.2.3. Plastic
- 11.2.4. Automotive and Transportation
- 11.2.5. Other End-user Industries (Electronics, Paints)
- 11.1. Market Analysis, Insights and Forecast - by Application
- 12. Saudi Arabia Mono Ethylene Glycol Industry Analysis, Insights and Forecast, 2020-2032
- 12.1. Market Analysis, Insights and Forecast - by Application
- 12.1.1. Polyester Fiber
- 12.1.2. PET Bottle
- 12.1.3. PET Film
- 12.1.4. Antifreeze
- 12.1.5. Industrial
- 12.2. Market Analysis, Insights and Forecast - by End-user Industry
- 12.2.1. Textile
- 12.2.2. Packaging
- 12.2.3. Plastic
- 12.2.4. Automotive and Transportation
- 12.2.5. Other End-user Industries (Electronics, Paints)
- 12.1. Market Analysis, Insights and Forecast - by Application
- 13. Competitive Analysis
- 13.1. Company Profiles
- 13.1.1 Nouryon
- 13.1.1.1. Company Overview
- 13.1.1.2. Products
- 13.1.1.3. Company Financials
- 13.1.1.4. SWOT Analysis
- 13.1.2 BASF SE
- 13.1.2.1. Company Overview
- 13.1.2.2. Products
- 13.1.2.3. Company Financials
- 13.1.2.4. SWOT Analysis
- 13.1.3 Dow
- 13.1.3.1. Company Overview
- 13.1.3.2. Products
- 13.1.3.3. Company Financials
- 13.1.3.4. SWOT Analysis
- 13.1.4 India Glycols Limited
- 13.1.4.1. Company Overview
- 13.1.4.2. Products
- 13.1.4.3. Company Financials
- 13.1.4.4. SWOT Analysis
- 13.1.5 LACC
- 13.1.5.1. Company Overview
- 13.1.5.2. Products
- 13.1.5.3. Company Financials
- 13.1.5.4. SWOT Analysis
- 13.1.6 LyondellBasell Industries Holdings BV
- 13.1.6.1. Company Overview
- 13.1.6.2. Products
- 13.1.6.3. Company Financials
- 13.1.6.4. SWOT Analysis
- 13.1.7 Mitsubishi Chemical Corporation
- 13.1.7.1. Company Overview
- 13.1.7.2. Products
- 13.1.7.3. Company Financials
- 13.1.7.4. SWOT Analysis
- 13.1.8 Nan Ya Plastics Corporation
- 13.1.8.1. Company Overview
- 13.1.8.2. Products
- 13.1.8.3. Company Financials
- 13.1.8.4. SWOT Analysis
- 13.1.9 Reliance Industries Limited
- 13.1.9.1. Company Overview
- 13.1.9.2. Products
- 13.1.9.3. Company Financials
- 13.1.9.4. SWOT Analysis
- 13.1.10 Royal Dutch Shell PLC
- 13.1.10.1. Company Overview
- 13.1.10.2. Products
- 13.1.10.3. Company Financials
- 13.1.10.4. SWOT Analysis
- 13.1.11 SABIC
- 13.1.11.1. Company Overview
- 13.1.11.2. Products
- 13.1.11.3. Company Financials
- 13.1.11.4. SWOT Analysis
- 13.1.12 Solventis*List Not Exhaustive
- 13.1.12.1. Company Overview
- 13.1.12.2. Products
- 13.1.12.3. Company Financials
- 13.1.12.4. SWOT Analysis
- 13.1.1 Nouryon
- 13.2. Market Entropy
- 13.2.1 Company's Key Areas Served
- 13.2.2 Recent Developments
- 13.3. Company Market Share Analysis 2025
- 13.3.1 Top 5 Companies Market Share Analysis
- 13.3.2 Top 3 Companies Market Share Analysis
- 13.4. List of Potential Customers
- 14. Research Methodology
List of Figures
- Figure 1: Global Mono Ethylene Glycol Industry Revenue Breakdown (billion, %) by Region 2025 & 2033
- Figure 2: Asia Pacific Mono Ethylene Glycol Industry Revenue (billion), by Application 2025 & 2033
- Figure 3: Asia Pacific Mono Ethylene Glycol Industry Revenue Share (%), by Application 2025 & 2033
- Figure 4: Asia Pacific Mono Ethylene Glycol Industry Revenue (billion), by End-user Industry 2025 & 2033
- Figure 5: Asia Pacific Mono Ethylene Glycol Industry Revenue Share (%), by End-user Industry 2025 & 2033
- Figure 6: Asia Pacific Mono Ethylene Glycol Industry Revenue (billion), by Country 2025 & 2033
- Figure 7: Asia Pacific Mono Ethylene Glycol Industry Revenue Share (%), by Country 2025 & 2033
- Figure 8: North America Mono Ethylene Glycol Industry Revenue (billion), by Application 2025 & 2033
- Figure 9: North America Mono Ethylene Glycol Industry Revenue Share (%), by Application 2025 & 2033
- Figure 10: North America Mono Ethylene Glycol Industry Revenue (billion), by End-user Industry 2025 & 2033
- Figure 11: North America Mono Ethylene Glycol Industry Revenue Share (%), by End-user Industry 2025 & 2033
- Figure 12: North America Mono Ethylene Glycol Industry Revenue (billion), by Country 2025 & 2033
- Figure 13: North America Mono Ethylene Glycol Industry Revenue Share (%), by Country 2025 & 2033
- Figure 14: Europe Mono Ethylene Glycol Industry Revenue (billion), by Application 2025 & 2033
- Figure 15: Europe Mono Ethylene Glycol Industry Revenue Share (%), by Application 2025 & 2033
- Figure 16: Europe Mono Ethylene Glycol Industry Revenue (billion), by End-user Industry 2025 & 2033
- Figure 17: Europe Mono Ethylene Glycol Industry Revenue Share (%), by End-user Industry 2025 & 2033
- Figure 18: Europe Mono Ethylene Glycol Industry Revenue (billion), by Country 2025 & 2033
- Figure 19: Europe Mono Ethylene Glycol Industry Revenue Share (%), by Country 2025 & 2033
- Figure 20: South America Mono Ethylene Glycol Industry Revenue (billion), by Application 2025 & 2033
- Figure 21: South America Mono Ethylene Glycol Industry Revenue Share (%), by Application 2025 & 2033
- Figure 22: South America Mono Ethylene Glycol Industry Revenue (billion), by End-user Industry 2025 & 2033
- Figure 23: South America Mono Ethylene Glycol Industry Revenue Share (%), by End-user Industry 2025 & 2033
- Figure 24: South America Mono Ethylene Glycol Industry Revenue (billion), by Country 2025 & 2033
- Figure 25: South America Mono Ethylene Glycol Industry Revenue Share (%), by Country 2025 & 2033
- Figure 26: Middle East Mono Ethylene Glycol Industry Revenue (billion), by Application 2025 & 2033
- Figure 27: Middle East Mono Ethylene Glycol Industry Revenue Share (%), by Application 2025 & 2033
- Figure 28: Middle East Mono Ethylene Glycol Industry Revenue (billion), by End-user Industry 2025 & 2033
- Figure 29: Middle East Mono Ethylene Glycol Industry Revenue Share (%), by End-user Industry 2025 & 2033
- Figure 30: Middle East Mono Ethylene Glycol Industry Revenue (billion), by Country 2025 & 2033
- Figure 31: Middle East Mono Ethylene Glycol Industry Revenue Share (%), by Country 2025 & 2033
- Figure 32: Saudi Arabia Mono Ethylene Glycol Industry Revenue (billion), by Application 2025 & 2033
- Figure 33: Saudi Arabia Mono Ethylene Glycol Industry Revenue Share (%), by Application 2025 & 2033
- Figure 34: Saudi Arabia Mono Ethylene Glycol Industry Revenue (billion), by End-user Industry 2025 & 2033
- Figure 35: Saudi Arabia Mono Ethylene Glycol Industry Revenue Share (%), by End-user Industry 2025 & 2033
- Figure 36: Saudi Arabia Mono Ethylene Glycol Industry Revenue (billion), by Country 2025 & 2033
- Figure 37: Saudi Arabia Mono Ethylene Glycol Industry Revenue Share (%), by Country 2025 & 2033
List of Tables
- Table 1: Global Mono Ethylene Glycol Industry Revenue billion Forecast, by Application 2020 & 2033
- Table 2: Global Mono Ethylene Glycol Industry Revenue billion Forecast, by End-user Industry 2020 & 2033
- Table 3: Global Mono Ethylene Glycol Industry Revenue billion Forecast, by Region 2020 & 2033
- Table 4: Global Mono Ethylene Glycol Industry Revenue billion Forecast, by Application 2020 & 2033
- Table 5: Global Mono Ethylene Glycol Industry Revenue billion Forecast, by End-user Industry 2020 & 2033
- Table 6: Global Mono Ethylene Glycol Industry Revenue billion Forecast, by Country 2020 & 2033
- Table 7: China Mono Ethylene Glycol Industry Revenue (billion) Forecast, by Application 2020 & 2033
- Table 8: India Mono Ethylene Glycol Industry Revenue (billion) Forecast, by Application 2020 & 2033
- Table 9: Japan Mono Ethylene Glycol Industry Revenue (billion) Forecast, by Application 2020 & 2033
- Table 10: South Korea Mono Ethylene Glycol Industry Revenue (billion) Forecast, by Application 2020 & 2033
- Table 11: Rest of Asia Pacific Mono Ethylene Glycol Industry Revenue (billion) Forecast, by Application 2020 & 2033
- Table 12: Global Mono Ethylene Glycol Industry Revenue billion Forecast, by Application 2020 & 2033
- Table 13: Global Mono Ethylene Glycol Industry Revenue billion Forecast, by End-user Industry 2020 & 2033
- Table 14: Global Mono Ethylene Glycol Industry Revenue billion Forecast, by Country 2020 & 2033
- Table 15: US Mono Ethylene Glycol Industry Revenue (billion) Forecast, by Application 2020 & 2033
- Table 16: Canada Mono Ethylene Glycol Industry Revenue (billion) Forecast, by Application 2020 & 2033
- Table 17: Mexico Mono Ethylene Glycol Industry Revenue (billion) Forecast, by Application 2020 & 2033
- Table 18: Global Mono Ethylene Glycol Industry Revenue billion Forecast, by Application 2020 & 2033
- Table 19: Global Mono Ethylene Glycol Industry Revenue billion Forecast, by End-user Industry 2020 & 2033
- Table 20: Global Mono Ethylene Glycol Industry Revenue billion Forecast, by Country 2020 & 2033
- Table 21: Germany Mono Ethylene Glycol Industry Revenue (billion) Forecast, by Application 2020 & 2033
- Table 22: UK Mono Ethylene Glycol Industry Revenue (billion) Forecast, by Application 2020 & 2033
- Table 23: Italy Mono Ethylene Glycol Industry Revenue (billion) Forecast, by Application 2020 & 2033
- Table 24: France Mono Ethylene Glycol Industry Revenue (billion) Forecast, by Application 2020 & 2033
- Table 25: Rest of Europe Mono Ethylene Glycol Industry Revenue (billion) Forecast, by Application 2020 & 2033
- Table 26: Global Mono Ethylene Glycol Industry Revenue billion Forecast, by Application 2020 & 2033
- Table 27: Global Mono Ethylene Glycol Industry Revenue billion Forecast, by End-user Industry 2020 & 2033
- Table 28: Global Mono Ethylene Glycol Industry Revenue billion Forecast, by Country 2020 & 2033
- Table 29: Brazil Mono Ethylene Glycol Industry Revenue (billion) Forecast, by Application 2020 & 2033
- Table 30: Argentina Mono Ethylene Glycol Industry Revenue (billion) Forecast, by Application 2020 & 2033
- Table 31: Rest of South America Mono Ethylene Glycol Industry Revenue (billion) Forecast, by Application 2020 & 2033
- Table 32: Global Mono Ethylene Glycol Industry Revenue billion Forecast, by Application 2020 & 2033
- Table 33: Global Mono Ethylene Glycol Industry Revenue billion Forecast, by End-user Industry 2020 & 2033
- Table 34: Global Mono Ethylene Glycol Industry Revenue billion Forecast, by Country 2020 & 2033
- Table 35: Global Mono Ethylene Glycol Industry Revenue billion Forecast, by Application 2020 & 2033
- Table 36: Global Mono Ethylene Glycol Industry Revenue billion Forecast, by End-user Industry 2020 & 2033
- Table 37: Global Mono Ethylene Glycol Industry Revenue billion Forecast, by Country 2020 & 2033
- Table 38: South Africa Mono Ethylene Glycol Industry Revenue (billion) Forecast, by Application 2020 & 2033
- Table 39: Rest of Middle East Mono Ethylene Glycol Industry Revenue (billion) Forecast, by Application 2020 & 2033
Frequently Asked Questions
1. What is the projected Compound Annual Growth Rate (CAGR) of the Mono Ethylene Glycol Industry?
The projected CAGR is approximately 6.5%.
2. Which companies are prominent players in the Mono Ethylene Glycol Industry?
Key companies in the market include Nouryon, BASF SE, Dow, India Glycols Limited, LACC, LyondellBasell Industries Holdings BV, Mitsubishi Chemical Corporation, Nan Ya Plastics Corporation, Reliance Industries Limited, Royal Dutch Shell PLC, SABIC, Solventis*List Not Exhaustive.
3. What are the main segments of the Mono Ethylene Glycol Industry?
The market segments include Application, End-user Industry.
4. Can you provide details about the market size?
The market size is estimated to be USD 42.6 billion as of 2022.
5. What are some drivers contributing to market growth?
Growing Demand for PET in the Packaging Sector; Other Drivers.
6. What are the notable trends driving market growth?
Textile Sector to Dominate the Market.
7. Are there any restraints impacting market growth?
Growing Demand for PET in the Packaging Sector; Other Drivers.
8. Can you provide examples of recent developments in the market?
January 2022: ExxonMobil and SABIC announced the successful startup of Gulf Coast Growth Ventures' world-class manufacturing facility in San Patricio County, Texas. The new facility operations include a mono-ethylene glycol unit with an annual capacity of 1.1 million metric tons.
9. What pricing options are available for accessing the report?
Pricing options include single-user, multi-user, and enterprise licenses priced at USD 4750, USD 5250, and USD 8750 respectively.
10. Is the market size provided in terms of value or volume?
The market size is provided in terms of value, measured in billion.
11. Are there any specific market keywords associated with the report?
Yes, the market keyword associated with the report is "Mono Ethylene Glycol Industry," which aids in identifying and referencing the specific market segment covered.
12. How do I determine which pricing option suits my needs best?
The pricing options vary based on user requirements and access needs. Individual users may opt for single-user licenses, while businesses requiring broader access may choose multi-user or enterprise licenses for cost-effective access to the report.
13. Are there any additional resources or data provided in the Mono Ethylene Glycol Industry report?
While the report offers comprehensive insights, it's advisable to review the specific contents or supplementary materials provided to ascertain if additional resources or data are available.
14. How can I stay updated on further developments or reports in the Mono Ethylene Glycol Industry?
To stay informed about further developments, trends, and reports in the Mono Ethylene Glycol Industry, consider subscribing to industry newsletters, following relevant companies and organizations, or regularly checking reputable industry news sources and publications.
Methodology
Step 1 - Identification of Relevant Samples Size from Population Database


Step 2 - Approaches for Defining Global Market Size (Value, Volume* & Price*)

Note*: In applicable scenarios
Step 3 - Data Sources
Primary Research
- Web Analytics
- Survey Reports
- Research Institute
- Latest Research Reports
- Opinion Leaders
Secondary Research
- Annual Reports
- White Paper
- Latest Press Release
- Industry Association
- Paid Database
- Investor Presentations

Step 4 - Data Triangulation
Involves using different sources of information in order to increase the validity of a study
These sources are likely to be stakeholders in a program - participants, other researchers, program staff, other community members, and so on.
Then we put all data in single framework & apply various statistical tools to find out the dynamic on the market.
During the analysis stage, feedback from the stakeholder groups would be compared to determine areas of agreement as well as areas of divergence