

Key Insights
The methionine market, valued at $6310 million in 2025, is projected to grow at a compound annual growth rate (CAGR) of 4.3% through 2033. This expansion is primarily driven by escalating demand from the animal feed sector, a consequence of rising global meat consumption and intensified livestock farming. The pharmaceutical industry also significantly contributes, leveraging methionine in essential medications and supplements. Technological advancements in production processes further support market growth through enhanced efficiency and cost-effectiveness. However, raw material price volatility and potential regulatory challenges concerning food safety and environmental impact present some growth constraints. While the liquid form of methionine currently leads the market share, the powder segment is anticipated to experience faster growth due to its ease of handling and storage in specific applications. Geographically, the Asia-Pacific region, particularly China and India, leads the market, attributed to substantial livestock populations and increasing demand for animal protein. North America and Europe are also significant markets, characterized by advanced animal farming practices and high per capita meat consumption. Key industry players, including Sumitomo Chemical, Evonik Industries, and Adisseo, are engaged in competitive strategies focused on product innovation and expansion into emerging markets. The market is segmented by end-user industry (animal feed, pharmaceutical, food & beverage, others) and product type (liquid, powder), offering detailed market insights.
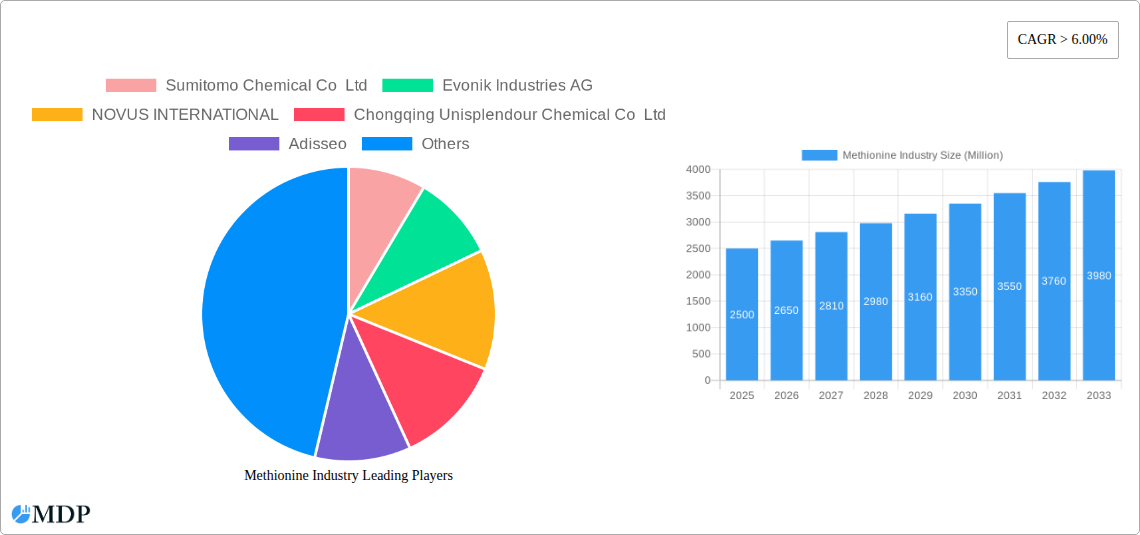
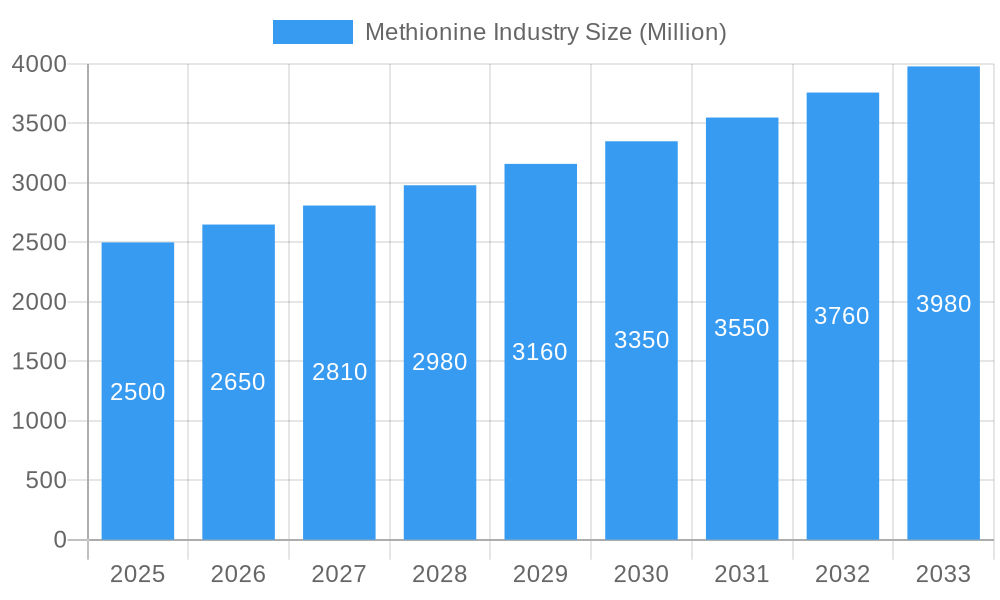
Methionine Industry Market Size (In Billion)
The forecast period (2025-2033) indicates sustained growth, propelled by expanding animal feed production in developing economies and the increasing adoption of methionine supplementation to enhance animal growth rates and nutritional value. Competition among established players is expected to intensify, with a focus on technological innovations for improved production efficiency and cost reduction. Furthermore, market participants will prioritize sustainable and environmentally friendly production methods to meet evolving consumer and regulatory demands. Geographic expansion and diversification into related products will be crucial for long-term sustainable growth. Overall, the methionine market presents a promising investment opportunity, underpinned by strong market trends and the essential role of methionine across various industrial sectors.
Methionine Industry Company Market Share
Methionine Industry Market Report: 2019-2033
Unlocking Growth Potential in the Global Methionine Market: A Comprehensive Analysis & Forecast (2019-2033)
This comprehensive report provides an in-depth analysis of the global methionine market, offering valuable insights for stakeholders across the value chain. From market dynamics and competitive landscapes to future growth opportunities, this report serves as an essential resource for strategic decision-making. The study period covers 2019-2033, with 2025 as the base and estimated year. The forecast period spans 2025-2033, encompassing historical data from 2019-2024. The market is segmented by end-user industry (Food and Beverage, Pharmaceutical, Animal Feed, Other End-user Industries) and product type (Liquid, Powder). Key players including Sumitomo Chemical Co Ltd, Evonik Industries AG, NOVUS INTERNATIONAL, Chongqing Unisplendour Chemical Co Ltd, Adisseo, Volzhsky Orgsynthese JSC, Zhejiang NHU Co Ltd, and CJ CheilJedang Corp are analyzed in detail. Expected total market value by 2033 is predicted to reach xx Million.
Methionine Industry Market Dynamics & Concentration
The global methionine market is characterized by moderate concentration, with a few major players holding significant market share. While precise market share figures for each company vary and require in-depth competitive analysis, the market demonstrates a trend towards consolidation driven by mergers and acquisitions (M&A) activities and significant capacity expansions. Over the period 2019-2024, an estimated xx M&A deals were recorded, further shaping the competitive landscape. Innovation plays a crucial role, with companies focusing on improving production efficiency, developing new formulations, and exploring novel applications. Stringent regulatory frameworks governing food safety and environmental regulations significantly impact operations. The industry experiences competitive pressure from substitute products such as other amino acids and feed additives. End-user trends, particularly in the animal feed sector, heavily influence market demand, with growing concerns about animal health and nutrition driving demand for high-quality methionine.
Methionine Industry Industry Trends & Analysis
The global methionine market experienced a Compound Annual Growth Rate (CAGR) of xx% during the historical period (2019-2024). This growth is primarily driven by the increasing demand from the animal feed industry, particularly in developing economies with expanding livestock populations. Technological advancements in production processes, enhancing efficiency and reducing costs, also contribute significantly. Consumer preferences for sustainably produced animal feed are increasingly influencing sourcing decisions, putting pressure on manufacturers to adopt eco-friendly practices. The market penetration of liquid methionine is steadily increasing due to its ease of handling and improved bioavailability. The competitive landscape is characterized by intense rivalry among key players, driving innovation and price competition, whilst overall market growth is expected to reach xx Million by 2033.
Leading Markets & Segments in Methionine Industry
Dominant Segment: The animal feed industry is the largest consumer of methionine, accounting for approximately xx% of the total market. This dominance stems from the essential role of methionine in animal nutrition, particularly for poultry and swine.
Leading Regions: The Asia-Pacific region is expected to maintain its leading position throughout the forecast period, driven by robust growth in livestock production and rising disposable incomes. Key drivers include supportive government policies promoting livestock farming, and substantial investments in feed infrastructure. North America and Europe continue to represent significant markets, though growth rates are comparatively slower.
Product Type: While powder methionine has historically held a larger market share, liquid methionine is gaining traction due to ease of handling and improved efficiency in feed formulation.
Key Drivers:
- Expanding livestock populations in developing countries.
- Increasing consumer demand for protein-rich diets.
- Growing awareness of the importance of animal nutrition.
- Government support for livestock farming in key regions.
- Advancements in production technology.
Methionine Industry Product Developments
Recent years have witnessed significant advancements in methionine production, focusing on improving product quality and efficiency. Companies are increasingly focusing on liquid methionine production given its superior handling and mixing properties. This trend aligns with the industry's pursuit of enhanced feed formulation techniques leading to more cost-effective, and higher quality animal feed.
Key Drivers of Methionine Industry Growth
The methionine market is driven by several factors. The expanding global population and increasing demand for protein-rich food sources fuel the growth of the animal feed industry, consequently boosting methionine demand. Technological advancements in fermentation processes have improved production efficiency and lowered costs. Government policies supporting sustainable animal farming and investments in feed infrastructure in emerging economies further contribute to market expansion.
Challenges in the Methionine Industry Market
The methionine market faces challenges, including volatile raw material prices, stringent environmental regulations leading to increased production costs, and fluctuations in the global supply chain impacting raw material availability and timely production. Intense competition among major players exerts downward pressure on profit margins.
Emerging Opportunities in Methionine Industry
Future growth in the methionine market hinges on strategic partnerships to secure raw materials and access new markets. Technological innovations, focusing on production efficiency and sustainability, will drive cost reductions and improved environmental performance. Expansion into new geographical areas with growing livestock production presents substantial growth opportunities.
Leading Players in the Methionine Industry Sector
- Sumitomo Chemical Co Ltd
- Evonik Industries AG
- NOVUS INTERNATIONAL
- Chongqing Unisplendour Chemical Co Ltd
- Adisseo
- Volzhsky Orgsynthese JSC
- Zhejiang NHU Co Ltd
- CJ CheilJedang Corp
Key Milestones in Methionine Industry Industry
- September 2022: Adisseo commissioned its new 180,000-ton liquid methionine plant in Nanjing, China, doubling its capacity to 350,000 tons. This significantly bolstered its global market leadership.
- March 2022: Evonik invested USD 176.5 Million to expand its methyl mercaptan production facility in Theodore, Alabama, enhancing its MetAmino (DL-methionine) production capacity and supporting its animal nutrition business.
Strategic Outlook for Methionine Industry Market
The methionine market presents significant long-term growth potential, driven by increasing global demand for animal protein. Strategic acquisitions, capacity expansions, and technological advancements will shape the competitive landscape. Companies focusing on sustainable production practices, product innovation, and market diversification will be best positioned to capture future market share.
Methionine Industry Segmentation
-
1. Type
- 1.1. Liquid
- 1.2. Powder
-
2. End-user Industry
- 2.1. Food and Beverage
- 2.2. Pharmaceutical
- 2.3. Animal Feed
- 2.4. Other End-user Industries
Methionine Industry Segmentation By Geography
-
1. Asia Pacific
- 1.1. China
- 1.2. India
- 1.3. Japan
- 1.4. South Korea
- 1.5. Rest of Asia Pacific
-
2. North America
- 2.1. United States
- 2.2. Canada
- 2.3. Mexico
-
3. Europe
- 3.1. Germany
- 3.2. United Kingdom
- 3.3. Italy
- 3.4. France
- 3.5. Rest of Europe
-
4. South America
- 4.1. Brazil
- 4.2. Argentina
- 4.3. Rest of South America
-
5. Middle East and Africa
- 5.1. Saudi Arabia
- 5.2. South Africa
- 5.3. Rest of Middle East and Africa
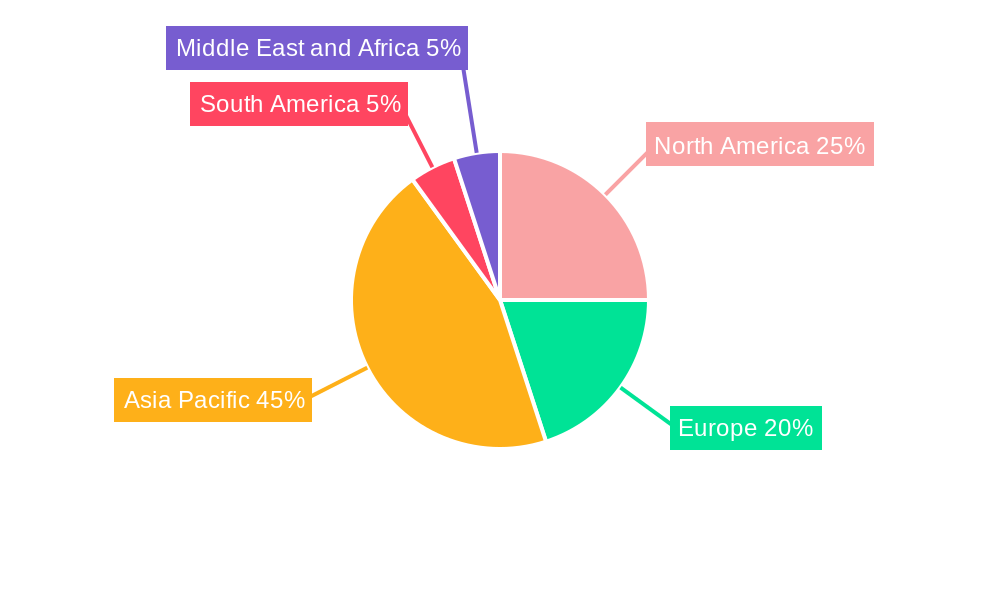
Methionine Industry Regional Market Share
Geographic Coverage of Methionine Industry
Methionine Industry REPORT HIGHLIGHTS
| Aspects | Details |
|---|---|
| Study Period | 2020-2034 |
| Base Year | 2025 |
| Estimated Year | 2026 |
| Forecast Period | 2026-2034 |
| Historical Period | 2020-2025 |
| Growth Rate | CAGR of 4.3% from 2020-2034 |
| Segmentation |
|
Table of Contents
- 1. Introduction
- 1.1. Research Scope
- 1.2. Market Segmentation
- 1.3. Research Methodology
- 1.4. Definitions and Assumptions
- 2. Executive Summary
- 2.1. Introduction
- 3. Market Dynamics
- 3.1. Introduction
- 3.2. Market Drivers
- 3.2.1. Growing Demand from the Poultry Industry; Emerging Demand from the Aquaculture Industry
- 3.3. Market Restrains
- 3.3.1. Complex Process of Manufacturing Methionine
- 3.4. Market Trends
- 3.4.1. Increasing Demand from the Animal Feed Segment
- 4. Market Factor Analysis
- 4.1. Porters Five Forces
- 4.2. Supply/Value Chain
- 4.3. PESTEL analysis
- 4.4. Market Entropy
- 4.5. Patent/Trademark Analysis
- 5. Global Methionine Industry Analysis, Insights and Forecast, 2020-2032
- 5.1. Market Analysis, Insights and Forecast - by Type
- 5.1.1. Liquid
- 5.1.2. Powder
- 5.2. Market Analysis, Insights and Forecast - by End-user Industry
- 5.2.1. Food and Beverage
- 5.2.2. Pharmaceutical
- 5.2.3. Animal Feed
- 5.2.4. Other End-user Industries
- 5.3. Market Analysis, Insights and Forecast - by Region
- 5.3.1. Asia Pacific
- 5.3.2. North America
- 5.3.3. Europe
- 5.3.4. South America
- 5.3.5. Middle East and Africa
- 5.1. Market Analysis, Insights and Forecast - by Type
- 6. Asia Pacific Methionine Industry Analysis, Insights and Forecast, 2020-2032
- 6.1. Market Analysis, Insights and Forecast - by Type
- 6.1.1. Liquid
- 6.1.2. Powder
- 6.2. Market Analysis, Insights and Forecast - by End-user Industry
- 6.2.1. Food and Beverage
- 6.2.2. Pharmaceutical
- 6.2.3. Animal Feed
- 6.2.4. Other End-user Industries
- 6.1. Market Analysis, Insights and Forecast - by Type
- 7. North America Methionine Industry Analysis, Insights and Forecast, 2020-2032
- 7.1. Market Analysis, Insights and Forecast - by Type
- 7.1.1. Liquid
- 7.1.2. Powder
- 7.2. Market Analysis, Insights and Forecast - by End-user Industry
- 7.2.1. Food and Beverage
- 7.2.2. Pharmaceutical
- 7.2.3. Animal Feed
- 7.2.4. Other End-user Industries
- 7.1. Market Analysis, Insights and Forecast - by Type
- 8. Europe Methionine Industry Analysis, Insights and Forecast, 2020-2032
- 8.1. Market Analysis, Insights and Forecast - by Type
- 8.1.1. Liquid
- 8.1.2. Powder
- 8.2. Market Analysis, Insights and Forecast - by End-user Industry
- 8.2.1. Food and Beverage
- 8.2.2. Pharmaceutical
- 8.2.3. Animal Feed
- 8.2.4. Other End-user Industries
- 8.1. Market Analysis, Insights and Forecast - by Type
- 9. South America Methionine Industry Analysis, Insights and Forecast, 2020-2032
- 9.1. Market Analysis, Insights and Forecast - by Type
- 9.1.1. Liquid
- 9.1.2. Powder
- 9.2. Market Analysis, Insights and Forecast - by End-user Industry
- 9.2.1. Food and Beverage
- 9.2.2. Pharmaceutical
- 9.2.3. Animal Feed
- 9.2.4. Other End-user Industries
- 9.1. Market Analysis, Insights and Forecast - by Type
- 10. Middle East and Africa Methionine Industry Analysis, Insights and Forecast, 2020-2032
- 10.1. Market Analysis, Insights and Forecast - by Type
- 10.1.1. Liquid
- 10.1.2. Powder
- 10.2. Market Analysis, Insights and Forecast - by End-user Industry
- 10.2.1. Food and Beverage
- 10.2.2. Pharmaceutical
- 10.2.3. Animal Feed
- 10.2.4. Other End-user Industries
- 10.1. Market Analysis, Insights and Forecast - by Type
- 11. Competitive Analysis
- 11.1. Global Market Share Analysis 2025
- 11.2. Company Profiles
- 11.2.1 Sumitomo Chemical Co Ltd
- 11.2.1.1. Overview
- 11.2.1.2. Products
- 11.2.1.3. SWOT Analysis
- 11.2.1.4. Recent Developments
- 11.2.1.5. Financials (Based on Availability)
- 11.2.2 Evonik Industries AG
- 11.2.2.1. Overview
- 11.2.2.2. Products
- 11.2.2.3. SWOT Analysis
- 11.2.2.4. Recent Developments
- 11.2.2.5. Financials (Based on Availability)
- 11.2.3 NOVUS INTERNATIONAL
- 11.2.3.1. Overview
- 11.2.3.2. Products
- 11.2.3.3. SWOT Analysis
- 11.2.3.4. Recent Developments
- 11.2.3.5. Financials (Based on Availability)
- 11.2.4 Chongqing Unisplendour Chemical Co Ltd
- 11.2.4.1. Overview
- 11.2.4.2. Products
- 11.2.4.3. SWOT Analysis
- 11.2.4.4. Recent Developments
- 11.2.4.5. Financials (Based on Availability)
- 11.2.5 Adisseo
- 11.2.5.1. Overview
- 11.2.5.2. Products
- 11.2.5.3. SWOT Analysis
- 11.2.5.4. Recent Developments
- 11.2.5.5. Financials (Based on Availability)
- 11.2.6 Volzhsky Orgsynthese JSC
- 11.2.6.1. Overview
- 11.2.6.2. Products
- 11.2.6.3. SWOT Analysis
- 11.2.6.4. Recent Developments
- 11.2.6.5. Financials (Based on Availability)
- 11.2.7 Zhejiang NHU Co Ltd*List Not Exhaustive
- 11.2.7.1. Overview
- 11.2.7.2. Products
- 11.2.7.3. SWOT Analysis
- 11.2.7.4. Recent Developments
- 11.2.7.5. Financials (Based on Availability)
- 11.2.8 CJ CheilJedang Corp
- 11.2.8.1. Overview
- 11.2.8.2. Products
- 11.2.8.3. SWOT Analysis
- 11.2.8.4. Recent Developments
- 11.2.8.5. Financials (Based on Availability)
- 11.2.1 Sumitomo Chemical Co Ltd
List of Figures
- Figure 1: Global Methionine Industry Revenue Breakdown (million, %) by Region 2025 & 2033
- Figure 2: Asia Pacific Methionine Industry Revenue (million), by Type 2025 & 2033
- Figure 3: Asia Pacific Methionine Industry Revenue Share (%), by Type 2025 & 2033
- Figure 4: Asia Pacific Methionine Industry Revenue (million), by End-user Industry 2025 & 2033
- Figure 5: Asia Pacific Methionine Industry Revenue Share (%), by End-user Industry 2025 & 2033
- Figure 6: Asia Pacific Methionine Industry Revenue (million), by Country 2025 & 2033
- Figure 7: Asia Pacific Methionine Industry Revenue Share (%), by Country 2025 & 2033
- Figure 8: North America Methionine Industry Revenue (million), by Type 2025 & 2033
- Figure 9: North America Methionine Industry Revenue Share (%), by Type 2025 & 2033
- Figure 10: North America Methionine Industry Revenue (million), by End-user Industry 2025 & 2033
- Figure 11: North America Methionine Industry Revenue Share (%), by End-user Industry 2025 & 2033
- Figure 12: North America Methionine Industry Revenue (million), by Country 2025 & 2033
- Figure 13: North America Methionine Industry Revenue Share (%), by Country 2025 & 2033
- Figure 14: Europe Methionine Industry Revenue (million), by Type 2025 & 2033
- Figure 15: Europe Methionine Industry Revenue Share (%), by Type 2025 & 2033
- Figure 16: Europe Methionine Industry Revenue (million), by End-user Industry 2025 & 2033
- Figure 17: Europe Methionine Industry Revenue Share (%), by End-user Industry 2025 & 2033
- Figure 18: Europe Methionine Industry Revenue (million), by Country 2025 & 2033
- Figure 19: Europe Methionine Industry Revenue Share (%), by Country 2025 & 2033
- Figure 20: South America Methionine Industry Revenue (million), by Type 2025 & 2033
- Figure 21: South America Methionine Industry Revenue Share (%), by Type 2025 & 2033
- Figure 22: South America Methionine Industry Revenue (million), by End-user Industry 2025 & 2033
- Figure 23: South America Methionine Industry Revenue Share (%), by End-user Industry 2025 & 2033
- Figure 24: South America Methionine Industry Revenue (million), by Country 2025 & 2033
- Figure 25: South America Methionine Industry Revenue Share (%), by Country 2025 & 2033
- Figure 26: Middle East and Africa Methionine Industry Revenue (million), by Type 2025 & 2033
- Figure 27: Middle East and Africa Methionine Industry Revenue Share (%), by Type 2025 & 2033
- Figure 28: Middle East and Africa Methionine Industry Revenue (million), by End-user Industry 2025 & 2033
- Figure 29: Middle East and Africa Methionine Industry Revenue Share (%), by End-user Industry 2025 & 2033
- Figure 30: Middle East and Africa Methionine Industry Revenue (million), by Country 2025 & 2033
- Figure 31: Middle East and Africa Methionine Industry Revenue Share (%), by Country 2025 & 2033
List of Tables
- Table 1: Global Methionine Industry Revenue million Forecast, by Type 2020 & 2033
- Table 2: Global Methionine Industry Revenue million Forecast, by End-user Industry 2020 & 2033
- Table 3: Global Methionine Industry Revenue million Forecast, by Region 2020 & 2033
- Table 4: Global Methionine Industry Revenue million Forecast, by Type 2020 & 2033
- Table 5: Global Methionine Industry Revenue million Forecast, by End-user Industry 2020 & 2033
- Table 6: Global Methionine Industry Revenue million Forecast, by Country 2020 & 2033
- Table 7: China Methionine Industry Revenue (million) Forecast, by Application 2020 & 2033
- Table 8: India Methionine Industry Revenue (million) Forecast, by Application 2020 & 2033
- Table 9: Japan Methionine Industry Revenue (million) Forecast, by Application 2020 & 2033
- Table 10: South Korea Methionine Industry Revenue (million) Forecast, by Application 2020 & 2033
- Table 11: Rest of Asia Pacific Methionine Industry Revenue (million) Forecast, by Application 2020 & 2033
- Table 12: Global Methionine Industry Revenue million Forecast, by Type 2020 & 2033
- Table 13: Global Methionine Industry Revenue million Forecast, by End-user Industry 2020 & 2033
- Table 14: Global Methionine Industry Revenue million Forecast, by Country 2020 & 2033
- Table 15: United States Methionine Industry Revenue (million) Forecast, by Application 2020 & 2033
- Table 16: Canada Methionine Industry Revenue (million) Forecast, by Application 2020 & 2033
- Table 17: Mexico Methionine Industry Revenue (million) Forecast, by Application 2020 & 2033
- Table 18: Global Methionine Industry Revenue million Forecast, by Type 2020 & 2033
- Table 19: Global Methionine Industry Revenue million Forecast, by End-user Industry 2020 & 2033
- Table 20: Global Methionine Industry Revenue million Forecast, by Country 2020 & 2033
- Table 21: Germany Methionine Industry Revenue (million) Forecast, by Application 2020 & 2033
- Table 22: United Kingdom Methionine Industry Revenue (million) Forecast, by Application 2020 & 2033
- Table 23: Italy Methionine Industry Revenue (million) Forecast, by Application 2020 & 2033
- Table 24: France Methionine Industry Revenue (million) Forecast, by Application 2020 & 2033
- Table 25: Rest of Europe Methionine Industry Revenue (million) Forecast, by Application 2020 & 2033
- Table 26: Global Methionine Industry Revenue million Forecast, by Type 2020 & 2033
- Table 27: Global Methionine Industry Revenue million Forecast, by End-user Industry 2020 & 2033
- Table 28: Global Methionine Industry Revenue million Forecast, by Country 2020 & 2033
- Table 29: Brazil Methionine Industry Revenue (million) Forecast, by Application 2020 & 2033
- Table 30: Argentina Methionine Industry Revenue (million) Forecast, by Application 2020 & 2033
- Table 31: Rest of South America Methionine Industry Revenue (million) Forecast, by Application 2020 & 2033
- Table 32: Global Methionine Industry Revenue million Forecast, by Type 2020 & 2033
- Table 33: Global Methionine Industry Revenue million Forecast, by End-user Industry 2020 & 2033
- Table 34: Global Methionine Industry Revenue million Forecast, by Country 2020 & 2033
- Table 35: Saudi Arabia Methionine Industry Revenue (million) Forecast, by Application 2020 & 2033
- Table 36: South Africa Methionine Industry Revenue (million) Forecast, by Application 2020 & 2033
- Table 37: Rest of Middle East and Africa Methionine Industry Revenue (million) Forecast, by Application 2020 & 2033
Frequently Asked Questions
1. What is the projected Compound Annual Growth Rate (CAGR) of the Methionine Industry?
The projected CAGR is approximately 4.3%.
2. Which companies are prominent players in the Methionine Industry?
Key companies in the market include Sumitomo Chemical Co Ltd, Evonik Industries AG, NOVUS INTERNATIONAL, Chongqing Unisplendour Chemical Co Ltd, Adisseo, Volzhsky Orgsynthese JSC, Zhejiang NHU Co Ltd*List Not Exhaustive, CJ CheilJedang Corp.
3. What are the main segments of the Methionine Industry?
The market segments include Type, End-user Industry.
4. Can you provide details about the market size?
The market size is estimated to be USD 6310 million as of 2022.
5. What are some drivers contributing to market growth?
Growing Demand from the Poultry Industry; Emerging Demand from the Aquaculture Industry.
6. What are the notable trends driving market growth?
Increasing Demand from the Animal Feed Segment.
7. Are there any restraints impacting market growth?
Complex Process of Manufacturing Methionine.
8. Can you provide examples of recent developments in the market?
September 2022: Adisseo started liquid methionine production through its 180,000-ton new plant in Nanjing, China. The company has doubled its methionine capacity to 350,000 tons through its operational new plant consolidating its leading position in the world.
9. What pricing options are available for accessing the report?
Pricing options include single-user, multi-user, and enterprise licenses priced at USD 4750, USD 5250, and USD 8750 respectively.
10. Is the market size provided in terms of value or volume?
The market size is provided in terms of value, measured in million.
11. Are there any specific market keywords associated with the report?
Yes, the market keyword associated with the report is "Methionine Industry," which aids in identifying and referencing the specific market segment covered.
12. How do I determine which pricing option suits my needs best?
The pricing options vary based on user requirements and access needs. Individual users may opt for single-user licenses, while businesses requiring broader access may choose multi-user or enterprise licenses for cost-effective access to the report.
13. Are there any additional resources or data provided in the Methionine Industry report?
While the report offers comprehensive insights, it's advisable to review the specific contents or supplementary materials provided to ascertain if additional resources or data are available.
14. How can I stay updated on further developments or reports in the Methionine Industry?
To stay informed about further developments, trends, and reports in the Methionine Industry, consider subscribing to industry newsletters, following relevant companies and organizations, or regularly checking reputable industry news sources and publications.
Methodology
Step 1 - Identification of Relevant Samples Size from Population Database


Step 2 - Approaches for Defining Global Market Size (Value, Volume* & Price*)

Note*: In applicable scenarios
Step 3 - Data Sources
Primary Research
- Web Analytics
- Survey Reports
- Research Institute
- Latest Research Reports
- Opinion Leaders
Secondary Research
- Annual Reports
- White Paper
- Latest Press Release
- Industry Association
- Paid Database
- Investor Presentations

Step 4 - Data Triangulation
Involves using different sources of information in order to increase the validity of a study
These sources are likely to be stakeholders in a program - participants, other researchers, program staff, other community members, and so on.
Then we put all data in single framework & apply various statistical tools to find out the dynamic on the market.
During the analysis stage, feedback from the stakeholder groups would be compared to determine areas of agreement as well as areas of divergence